Ramos, PR Map & Demographics
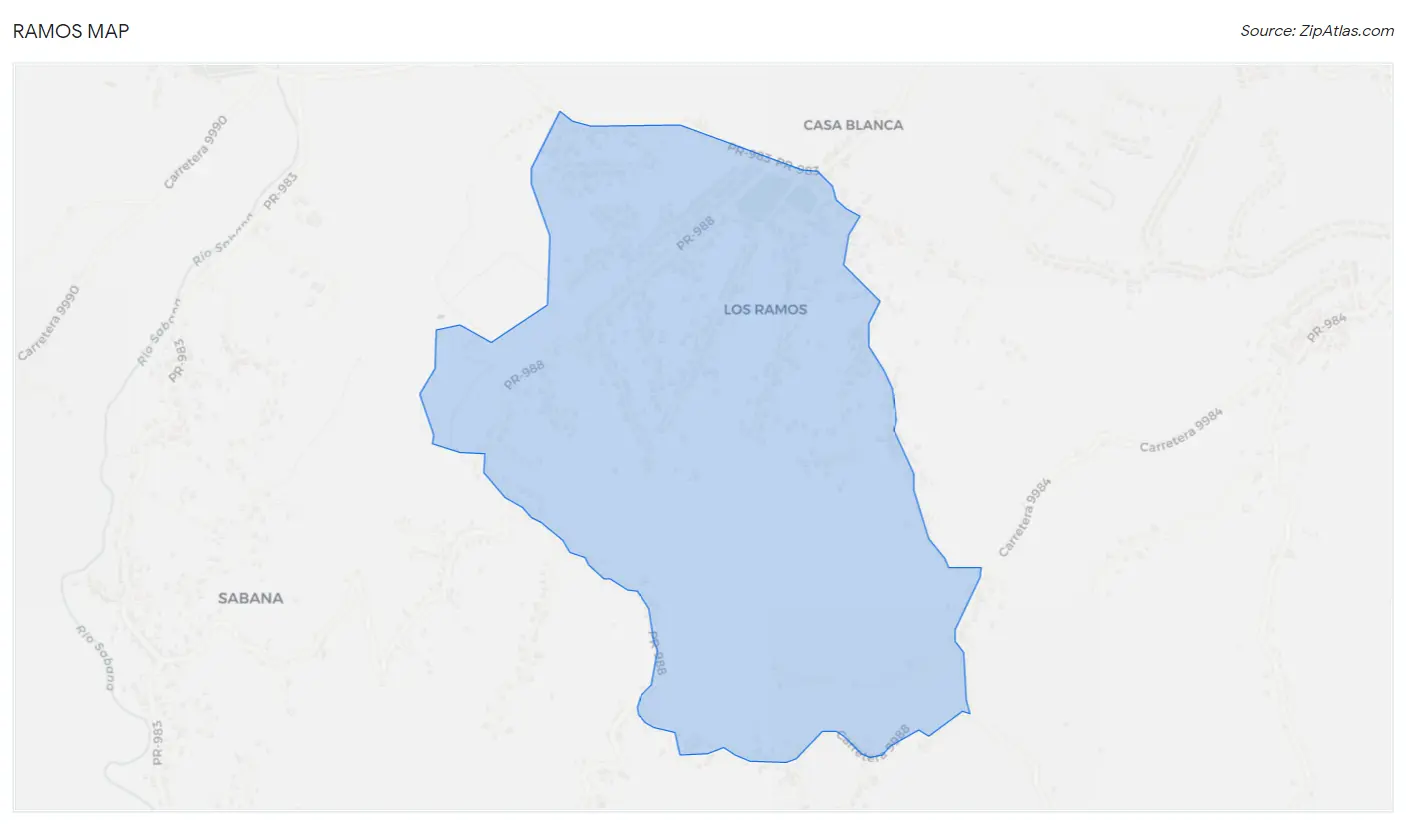
Ramos Map
Ramos Overview
$11,359
PER CAPITA INCOME
$25,615
AVG FAMILY INCOME
$25,000
AVG HOUSEHOLD INCOME
3.1%
WAGE / INCOME GAP [ % ]
96.9¢/ $1
WAGE / INCOME GAP [ $ ]
$9,083
FAMILY INCOME DEFICIT
0.35
INEQUALITY / GINI INDEX
1,319
TOTAL POPULATION
641
MALE POPULATION
678
FEMALE POPULATION
94.54
MALES / 100 FEMALES
105.77
FEMALES / 100 MALES
51.4
MEDIAN AGE
3.5
AVG FAMILY SIZE
2.8
AVG HOUSEHOLD SIZE
486
LABOR FORCE [ PEOPLE ]
40.9%
PERCENT IN LABOR FORCE
36.4%
UNEMPLOYMENT RATE
Income in Ramos
Income Overview in Ramos
Per Capita Income in Ramos is $11,359, while median incomes of families and households are $25,615 and $25,000 respectively.
| Characteristic | Number | Measure |
| Per Capita Income | 1,319 | $11,359 |
| Median Family Income | 315 | $25,615 |
| Mean Family Income | 315 | $31,080 |
| Median Household Income | 464 | $25,000 |
| Mean Household Income | 464 | $28,195 |
| Income Deficit | 315 | $9,083 |
| Wage / Income Gap (%) | 1,319 | 3.06% |
| Wage / Income Gap ($) | 1,319 | 96.94¢ per $1 |
| Gini / Inequality Index | 1,319 | 0.35 |
Earnings by Sex in Ramos
Average Earnings in Ramos are $19,635, $20,096 for men and $19,481 for women, a difference of 3.1%.
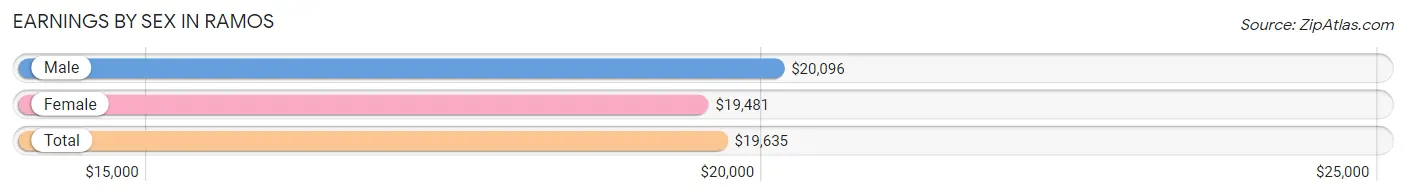
| Sex | Number | Average Earnings |
| Male | 197 (46.5%) | $20,096 |
| Female | 227 (53.5%) | $19,481 |
| Total | 424 (100.0%) | $19,635 |
Earnings by Sex by Income Bracket in Ramos
The most common earnings brackets in Ramos are $2,499 or less for men (42 | 21.3%) and $17,500 to $19,999 for women (65 | 28.6%).
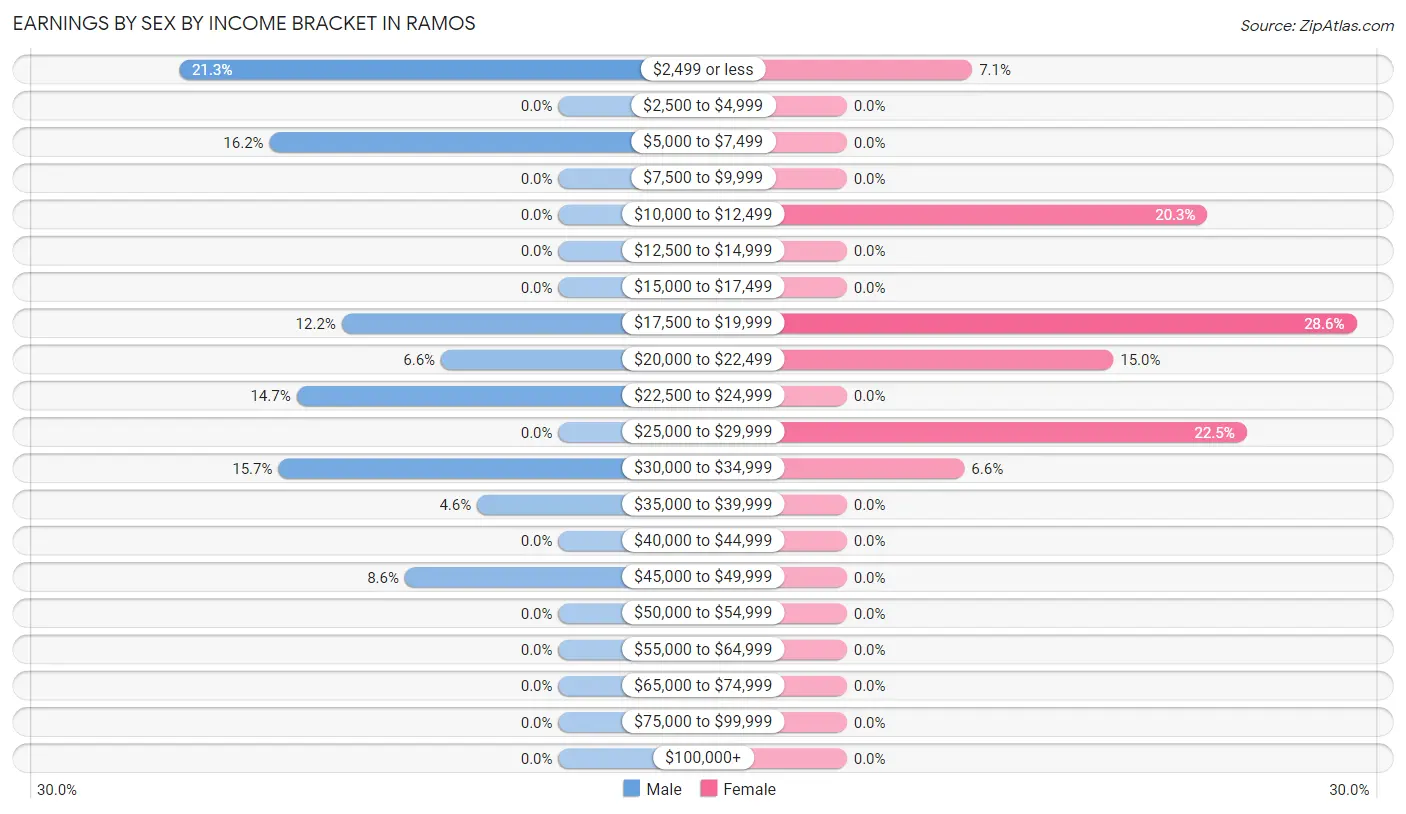
| Income | Male | Female |
| $2,499 or less | 42 (21.3%) | 16 (7.0%) |
| $2,500 to $4,999 | 0 (0.0%) | 0 (0.0%) |
| $5,000 to $7,499 | 32 (16.2%) | 0 (0.0%) |
| $7,500 to $9,999 | 0 (0.0%) | 0 (0.0%) |
| $10,000 to $12,499 | 0 (0.0%) | 46 (20.3%) |
| $12,500 to $14,999 | 0 (0.0%) | 0 (0.0%) |
| $15,000 to $17,499 | 0 (0.0%) | 0 (0.0%) |
| $17,500 to $19,999 | 24 (12.2%) | 65 (28.6%) |
| $20,000 to $22,499 | 13 (6.6%) | 34 (15.0%) |
| $22,500 to $24,999 | 29 (14.7%) | 0 (0.0%) |
| $25,000 to $29,999 | 0 (0.0%) | 51 (22.5%) |
| $30,000 to $34,999 | 31 (15.7%) | 15 (6.6%) |
| $35,000 to $39,999 | 9 (4.6%) | 0 (0.0%) |
| $40,000 to $44,999 | 0 (0.0%) | 0 (0.0%) |
| $45,000 to $49,999 | 17 (8.6%) | 0 (0.0%) |
| $50,000 to $54,999 | 0 (0.0%) | 0 (0.0%) |
| $55,000 to $64,999 | 0 (0.0%) | 0 (0.0%) |
| $65,000 to $74,999 | 0 (0.0%) | 0 (0.0%) |
| $75,000 to $99,999 | 0 (0.0%) | 0 (0.0%) |
| $100,000+ | 0 (0.0%) | 0 (0.0%) |
| Total | 197 (100.0%) | 227 (100.0%) |
Earnings by Sex by Educational Attainment in Ramos
Average earnings in Ramos are $20,096 for men and $20,625 for women, a difference of 2.6%. Men with an educational attainment of high school diploma enjoy the highest average annual earnings of $23,534, while those with college or associate's degree education earn the least with $21,442. Women with an educational attainment of college or associate's degree earn the most with the average annual earnings of $18,036, while those with college or associate's degree education have the smallest earnings of $18,036.
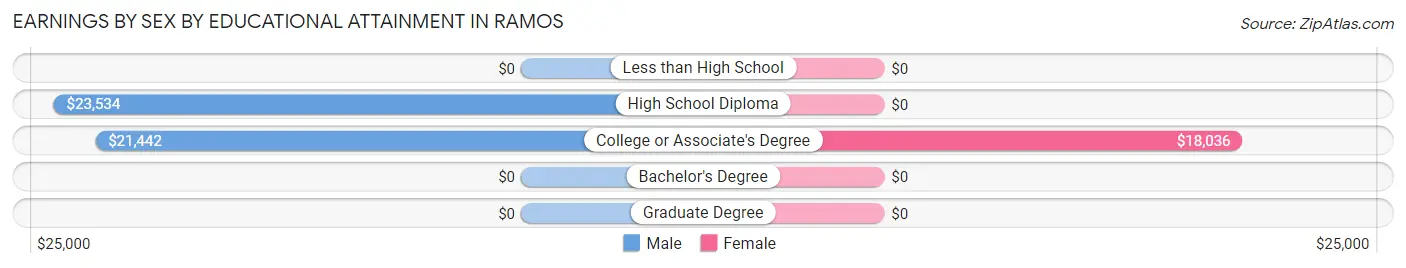
| Educational Attainment | Male Income | Female Income |
| Less than High School | - | - |
| High School Diploma | $23,534 | $0 |
| College or Associate's Degree | $21,442 | $18,036 |
| Bachelor's Degree | - | - |
| Graduate Degree | - | - |
| Total | $20,096 | $20,625 |
Family Income in Ramos
Family Income Brackets in Ramos
According to the Ramos family income data, there are 90 families falling into the $15,000 to $24,999 income range, which is the most common income bracket and makes up 28.6% of all families.
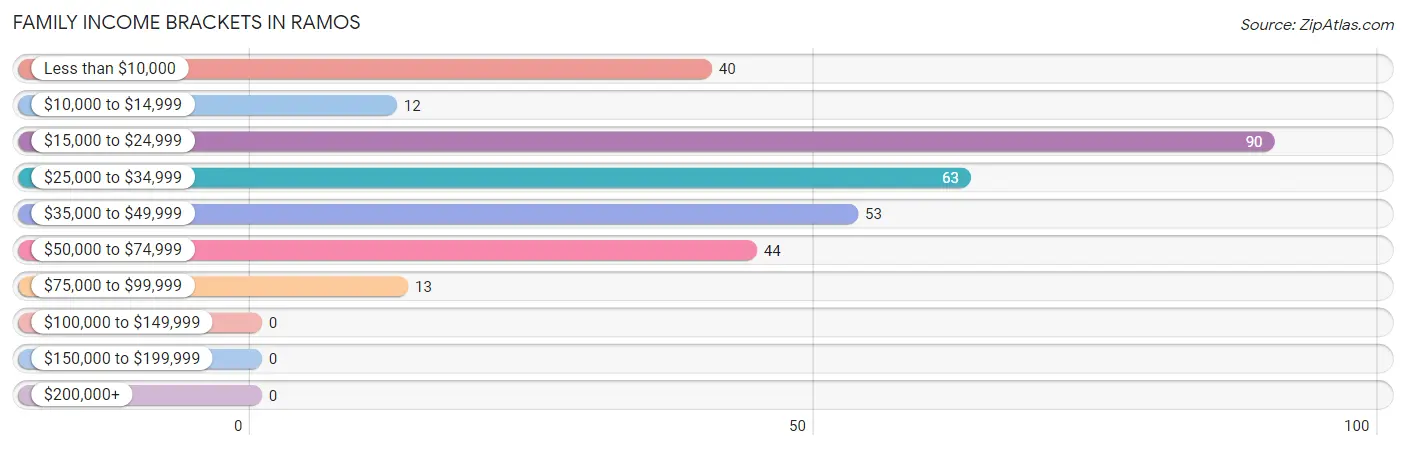
| Income Bracket | # Families | % Families |
| Less than $10,000 | 40 | 12.7% |
| $10,000 to $14,999 | 12 | 3.8% |
| $15,000 to $24,999 | 90 | 28.6% |
| $25,000 to $34,999 | 63 | 20.0% |
| $35,000 to $49,999 | 53 | 16.8% |
| $50,000 to $74,999 | 44 | 14.0% |
| $75,000 to $99,999 | 13 | 4.1% |
| $100,000 to $149,999 | 0 | 0.0% |
| $150,000 to $199,999 | 0 | 0.0% |
| $200,000+ | 0 | 0.0% |
Family Income by Famaliy Size in Ramos
5-person families (57 | 18.1%) account for the highest median family income in Ramos with $58,403 per family, while 2-person families (221 | 70.2%) have the highest median income of $12,609 per family member.
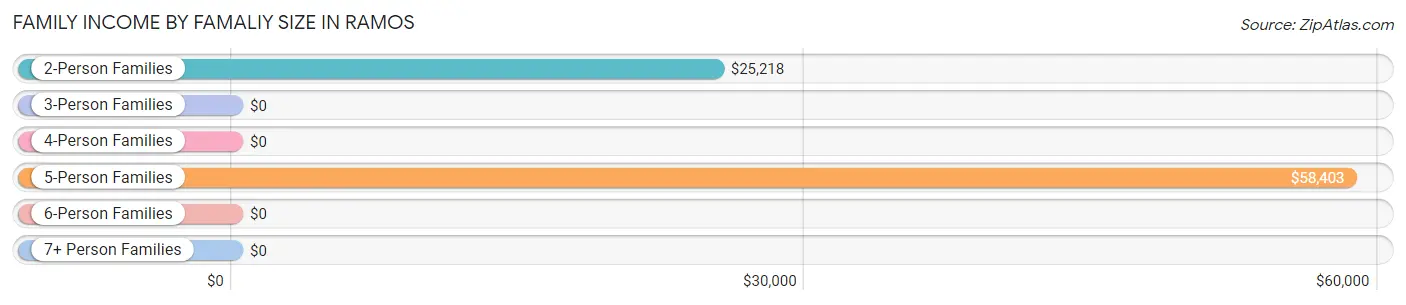
| Income Bracket | # Families | Median Income |
| 2-Person Families | 221 (70.2%) | $25,218 |
| 3-Person Families | 28 (8.9%) | $0 |
| 4-Person Families | 0 (0.0%) | $0 |
| 5-Person Families | 57 (18.1%) | $58,403 |
| 6-Person Families | 0 (0.0%) | $0 |
| 7+ Person Families | 9 (2.9%) | $0 |
| Total | 315 (100.0%) | $25,615 |
Family Income by Number of Earners in Ramos
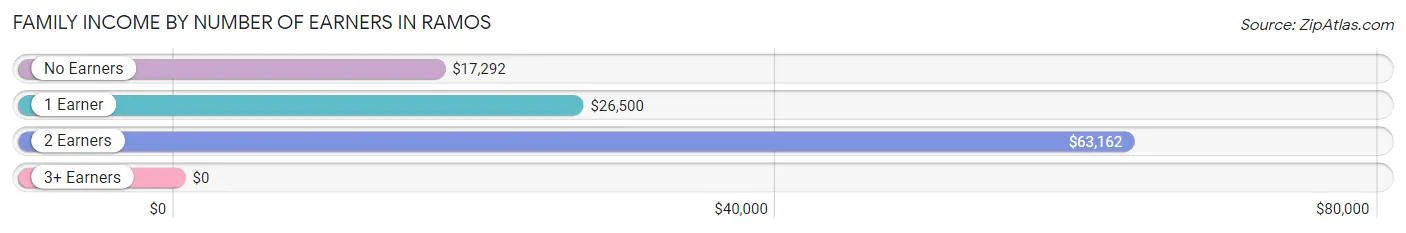
| Number of Earners | # Families | Median Income |
| No Earners | 148 (47.0%) | $17,292 |
| 1 Earner | 98 (31.1%) | $26,500 |
| 2 Earners | 51 (16.2%) | $63,162 |
| 3+ Earners | 18 (5.7%) | $0 |
| Total | 315 (100.0%) | $25,615 |
Household Income in Ramos
Household Income Brackets in Ramos
With 135 households falling in the category, the $15,000 to $24,999 income range is the most frequent in Ramos, accounting for 29.1% of all households.
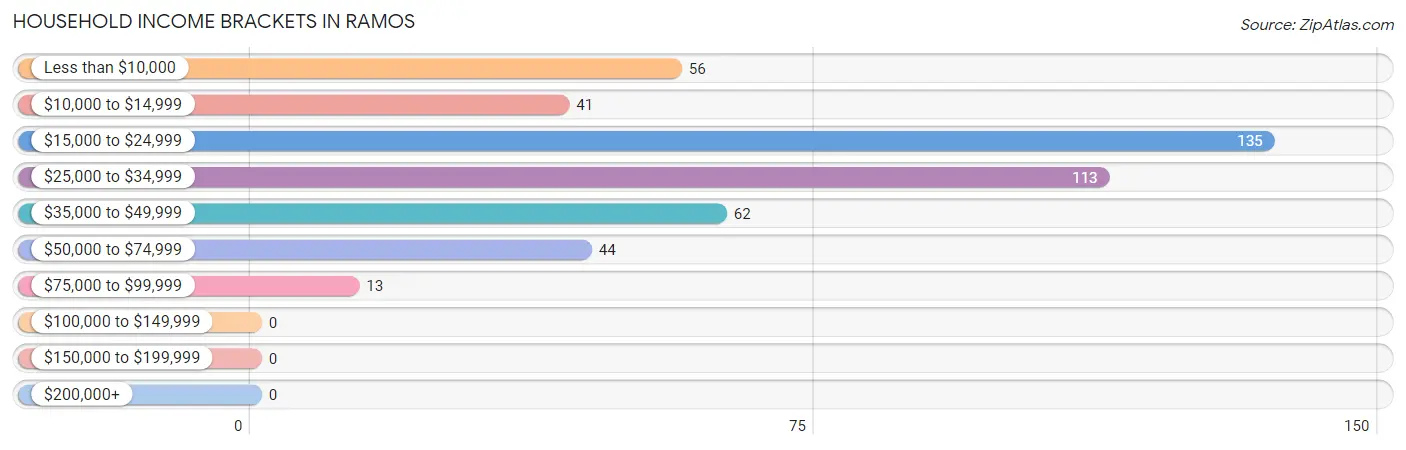
| Income Bracket | # Households | % Households |
| Less than $10,000 | 56 | 12.1% |
| $10,000 to $14,999 | 41 | 8.8% |
| $15,000 to $24,999 | 135 | 29.1% |
| $25,000 to $34,999 | 113 | 24.4% |
| $35,000 to $49,999 | 62 | 13.4% |
| $50,000 to $74,999 | 44 | 9.5% |
| $75,000 to $99,999 | 13 | 2.8% |
| $100,000 to $149,999 | 0 | 0.0% |
| $150,000 to $199,999 | 0 | 0.0% |
| $200,000+ | 0 | 0.0% |
Household Income by Householder Age in Ramos
The median household income in Ramos is $25,000, with the highest median household income of $36,190 found in the 25 to 44 years age bracket for the primary householder. A total of 58 households (12.5%) fall into this category.
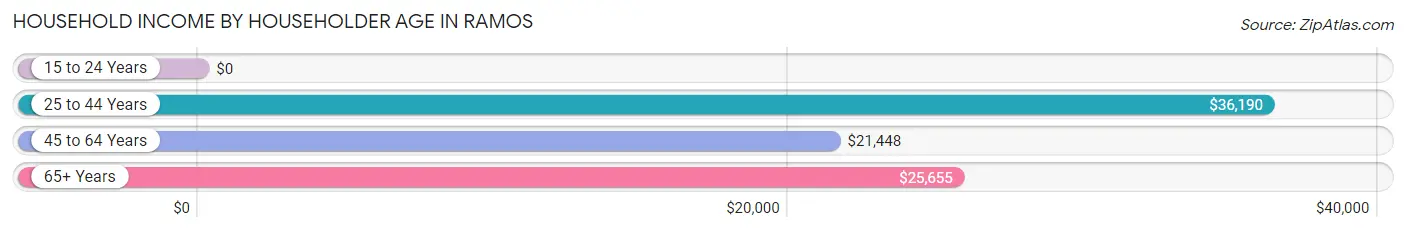
| Income Bracket | # Households | Median Income |
| 15 to 24 Years | 0 (0.0%) | $0 |
| 25 to 44 Years | 58 (12.5%) | $36,190 |
| 45 to 64 Years | 161 (34.7%) | $21,448 |
| 65+ Years | 245 (52.8%) | $25,655 |
| Total | 464 (100.0%) | $25,000 |
Poverty in Ramos
Income Below Poverty by Sex and Age in Ramos
With 41.5% poverty level for males and 33.0% for females among the residents of Ramos, 6 to 11 year old males and under 5 year old females are the most vulnerable to poverty, with 20 males (100.0%) and 28 females (100.0%) in their respective age groups living below the poverty level.
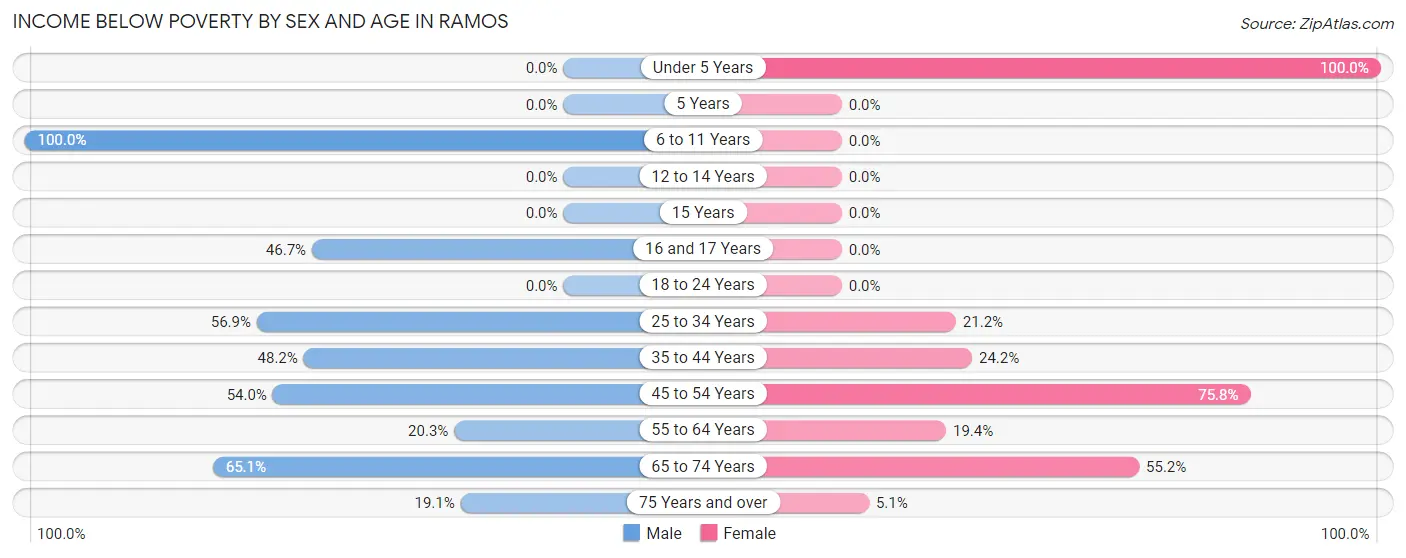
| Age Bracket | Male | Female |
| Under 5 Years | 0 (0.0%) | 28 (100.0%) |
| 5 Years | 0 (0.0%) | 0 (0.0%) |
| 6 to 11 Years | 20 (100.0%) | 0 (0.0%) |
| 12 to 14 Years | 0 (0.0%) | 0 (0.0%) |
| 15 Years | 0 (0.0%) | 0 (0.0%) |
| 16 and 17 Years | 21 (46.7%) | 0 (0.0%) |
| 18 to 24 Years | 0 (0.0%) | 0 (0.0%) |
| 25 to 34 Years | 66 (56.9%) | 18 (21.2%) |
| 35 to 44 Years | 27 (48.2%) | 29 (24.2%) |
| 45 to 54 Years | 41 (53.9%) | 47 (75.8%) |
| 55 to 64 Years | 15 (20.3%) | 12 (19.4%) |
| 65 to 74 Years | 54 (65.1%) | 85 (55.2%) |
| 75 Years and over | 21 (19.1%) | 5 (5.1%) |
| Total | 265 (41.5%) | 224 (33.0%) |
Income Above Poverty by Sex and Age in Ramos
According to the poverty statistics in Ramos, males aged under 5 years and females aged 12 to 14 years are the age groups that are most secure financially, with 100.0% of males and 100.0% of females in these age groups living above the poverty line.
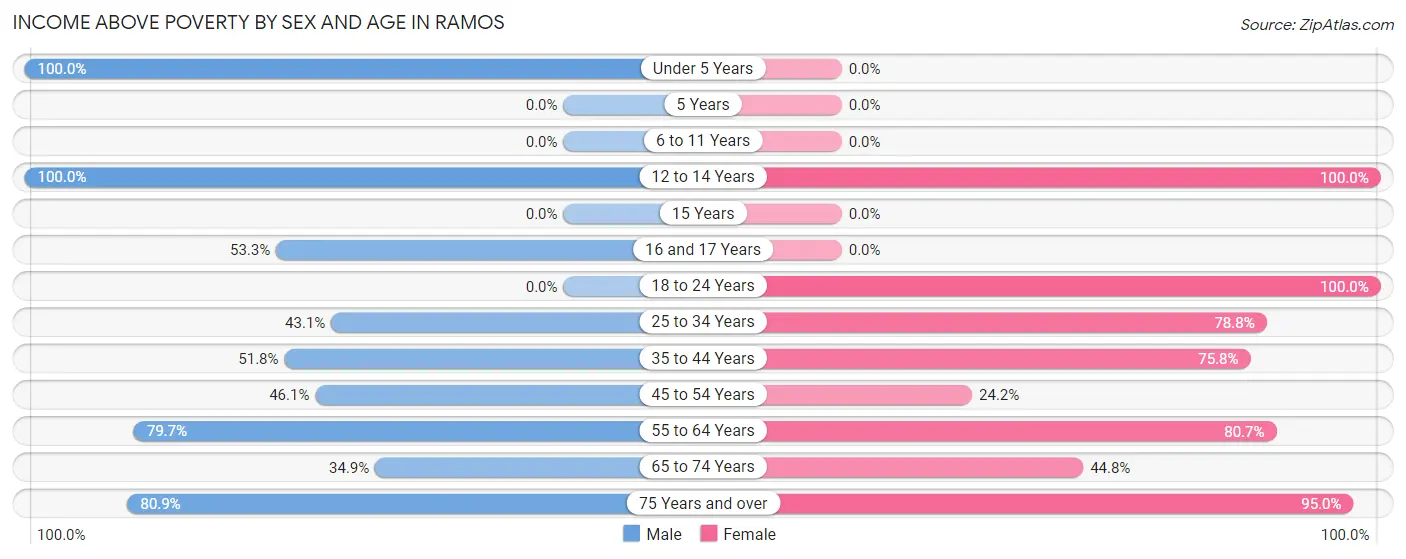
| Age Bracket | Male | Female |
| Under 5 Years | 39 (100.0%) | 0 (0.0%) |
| 5 Years | 0 (0.0%) | 0 (0.0%) |
| 6 to 11 Years | 0 (0.0%) | 0 (0.0%) |
| 12 to 14 Years | 20 (100.0%) | 24 (100.0%) |
| 15 Years | 0 (0.0%) | 0 (0.0%) |
| 16 and 17 Years | 24 (53.3%) | 0 (0.0%) |
| 18 to 24 Years | 0 (0.0%) | 44 (100.0%) |
| 25 to 34 Years | 50 (43.1%) | 67 (78.8%) |
| 35 to 44 Years | 29 (51.8%) | 91 (75.8%) |
| 45 to 54 Years | 35 (46.1%) | 15 (24.2%) |
| 55 to 64 Years | 59 (79.7%) | 50 (80.6%) |
| 65 to 74 Years | 29 (34.9%) | 69 (44.8%) |
| 75 Years and over | 89 (80.9%) | 94 (95.0%) |
| Total | 374 (58.5%) | 454 (67.0%) |
Income Below Poverty Among Married-Couple Families in Ramos
The poverty statistics for married-couple families in Ramos show that 38.0% or 70 of the total 184 families live below the poverty line. Families with 1 or 2 children have the highest poverty rate of 55.0%, comprising of 22 families. On the other hand, families with no children have the lowest poverty rate of 33.3%, which includes 48 families.
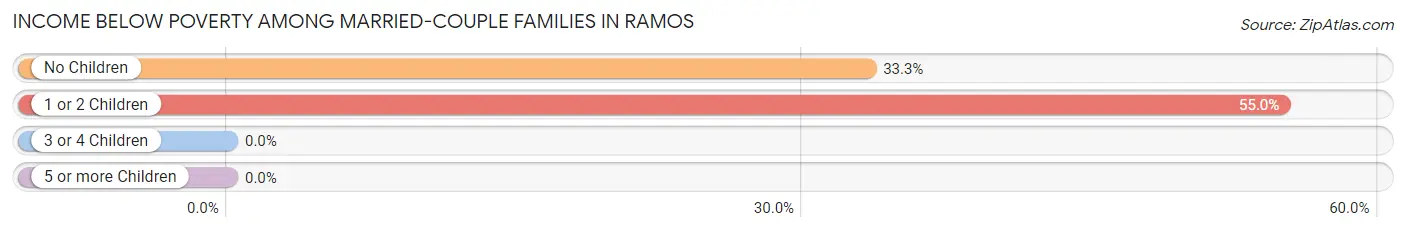
| Children | Above Poverty | Below Poverty |
| No Children | 96 (66.7%) | 48 (33.3%) |
| 1 or 2 Children | 18 (45.0%) | 22 (55.0%) |
| 3 or 4 Children | 0 (0.0%) | 0 (0.0%) |
| 5 or more Children | 0 (0.0%) | 0 (0.0%) |
| Total | 114 (62.0%) | 70 (38.0%) |
Income Below Poverty Among Single-Parent Households in Ramos
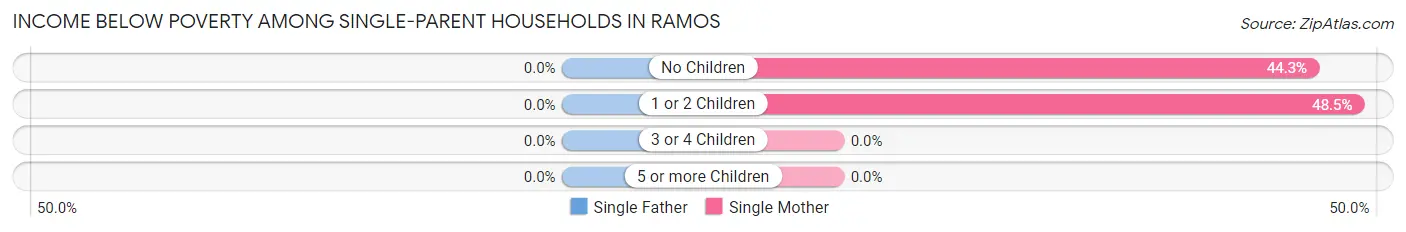
| Children | Single Father | Single Mother |
| No Children | 0 (0.0%) | 27 (44.3%) |
| 1 or 2 Children | 0 (0.0%) | 16 (48.5%) |
| 3 or 4 Children | 0 (0.0%) | 0 (0.0%) |
| 5 or more Children | 0 (0.0%) | 0 (0.0%) |
| Total | 0 (0.0%) | 43 (45.7%) |
Income Below Poverty Among Married-Couple vs Single-Parent Households in Ramos
The poverty data for Ramos shows that 70 of the married-couple family households (38.0%) and 43 of the single-parent households (32.8%) are living below the poverty level. Within the married-couple family households, those with 1 or 2 children have the highest poverty rate, with 22 households (55.0%) falling below the poverty line. Among the single-parent households, those with no children have the highest poverty rate, with 27 household (33.3%) living below poverty.
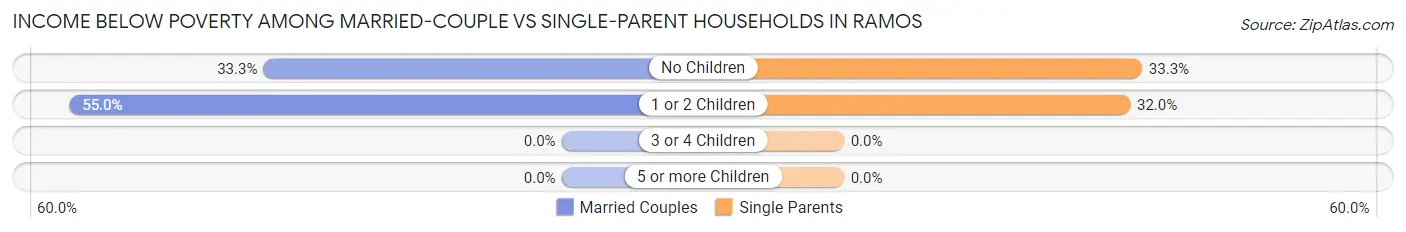
| Children | Married-Couple Families | Single-Parent Households |
| No Children | 48 (33.3%) | 27 (33.3%) |
| 1 or 2 Children | 22 (55.0%) | 16 (32.0%) |
| 3 or 4 Children | 0 (0.0%) | 0 (0.0%) |
| 5 or more Children | 0 (0.0%) | 0 (0.0%) |
| Total | 70 (38.0%) | 43 (32.8%) |
Race in Ramos
The most populous races in Ramos are Hispanic or Latino (1,310 | 99.3%), Some other Race (505 | 38.3%), and White / Caucasian (304 | 23.1%).
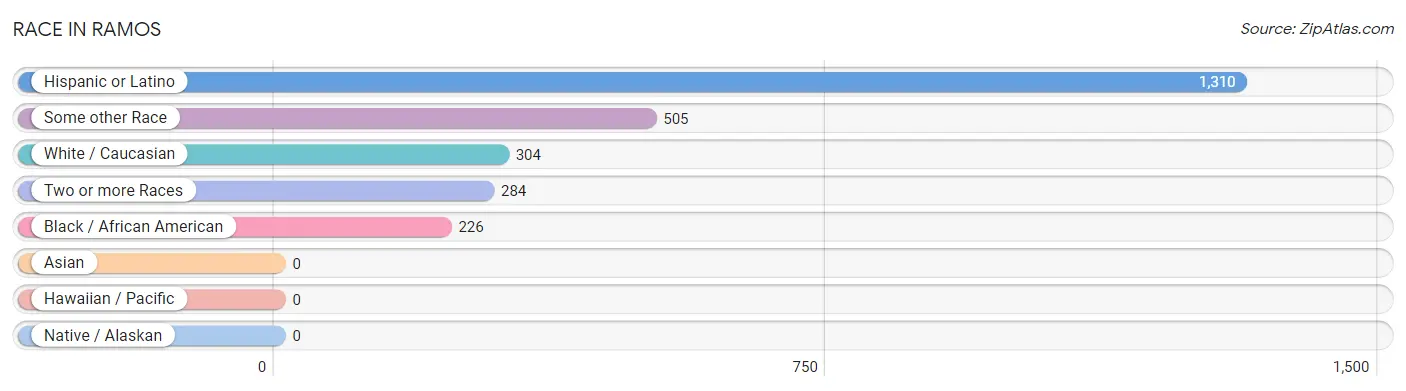
| Race | # Population | % Population |
| Asian | 0 | 0.0% |
| Black / African American | 226 | 17.1% |
| Hawaiian / Pacific | 0 | 0.0% |
| Hispanic or Latino | 1,310 | 99.3% |
| Native / Alaskan | 0 | 0.0% |
| White / Caucasian | 304 | 23.1% |
| Two or more Races | 284 | 21.5% |
| Some other Race | 505 | 38.3% |
| Total | 1,319 | 100.0% |
Ancestry in Ramos
The most populous ancestries reported in Ramos are , and Puerto Rican (1,310 | 99.3%), together accounting for 99.3% of all Ramos residents.

| Ancestry | # Population | % Population |
| Puerto Rican | 1,310 | 99.3% | View All 1 Rows |
Immigrants in Ramos

| Immigration Origin | # Population | % Population | View All 0 Rows |
Sex and Age in Ramos
Sex and Age in Ramos
The most populous age groups in Ramos are 75 to 79 Years (80 | 12.5%) for men and 75 to 79 Years (99 | 14.6%) for women.
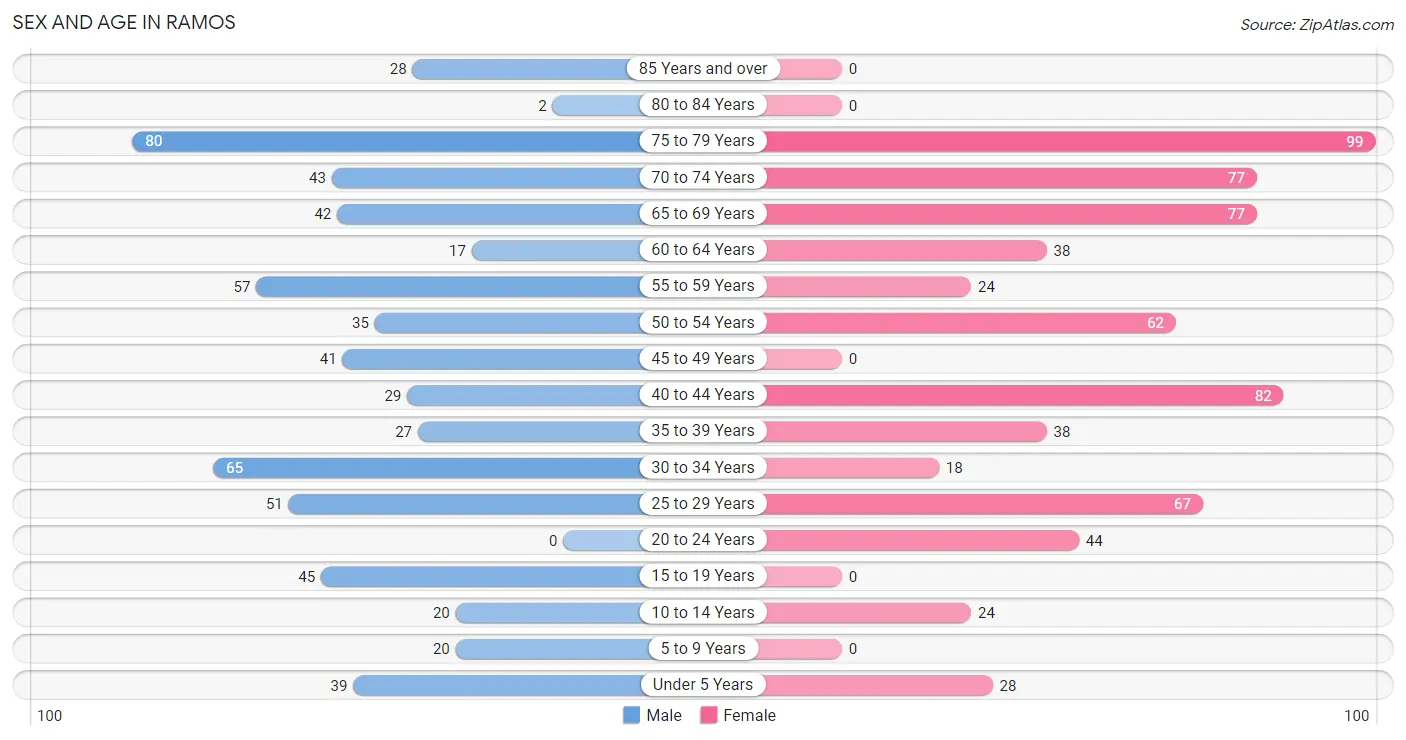
| Age Bracket | Male | Female |
| Under 5 Years | 39 (6.1%) | 28 (4.1%) |
| 5 to 9 Years | 20 (3.1%) | 0 (0.0%) |
| 10 to 14 Years | 20 (3.1%) | 24 (3.5%) |
| 15 to 19 Years | 45 (7.0%) | 0 (0.0%) |
| 20 to 24 Years | 0 (0.0%) | 44 (6.5%) |
| 25 to 29 Years | 51 (8.0%) | 67 (9.9%) |
| 30 to 34 Years | 65 (10.1%) | 18 (2.6%) |
| 35 to 39 Years | 27 (4.2%) | 38 (5.6%) |
| 40 to 44 Years | 29 (4.5%) | 82 (12.1%) |
| 45 to 49 Years | 41 (6.4%) | 0 (0.0%) |
| 50 to 54 Years | 35 (5.5%) | 62 (9.1%) |
| 55 to 59 Years | 57 (8.9%) | 24 (3.5%) |
| 60 to 64 Years | 17 (2.6%) | 38 (5.6%) |
| 65 to 69 Years | 42 (6.6%) | 77 (11.4%) |
| 70 to 74 Years | 43 (6.7%) | 77 (11.4%) |
| 75 to 79 Years | 80 (12.5%) | 99 (14.6%) |
| 80 to 84 Years | 2 (0.3%) | 0 (0.0%) |
| 85 Years and over | 28 (4.4%) | 0 (0.0%) |
| Total | 641 (100.0%) | 678 (100.0%) |
Families and Households in Ramos
Median Family Size in Ramos
The median family size in Ramos is 3.45 persons per family, with single female/mother families (94 | 29.8%) accounting for the largest median family size of 3.57 persons per family. On the other hand, single male/father families (37 | 11.7%) represent the smallest median family size with 2.89 persons per family.
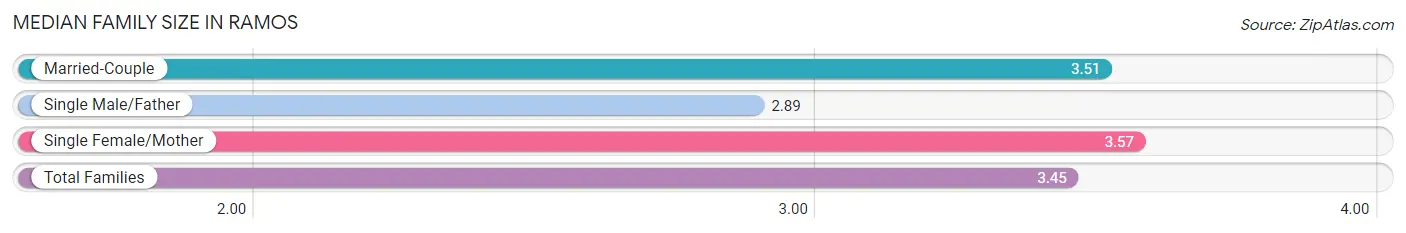
| Family Type | # Families | Family Size |
| Married-Couple | 184 (58.4%) | 3.51 |
| Single Male/Father | 37 (11.7%) | 2.89 |
| Single Female/Mother | 94 (29.8%) | 3.57 |
| Total Families | 315 (100.0%) | 3.45 |
Median Household Size in Ramos
The median household size in Ramos is 2.81 persons per household, with single female/mother households (94 | 20.3%) accounting for the largest median household size of 3.57 persons per household. non-family households (149 | 32.1%) represent the smallest median household size with 1.34 persons per household.
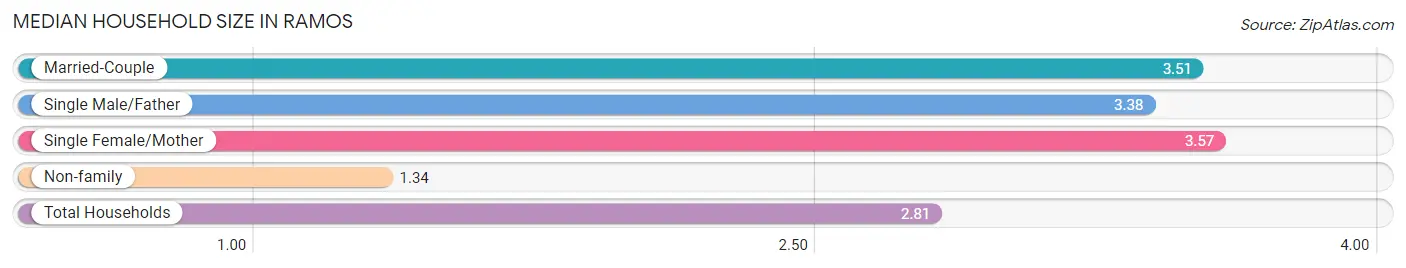
| Household Type | # Households | Household Size |
| Married-Couple | 184 (39.7%) | 3.51 |
| Single Male/Father | 37 (8.0%) | 3.38 |
| Single Female/Mother | 94 (20.3%) | 3.57 |
| Non-family | 149 (32.1%) | 1.34 |
| Total Households | 464 (100.0%) | 2.81 |
Household Size by Marriage Status in Ramos
Out of a total of 464 households in Ramos, 315 (67.9%) are family households, while 149 (32.1%) are nonfamily households. The most numerous type of family households are 2-person households, comprising 204, and the most common type of nonfamily households are 1-person households, comprising 93.
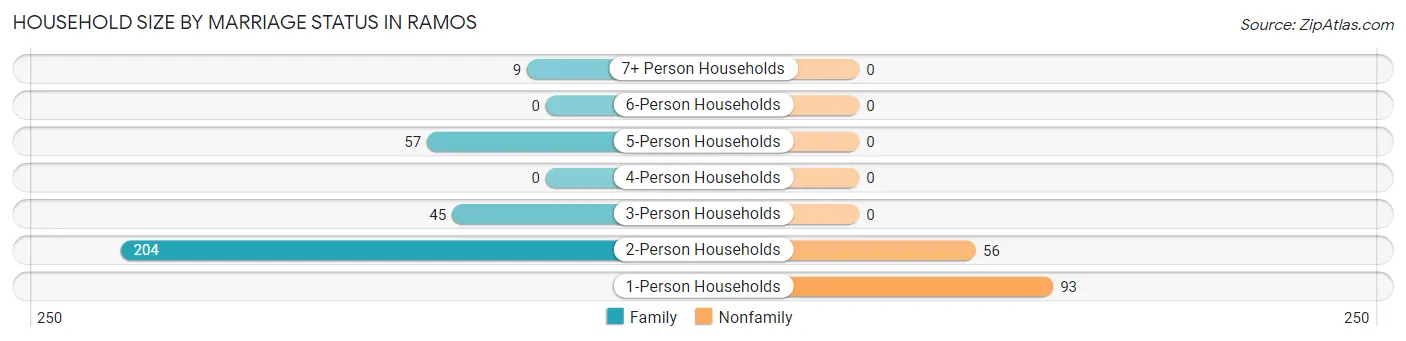
| Household Size | Family Households | Nonfamily Households |
| 1-Person Households | - | 93 (20.0%) |
| 2-Person Households | 204 (44.0%) | 56 (12.1%) |
| 3-Person Households | 45 (9.7%) | 0 (0.0%) |
| 4-Person Households | 0 (0.0%) | 0 (0.0%) |
| 5-Person Households | 57 (12.3%) | 0 (0.0%) |
| 6-Person Households | 0 (0.0%) | 0 (0.0%) |
| 7+ Person Households | 9 (1.9%) | 0 (0.0%) |
| Total | 315 (67.9%) | 149 (32.1%) |
Female Fertility in Ramos
Fertility by Age in Ramos
| Age Bracket | Women with Births | Births / 1,000 Women |
| 15 to 19 years | 0 (0.0%) | 0.0 |
| 20 to 34 years | 0 (0.0%) | 0.0 |
| 35 to 50 years | 0 (0.0%) | 0.0 |
| Total | 0 (0.0%) | 0.0 |
Fertility by Age by Marriage Status in Ramos
| Age Bracket | Married | Unmarried |
| 15 to 19 years | 0 (0.0%) | 0 (0.0%) |
| 20 to 34 years | 0 (0.0%) | 0 (0.0%) |
| 35 to 50 years | 0 (0.0%) | 0 (0.0%) |
| Total | 0 (0.0%) | 0 (0.0%) |
Fertility by Education in Ramos
| Educational Attainment | Women with Births | Births / 1,000 Women |
| Less than High School | 0 (0.0%) | 0.0 |
| High School Diploma | 0 (0.0%) | 0.0 |
| College or Associate's Degree | 0 (0.0%) | 0.0 |
| Bachelor's Degree | 0 (0.0%) | 0.0 |
| Graduate Degree | 0 (0.0%) | 0.0 |
| Total | 0 (0.0%) | 0.0 |
Fertility by Education by Marriage Status in Ramos
| Educational Attainment | Married | Unmarried |
| Less than High School | 0 (0.0%) | 0 (0.0%) |
| High School Diploma | 0 (0.0%) | 0 (0.0%) |
| College or Associate's Degree | 0 (0.0%) | 0 (0.0%) |
| Bachelor's Degree | 0 (0.0%) | 0 (0.0%) |
| Graduate Degree | 0 (0.0%) | 0 (0.0%) |
| Total | 0 (0.0%) | 0 (0.0%) |
Employment Characteristics in Ramos
Employment by Class of Employer in Ramos
Among the 288 employed individuals in Ramos, private company employees (197 | 68.4%), state government employees (56 | 19.4%), and self-employed (not incorporated) (35 | 12.1%) make up the most common classes of employment.
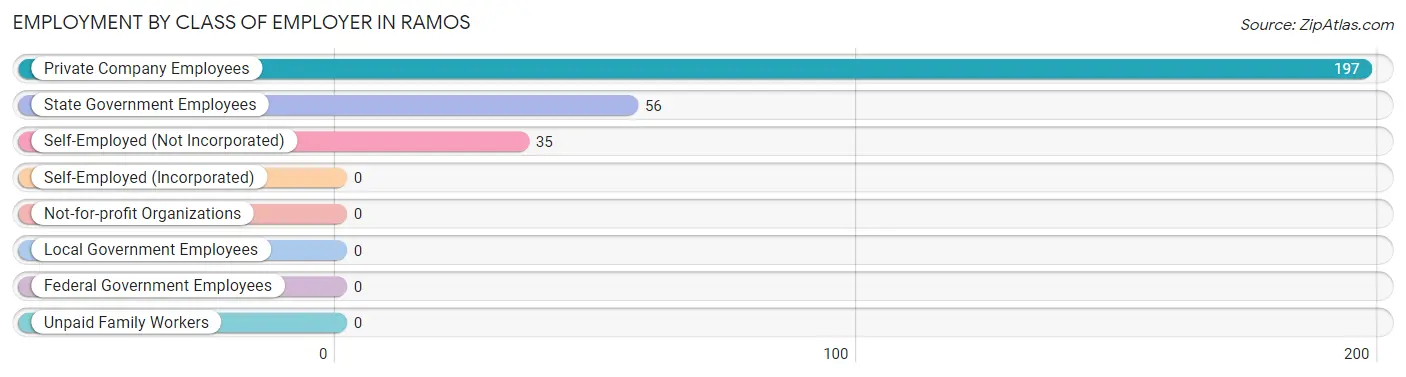
| Employer Class | # Employees | % Employees |
| Private Company Employees | 197 | 68.4% |
| Self-Employed (Incorporated) | 0 | 0.0% |
| Self-Employed (Not Incorporated) | 35 | 12.1% |
| Not-for-profit Organizations | 0 | 0.0% |
| Local Government Employees | 0 | 0.0% |
| State Government Employees | 56 | 19.4% |
| Federal Government Employees | 0 | 0.0% |
| Unpaid Family Workers | 0 | 0.0% |
| Total | 288 | 100.0% |
Employment Status by Age in Ramos
According to the labor force statistics for Ramos, out of the total population over 16 years of age (1,188), 40.9% or 486 individuals are in the labor force, with 36.4% or 177 of them unemployed. The age group with the highest labor force participation rate is 20 to 24 years, with 100.0% or 44 individuals in the labor force. Within the labor force, the 30 to 34 years age range has the highest percentage of unemployed individuals, with 100.0% or 32 of them being unemployed.
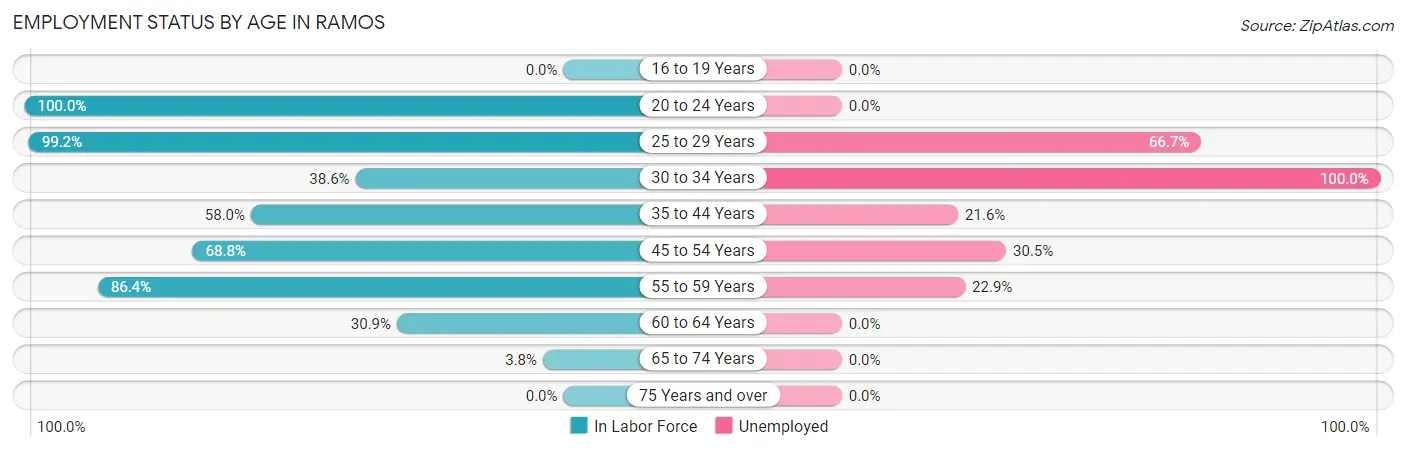
| Age Bracket | In Labor Force | Unemployed |
| 16 to 19 Years | 0 (0.0%) | 0 (0.0%) |
| 20 to 24 Years | 44 (100.0%) | 0 (0.0%) |
| 25 to 29 Years | 117 (99.2%) | 78 (66.7%) |
| 30 to 34 Years | 32 (38.6%) | 32 (100.0%) |
| 35 to 44 Years | 102 (58.0%) | 22 (21.6%) |
| 45 to 54 Years | 95 (68.8%) | 29 (30.5%) |
| 55 to 59 Years | 70 (86.4%) | 16 (22.9%) |
| 60 to 64 Years | 17 (30.9%) | 0 (0.0%) |
| 65 to 74 Years | 9 (3.8%) | 0 (0.0%) |
| 75 Years and over | 0 (0.0%) | 0 (0.0%) |
| Total | 486 (40.9%) | 177 (36.4%) |
Employment Status by Educational Attainment in Ramos
According to labor force statistics for Ramos, 66.5% of individuals (433) out of the total population between 25 and 64 years of age (651) are in the labor force, with 40.9% or 177 of them being unemployed. The group with the highest labor force participation rate are those with the educational attainment of bachelor's degree or higher, with 91.9% or 125 individuals in the labor force. Within the labor force, individuals with college / associate degree education have the highest percentage of unemployment, with 59.0% or 115 of them being unemployed.
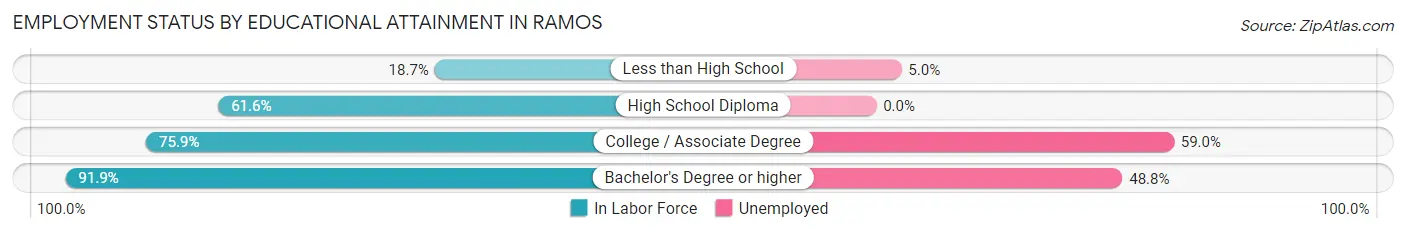
| Educational Attainment | In Labor Force | Unemployed |
| Less than High School | 20 (18.7%) | 5 (5.0%) |
| High School Diploma | 93 (61.6%) | 0 (0.0%) |
| College / Associate Degree | 195 (75.9%) | 152 (59.0%) |
| Bachelor's Degree or higher | 125 (91.9%) | 66 (48.8%) |
| Total | 433 (66.5%) | 266 (40.9%) |
Employment Occupations by Sex in Ramos
Management, Business, Science and Arts Occupations
The most common Management, Business, Science and Arts occupations in Ramos are Community & Social Service (51 | 16.5%), Education Instruction & Library (51 | 16.5%), Health Diagnosing & Treating (44 | 14.2%), Health Technologists (44 | 14.2%), and Management (13 | 4.2%).
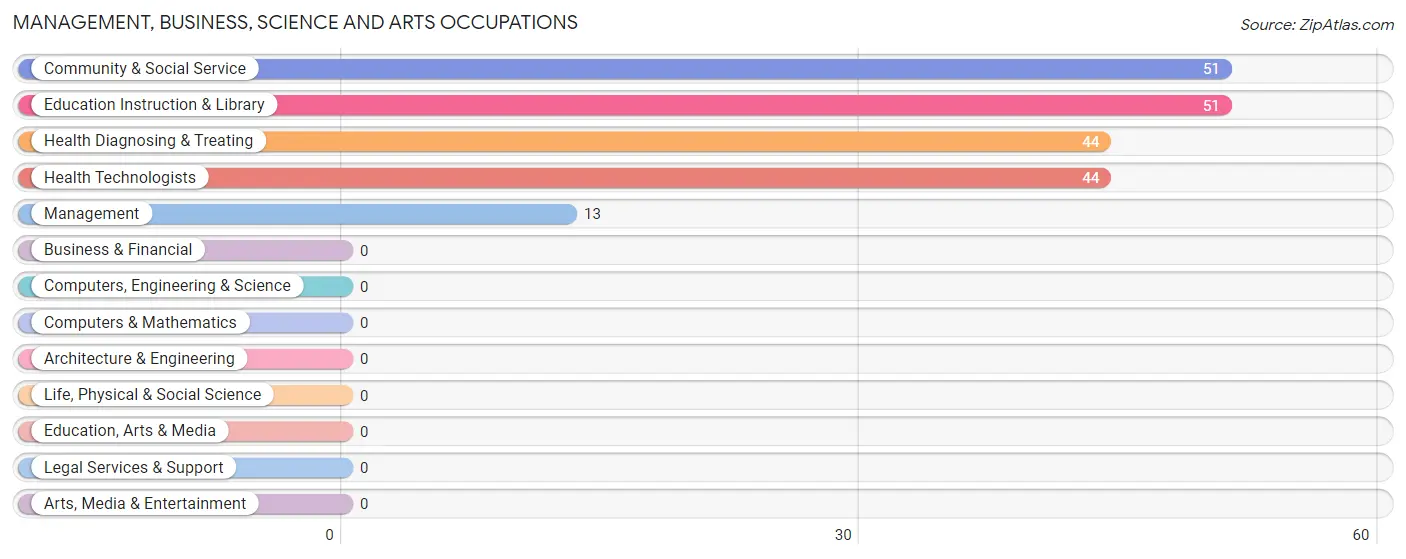
Management, Business, Science and Arts Occupations by Sex
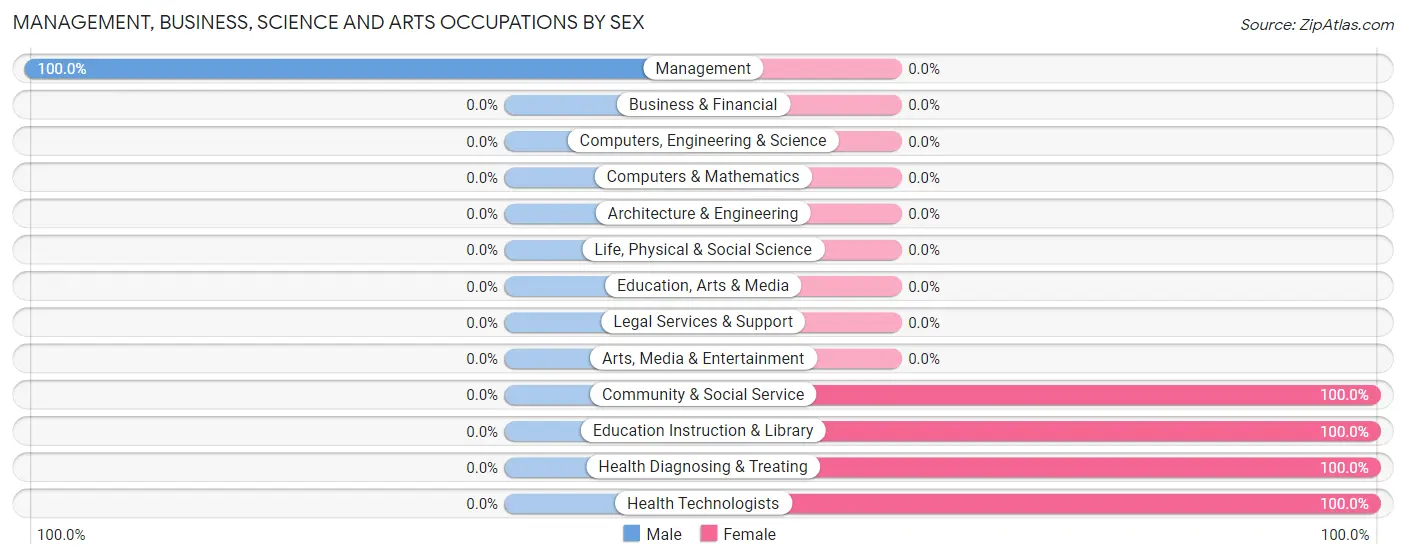
| Occupation | Male | Female |
| Management | 13 (100.0%) | 0 (0.0%) |
| Business & Financial | 0 (0.0%) | 0 (0.0%) |
| Computers, Engineering & Science | 0 (0.0%) | 0 (0.0%) |
| Computers & Mathematics | 0 (0.0%) | 0 (0.0%) |
| Architecture & Engineering | 0 (0.0%) | 0 (0.0%) |
| Life, Physical & Social Science | 0 (0.0%) | 0 (0.0%) |
| Community & Social Service | 0 (0.0%) | 51 (100.0%) |
| Education, Arts & Media | 0 (0.0%) | 0 (0.0%) |
| Legal Services & Support | 0 (0.0%) | 0 (0.0%) |
| Education Instruction & Library | 0 (0.0%) | 51 (100.0%) |
| Arts, Media & Entertainment | 0 (0.0%) | 0 (0.0%) |
| Health Diagnosing & Treating | 0 (0.0%) | 44 (100.0%) |
| Health Technologists | 0 (0.0%) | 44 (100.0%) |
| Total (Category) | 13 (12.0%) | 95 (88.0%) |
| Total (Overall) | 164 (53.1%) | 145 (46.9%) |
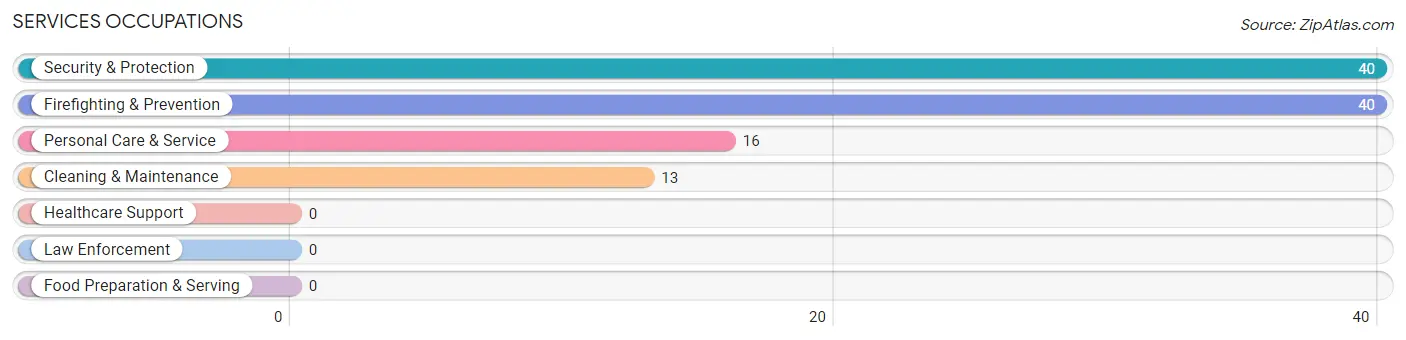
Services Occupations
The most common Services occupations in Ramos are Security & Protection (40 | 12.9%), Firefighting & Prevention (40 | 12.9%), Personal Care & Service (16 | 5.2%), and Cleaning & Maintenance (13 | 4.2%).
Services Occupations by Sex
Within the Services occupations in Ramos, the most male-oriented occupations are Security & Protection (100.0%), and Firefighting & Prevention (100.0%), while the most female-oriented occupations are Cleaning & Maintenance (100.0%), and Personal Care & Service (100.0%).
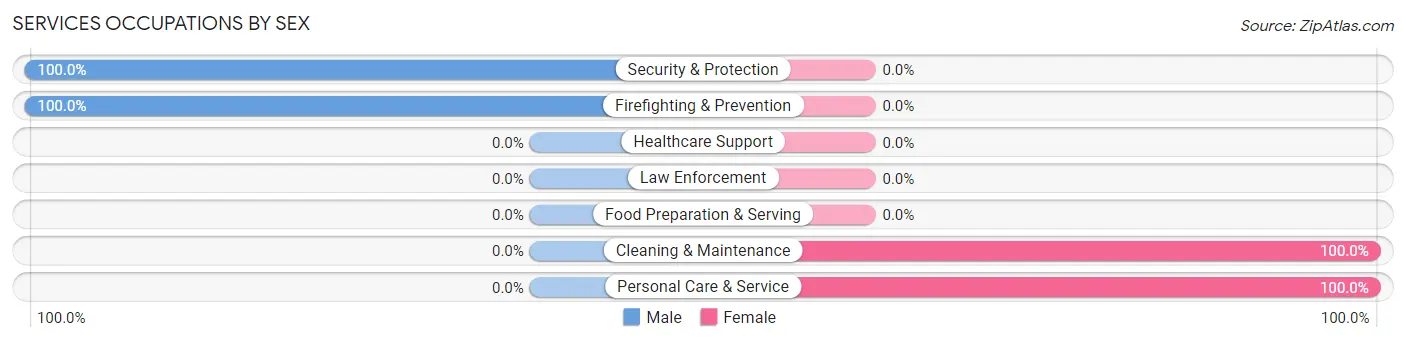
| Occupation | Male | Female |
| Healthcare Support | 0 (0.0%) | 0 (0.0%) |
| Security & Protection | 40 (100.0%) | 0 (0.0%) |
| Firefighting & Prevention | 40 (100.0%) | 0 (0.0%) |
| Law Enforcement | 0 (0.0%) | 0 (0.0%) |
| Food Preparation & Serving | 0 (0.0%) | 0 (0.0%) |
| Cleaning & Maintenance | 0 (0.0%) | 13 (100.0%) |
| Personal Care & Service | 0 (0.0%) | 16 (100.0%) |
| Total (Category) | 40 (58.0%) | 29 (42.0%) |
| Total (Overall) | 164 (53.1%) | 145 (46.9%) |
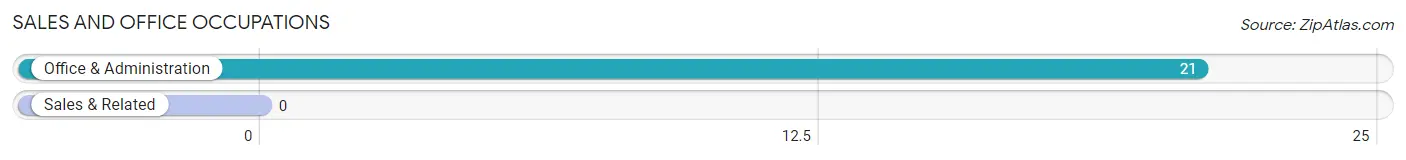
Sales and Office Occupations
The most common Sales and Office occupations in Ramos are , and Office & Administration (21 | 6.8%).
Sales and Office Occupations by Sex
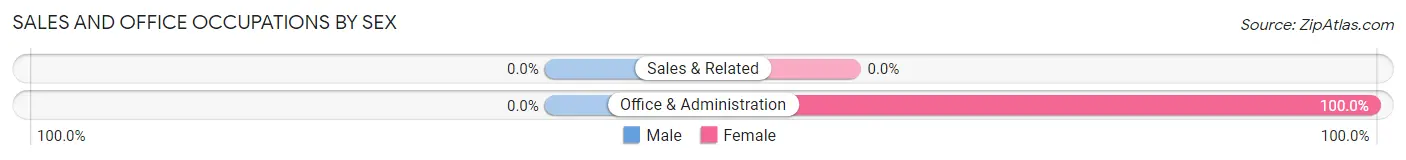
| Occupation | Male | Female |
| Sales & Related | 0 (0.0%) | 0 (0.0%) |
| Office & Administration | 0 (0.0%) | 21 (100.0%) |
| Total (Category) | 0 (0.0%) | 21 (100.0%) |
| Total (Overall) | 164 (53.1%) | 145 (46.9%) |
Natural Resources, Construction and Maintenance Occupations
The most common Natural Resources, Construction and Maintenance occupations in Ramos are , and Construction & Extraction (51 | 16.5%).
Natural Resources, Construction and Maintenance Occupations by Sex
| Occupation | Male | Female |
| Farming, Fishing & Forestry | 0 (0.0%) | 0 (0.0%) |
| Construction & Extraction | 51 (100.0%) | 0 (0.0%) |
| Installation, Maintenance & Repair | 0 (0.0%) | 0 (0.0%) |
| Total (Category) | 51 (100.0%) | 0 (0.0%) |
| Total (Overall) | 164 (53.1%) | 145 (46.9%) |
Production, Transportation and Moving Occupations
The most common Production, Transportation and Moving occupations in Ramos are Production (51 | 16.5%), and Transportation (9 | 2.9%).
Production, Transportation and Moving Occupations by Sex
| Occupation | Male | Female |
| Production | 51 (100.0%) | 0 (0.0%) |
| Transportation | 9 (100.0%) | 0 (0.0%) |
| Material Moving | 0 (0.0%) | 0 (0.0%) |
| Total (Category) | 60 (100.0%) | 0 (0.0%) |
| Total (Overall) | 164 (53.1%) | 145 (46.9%) |
Employment Industries by Sex in Ramos
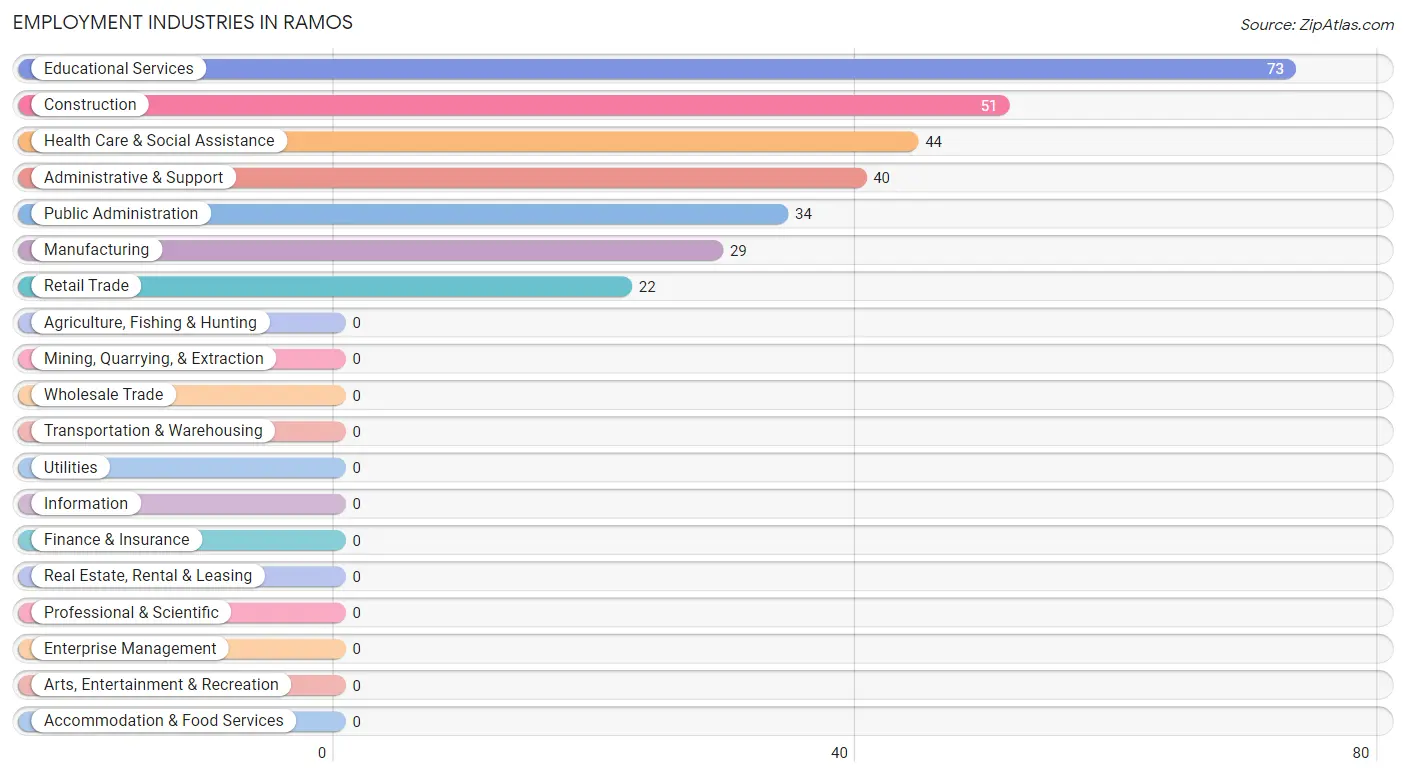
Employment Industries in Ramos
The major employment industries in Ramos include Educational Services (73 | 23.6%), Construction (51 | 16.5%), Health Care & Social Assistance (44 | 14.2%), Administrative & Support (40 | 12.9%), and Public Administration (34 | 11.0%).
Employment Industries by Sex in Ramos
The Ramos industries that see more men than women are Construction (100.0%), Manufacturing (100.0%), and Retail Trade (100.0%), whereas the industries that tend to have a higher number of women are Health Care & Social Assistance (100.0%), Educational Services (87.7%), and Public Administration (61.8%).
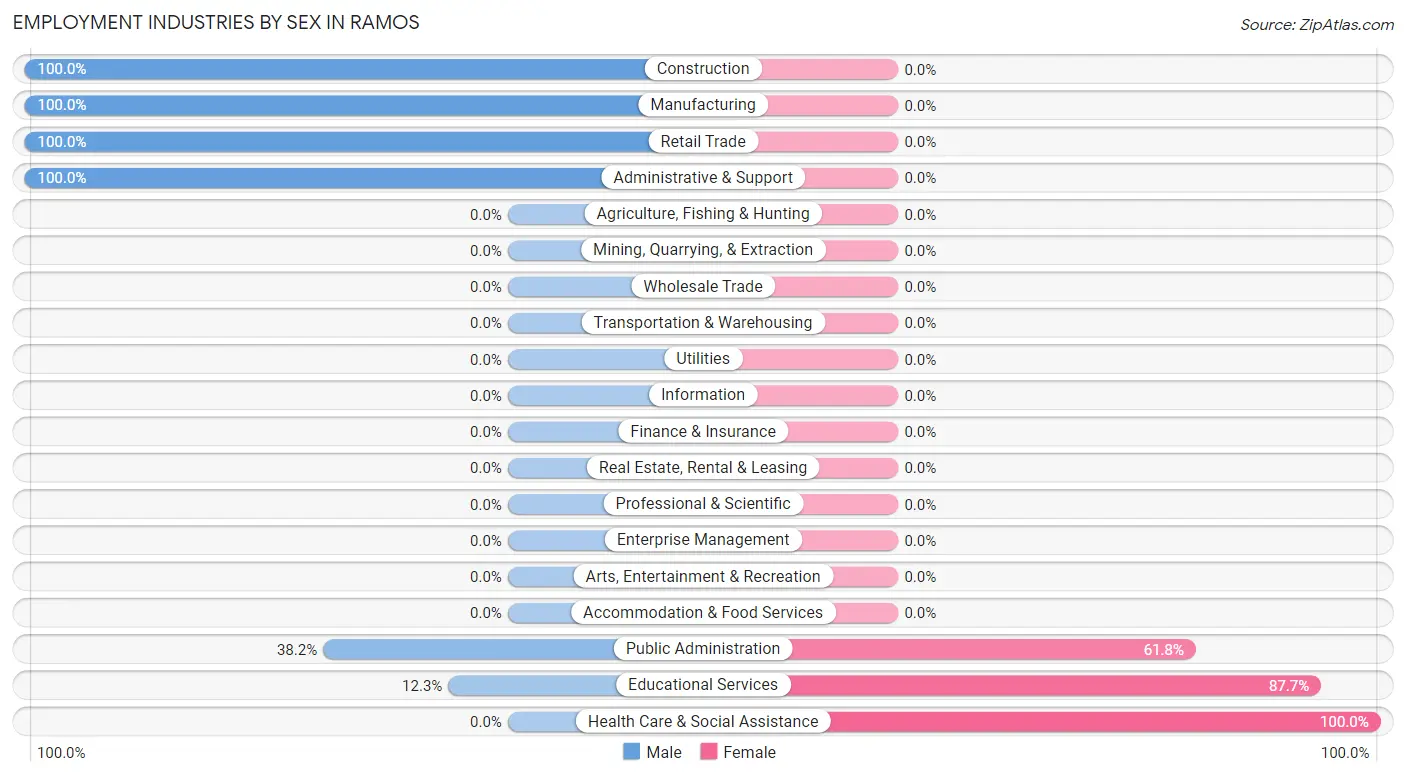
| Industry | Male | Female |
| Agriculture, Fishing & Hunting | 0 (0.0%) | 0 (0.0%) |
| Mining, Quarrying, & Extraction | 0 (0.0%) | 0 (0.0%) |
| Construction | 51 (100.0%) | 0 (0.0%) |
| Manufacturing | 29 (100.0%) | 0 (0.0%) |
| Wholesale Trade | 0 (0.0%) | 0 (0.0%) |
| Retail Trade | 22 (100.0%) | 0 (0.0%) |
| Transportation & Warehousing | 0 (0.0%) | 0 (0.0%) |
| Utilities | 0 (0.0%) | 0 (0.0%) |
| Information | 0 (0.0%) | 0 (0.0%) |
| Finance & Insurance | 0 (0.0%) | 0 (0.0%) |
| Real Estate, Rental & Leasing | 0 (0.0%) | 0 (0.0%) |
| Professional & Scientific | 0 (0.0%) | 0 (0.0%) |
| Enterprise Management | 0 (0.0%) | 0 (0.0%) |
| Administrative & Support | 40 (100.0%) | 0 (0.0%) |
| Educational Services | 9 (12.3%) | 64 (87.7%) |
| Health Care & Social Assistance | 0 (0.0%) | 44 (100.0%) |
| Arts, Entertainment & Recreation | 0 (0.0%) | 0 (0.0%) |
| Accommodation & Food Services | 0 (0.0%) | 0 (0.0%) |
| Public Administration | 13 (38.2%) | 21 (61.8%) |
| Total | 164 (53.1%) | 145 (46.9%) |
Education in Ramos
School Enrollment in Ramos
The most common levels of schooling among the 135 students in Ramos are nursery / preschool (39 | 28.9%), college / undergraduate (32 | 23.7%), and middle school (24 | 17.8%).
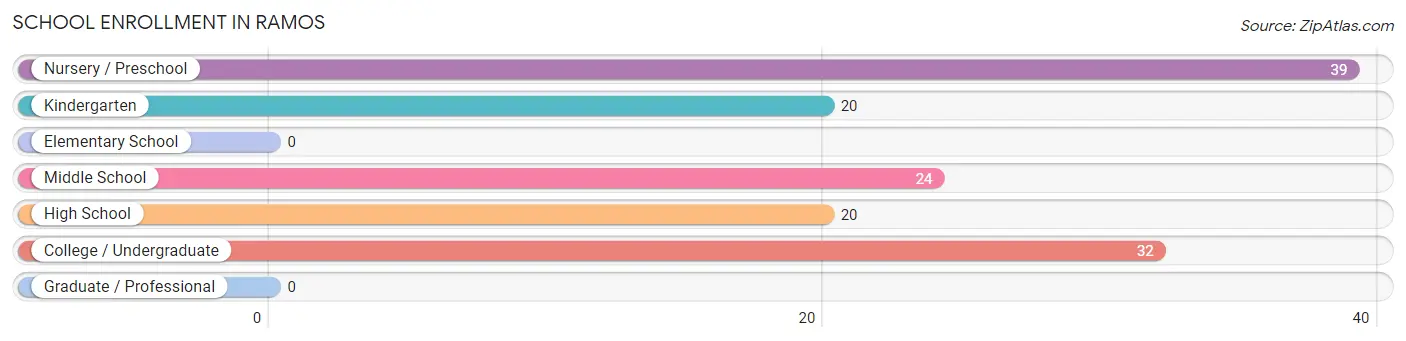
| School Level | # Students | % Students |
| Nursery / Preschool | 39 | 28.9% |
| Kindergarten | 20 | 14.8% |
| Elementary School | 0 | 0.0% |
| Middle School | 24 | 17.8% |
| High School | 20 | 14.8% |
| College / Undergraduate | 32 | 23.7% |
| Graduate / Professional | 0 | 0.0% |
| Total | 135 | 100.0% |
School Enrollment by Age by Funding Source in Ramos
Out of a total of 135 students who are enrolled in schools in Ramos, 20 (14.8%) attend a private institution, while the remaining 115 (85.2%) are enrolled in public schools. The age group of 5 to 9 year old has the highest likelihood of being enrolled in private schools, with 20 (100.0% in the age bracket) enrolled. Conversely, the age group of 3 to 4 year olds has the lowest likelihood of being enrolled in a private school, with 39 (100.0% in the age bracket) attending a public institution.
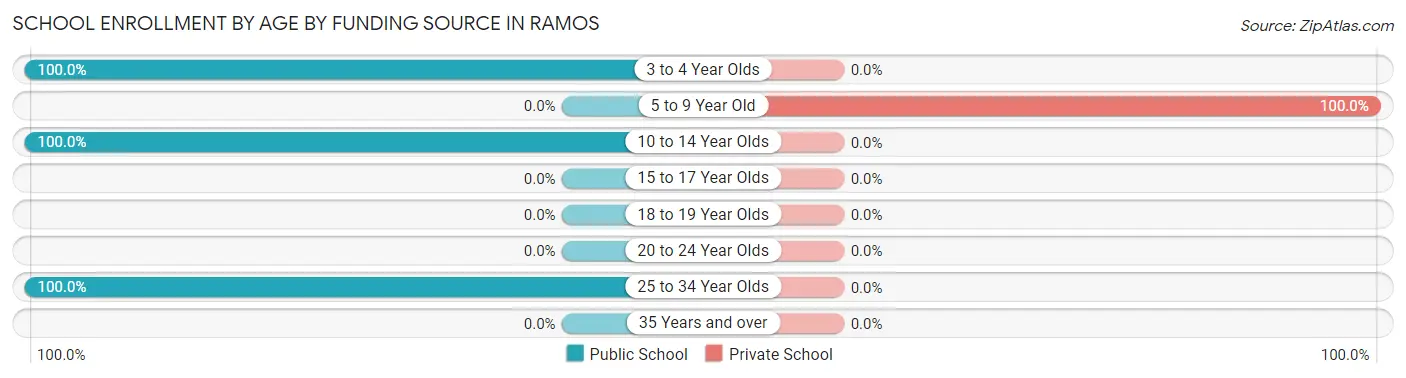
| Age Bracket | Public School | Private School |
| 3 to 4 Year Olds | 39 (100.0%) | 0 (0.0%) |
| 5 to 9 Year Old | 0 (0.0%) | 20 (100.0%) |
| 10 to 14 Year Olds | 44 (100.0%) | 0 (0.0%) |
| 15 to 17 Year Olds | 0 (0.0%) | 0 (0.0%) |
| 18 to 19 Year Olds | 0 (0.0%) | 0 (0.0%) |
| 20 to 24 Year Olds | 0 (0.0%) | 0 (0.0%) |
| 25 to 34 Year Olds | 32 (100.0%) | 0 (0.0%) |
| 35 Years and over | 0 (0.0%) | 0 (0.0%) |
| Total | 115 (85.2%) | 20 (14.8%) |
Educational Attainment by Field of Study in Ramos
Education (85 | 49.4%), computers & mathematics (32 | 18.6%), business (29 | 16.9%), bio, nature & agricultural (15 | 8.7%), and arts & humanities (11 | 6.4%) are the most common fields of study among 172 individuals in Ramos who have obtained a bachelor's degree or higher.
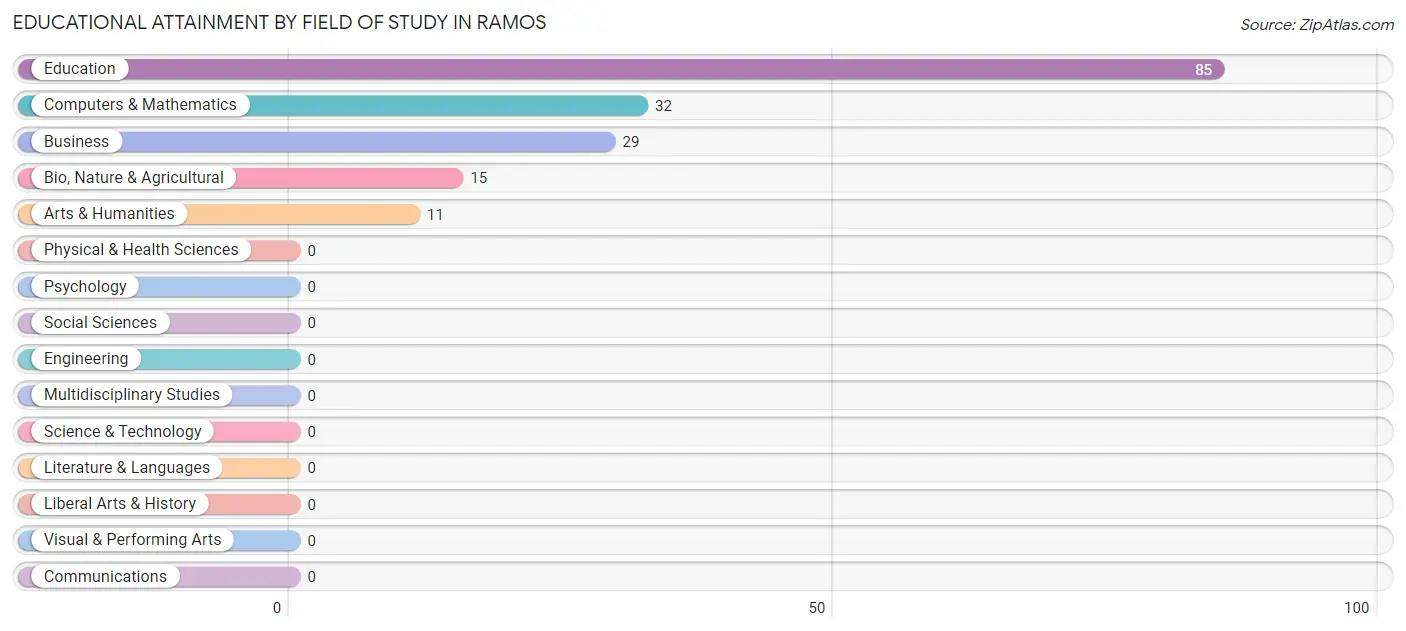
| Field of Study | # Graduates | % Graduates |
| Computers & Mathematics | 32 | 18.6% |
| Bio, Nature & Agricultural | 15 | 8.7% |
| Physical & Health Sciences | 0 | 0.0% |
| Psychology | 0 | 0.0% |
| Social Sciences | 0 | 0.0% |
| Engineering | 0 | 0.0% |
| Multidisciplinary Studies | 0 | 0.0% |
| Science & Technology | 0 | 0.0% |
| Business | 29 | 16.9% |
| Education | 85 | 49.4% |
| Literature & Languages | 0 | 0.0% |
| Liberal Arts & History | 0 | 0.0% |
| Visual & Performing Arts | 0 | 0.0% |
| Communications | 0 | 0.0% |
| Arts & Humanities | 11 | 6.4% |
| Total | 172 | 100.0% |
Transportation & Commute in Ramos
Vehicle Availability by Sex in Ramos
The most prevalent vehicle ownership categories in Ramos are males with 1 vehicle (68, accounting for 41.5%) and females with 1 vehicle (57, making up 54.8%).
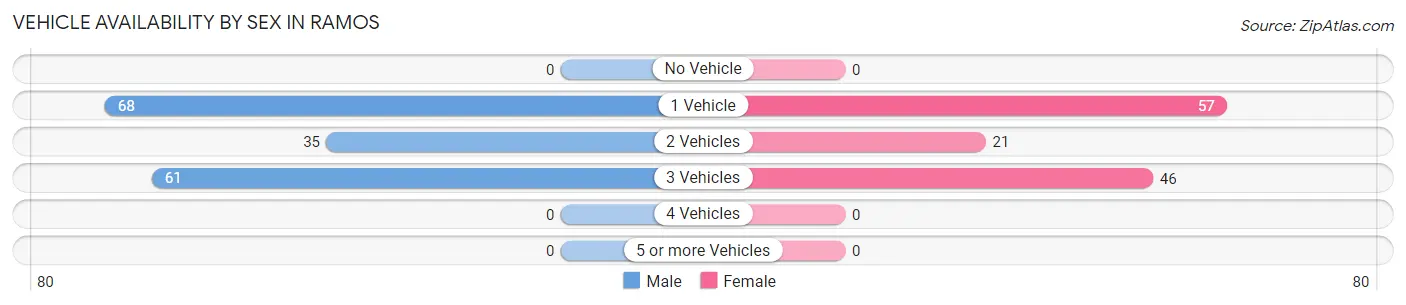
| Vehicles Available | Male | Female |
| No Vehicle | 0 (0.0%) | 0 (0.0%) |
| 1 Vehicle | 68 (41.5%) | 57 (46.0%) |
| 2 Vehicles | 35 (21.3%) | 21 (16.9%) |
| 3 Vehicles | 61 (37.2%) | 46 (37.1%) |
| 4 Vehicles | 0 (0.0%) | 0 (0.0%) |
| 5 or more Vehicles | 0 (0.0%) | 0 (0.0%) |
| Total | 164 (100.0%) | 124 (100.0%) |
Commute Time in Ramos
The most frequently occuring commute durations in Ramos are 15 to 19 minutes (86 commuters, 29.9%), 60 to 89 minutes (59 commuters, 20.5%), and 90 or more minutes (36 commuters, 12.5%).
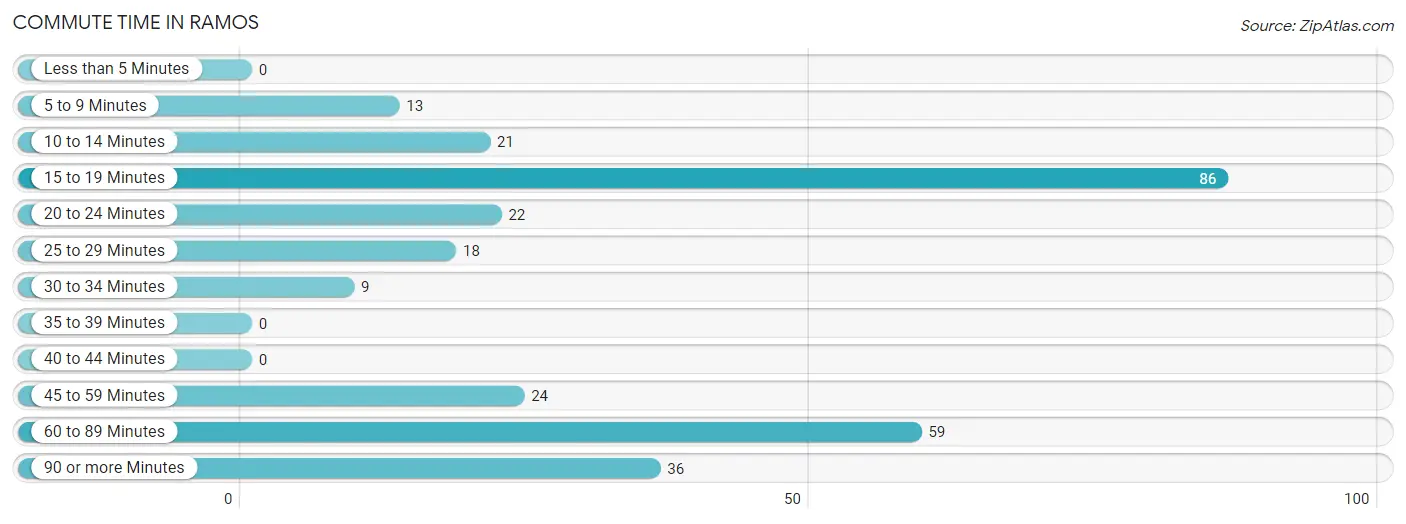
| Commute Time | # Commuters | % Commuters |
| Less than 5 Minutes | 0 | 0.0% |
| 5 to 9 Minutes | 13 | 4.5% |
| 10 to 14 Minutes | 21 | 7.3% |
| 15 to 19 Minutes | 86 | 29.9% |
| 20 to 24 Minutes | 22 | 7.6% |
| 25 to 29 Minutes | 18 | 6.2% |
| 30 to 34 Minutes | 9 | 3.1% |
| 35 to 39 Minutes | 0 | 0.0% |
| 40 to 44 Minutes | 0 | 0.0% |
| 45 to 59 Minutes | 24 | 8.3% |
| 60 to 89 Minutes | 59 | 20.5% |
| 90 or more Minutes | 36 | 12.5% |
Commute Time by Sex in Ramos
The most common commute times in Ramos are 90 or more minutes (36 commuters, 22.0%) for males and 15 to 19 minutes (57 commuters, 46.0%) for females.
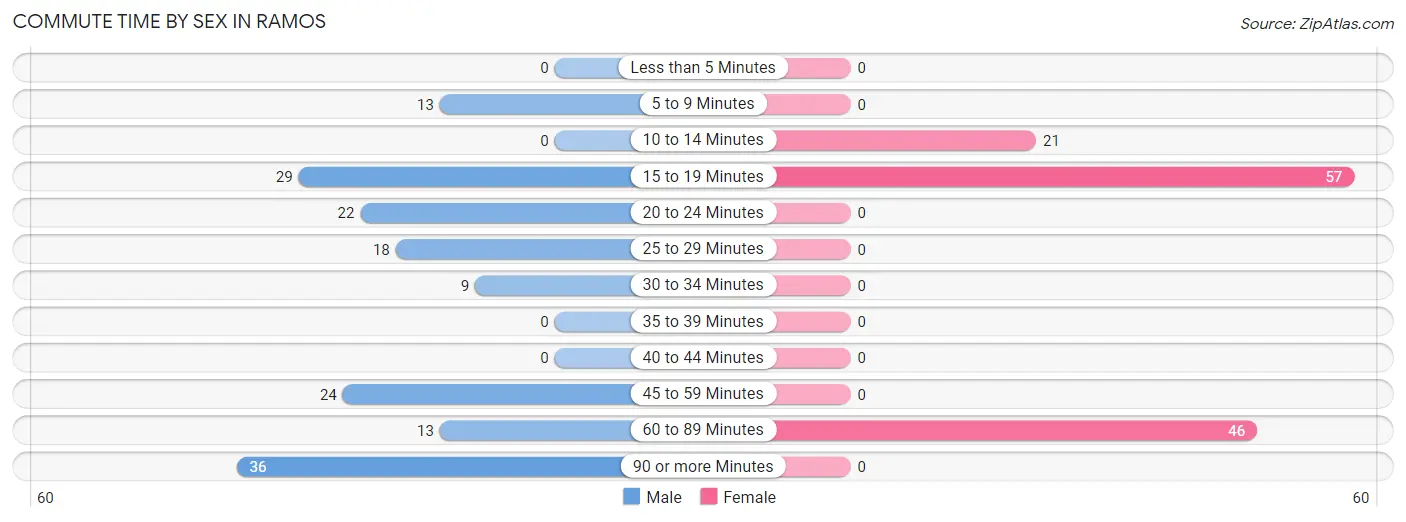
| Commute Time | Male | Female |
| Less than 5 Minutes | 0 (0.0%) | 0 (0.0%) |
| 5 to 9 Minutes | 13 (7.9%) | 0 (0.0%) |
| 10 to 14 Minutes | 0 (0.0%) | 21 (16.9%) |
| 15 to 19 Minutes | 29 (17.7%) | 57 (46.0%) |
| 20 to 24 Minutes | 22 (13.4%) | 0 (0.0%) |
| 25 to 29 Minutes | 18 (11.0%) | 0 (0.0%) |
| 30 to 34 Minutes | 9 (5.5%) | 0 (0.0%) |
| 35 to 39 Minutes | 0 (0.0%) | 0 (0.0%) |
| 40 to 44 Minutes | 0 (0.0%) | 0 (0.0%) |
| 45 to 59 Minutes | 24 (14.6%) | 0 (0.0%) |
| 60 to 89 Minutes | 13 (7.9%) | 46 (37.1%) |
| 90 or more Minutes | 36 (22.0%) | 0 (0.0%) |
Time of Departure to Work by Sex in Ramos
The most frequent times of departure to work in Ramos are 12:00 AM to 4:59 AM (39, 23.8%) for males and 6:30 AM to 6:59 AM (60, 48.4%) for females.

| Time of Departure | Male | Female |
| 12:00 AM to 4:59 AM | 39 (23.8%) | 0 (0.0%) |
| 5:00 AM to 5:29 AM | 22 (13.4%) | 0 (0.0%) |
| 5:30 AM to 5:59 AM | 13 (7.9%) | 30 (24.2%) |
| 6:00 AM to 6:29 AM | 15 (9.1%) | 13 (10.5%) |
| 6:30 AM to 6:59 AM | 0 (0.0%) | 60 (48.4%) |
| 7:00 AM to 7:29 AM | 0 (0.0%) | 0 (0.0%) |
| 7:30 AM to 7:59 AM | 19 (11.6%) | 21 (16.9%) |
| 8:00 AM to 8:29 AM | 9 (5.5%) | 0 (0.0%) |
| 8:30 AM to 8:59 AM | 0 (0.0%) | 0 (0.0%) |
| 9:00 AM to 9:59 AM | 0 (0.0%) | 0 (0.0%) |
| 10:00 AM to 10:59 AM | 0 (0.0%) | 0 (0.0%) |
| 11:00 AM to 11:59 AM | 0 (0.0%) | 0 (0.0%) |
| 12:00 PM to 3:59 PM | 29 (17.7%) | 0 (0.0%) |
| 4:00 PM to 11:59 PM | 18 (11.0%) | 0 (0.0%) |
| Total | 164 (100.0%) | 124 (100.0%) |
Housing Occupancy in Ramos
Occupancy by Ownership in Ramos
Of the total 464 dwellings in Ramos, owner-occupied units account for 375 (80.8%), while renter-occupied units make up 89 (19.2%).
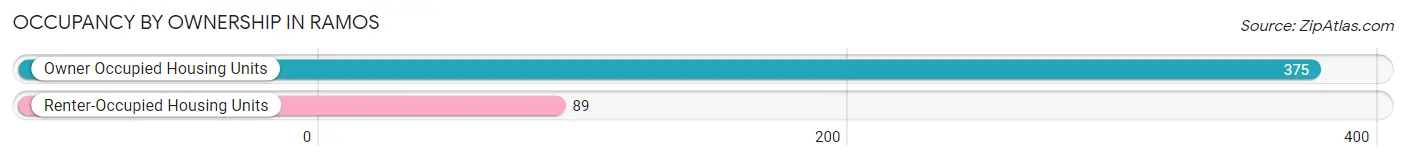
| Occupancy | # Housing Units | % Housing Units |
| Owner Occupied Housing Units | 375 | 80.8% |
| Renter-Occupied Housing Units | 89 | 19.2% |
| Total Occupied Housing Units | 464 | 100.0% |
Occupancy by Household Size in Ramos
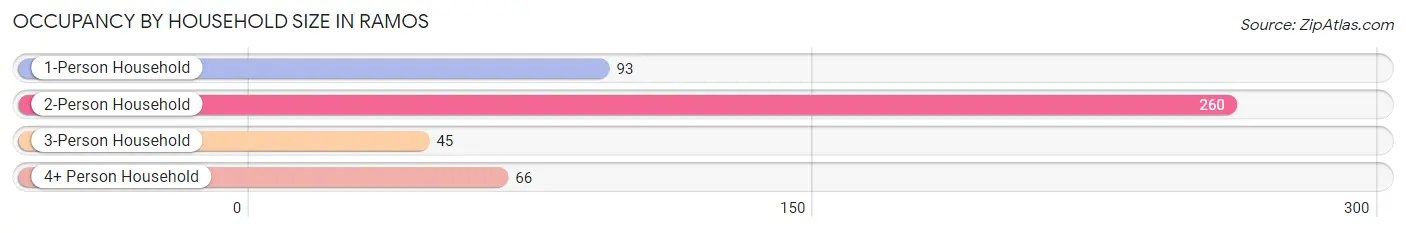
| Household Size | # Housing Units | % Housing Units |
| 1-Person Household | 93 | 20.0% |
| 2-Person Household | 260 | 56.0% |
| 3-Person Household | 45 | 9.7% |
| 4+ Person Household | 66 | 14.2% |
| Total Housing Units | 464 | 100.0% |
Occupancy by Ownership by Household Size in Ramos
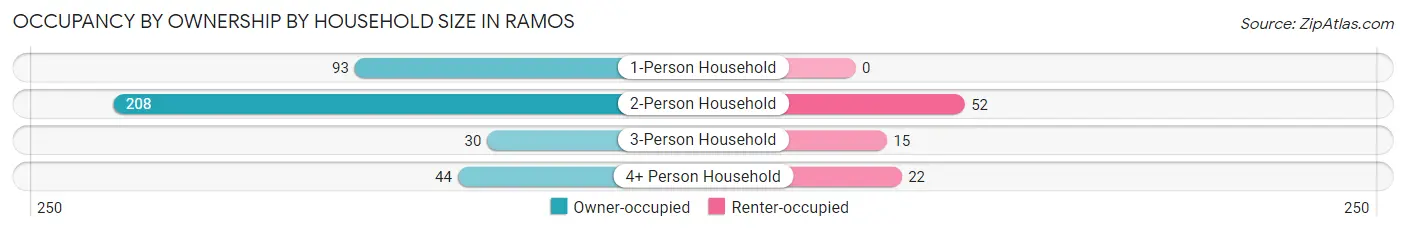
| Household Size | Owner-occupied | Renter-occupied |
| 1-Person Household | 93 (100.0%) | 0 (0.0%) |
| 2-Person Household | 208 (80.0%) | 52 (20.0%) |
| 3-Person Household | 30 (66.7%) | 15 (33.3%) |
| 4+ Person Household | 44 (66.7%) | 22 (33.3%) |
| Total Housing Units | 375 (80.8%) | 89 (19.2%) |
Occupancy by Educational Attainment in Ramos
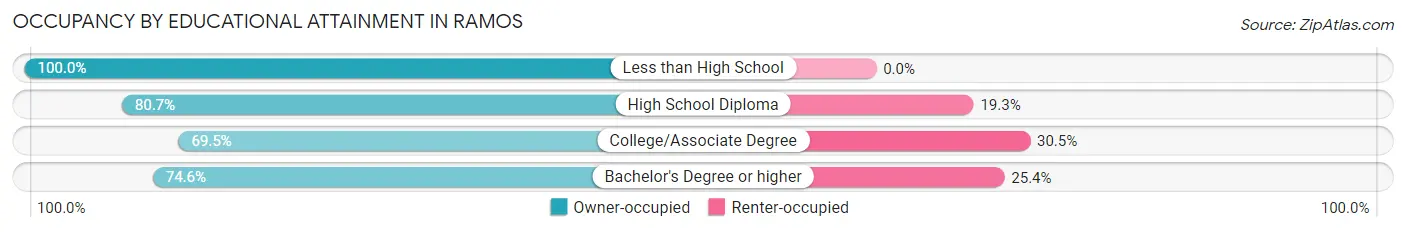
| Household Size | Owner-occupied | Renter-occupied |
| Less than High School | 90 (100.0%) | 0 (0.0%) |
| High School Diploma | 159 (80.7%) | 38 (19.3%) |
| College/Associate Degree | 82 (69.5%) | 36 (30.5%) |
| Bachelor's Degree or higher | 44 (74.6%) | 15 (25.4%) |
Occupancy by Age of Householder in Ramos
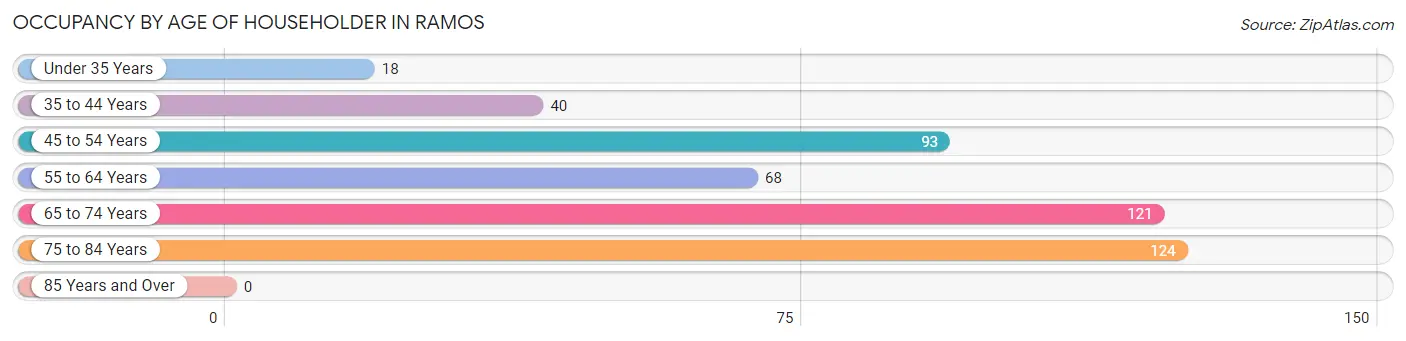
| Age Bracket | # Households | % Households |
| Under 35 Years | 18 | 3.9% |
| 35 to 44 Years | 40 | 8.6% |
| 45 to 54 Years | 93 | 20.0% |
| 55 to 64 Years | 68 | 14.7% |
| 65 to 74 Years | 121 | 26.1% |
| 75 to 84 Years | 124 | 26.7% |
| 85 Years and Over | 0 | 0.0% |
| Total | 464 | 100.0% |
Housing Finances in Ramos
Median Income by Occupancy in Ramos
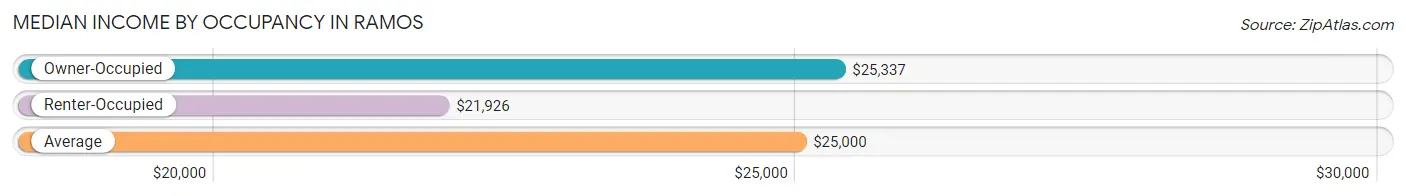
| Occupancy Type | # Households | Median Income |
| Owner-Occupied | 375 (80.8%) | $25,337 |
| Renter-Occupied | 89 (19.2%) | $21,926 |
| Average | 464 (100.0%) | $25,000 |
Occupancy by Householder Income Bracket in Ramos
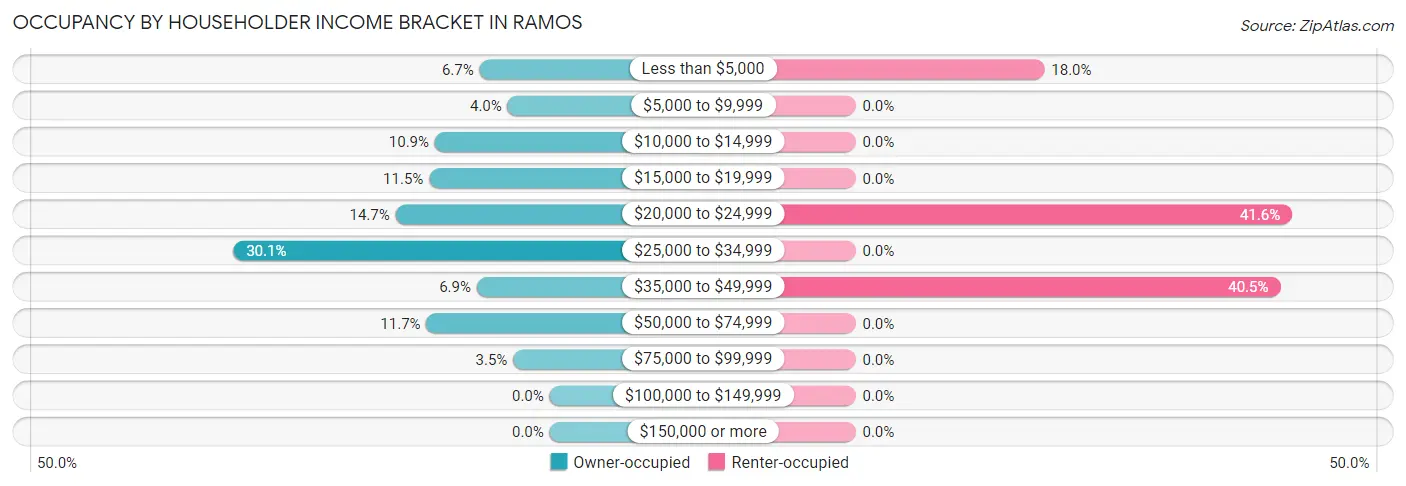
| Income Bracket | Owner-occupied | Renter-occupied |
| Less than $5,000 | 25 (6.7%) | 16 (18.0%) |
| $5,000 to $9,999 | 15 (4.0%) | 0 (0.0%) |
| $10,000 to $14,999 | 41 (10.9%) | 0 (0.0%) |
| $15,000 to $19,999 | 43 (11.5%) | 0 (0.0%) |
| $20,000 to $24,999 | 55 (14.7%) | 37 (41.6%) |
| $25,000 to $34,999 | 113 (30.1%) | 0 (0.0%) |
| $35,000 to $49,999 | 26 (6.9%) | 36 (40.5%) |
| $50,000 to $74,999 | 44 (11.7%) | 0 (0.0%) |
| $75,000 to $99,999 | 13 (3.5%) | 0 (0.0%) |
| $100,000 to $149,999 | 0 (0.0%) | 0 (0.0%) |
| $150,000 or more | 0 (0.0%) | 0 (0.0%) |
| Total | 375 (100.0%) | 89 (100.0%) |
Monthly Housing Cost Tiers in Ramos
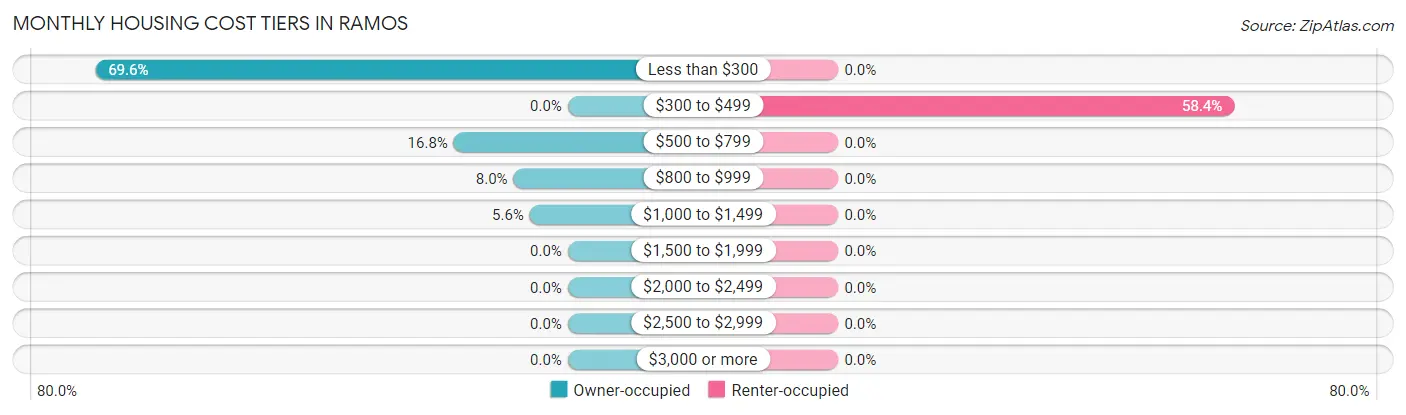
| Monthly Cost | Owner-occupied | Renter-occupied |
| Less than $300 | 261 (69.6%) | 0 (0.0%) |
| $300 to $499 | 0 (0.0%) | 52 (58.4%) |
| $500 to $799 | 63 (16.8%) | 0 (0.0%) |
| $800 to $999 | 30 (8.0%) | 0 (0.0%) |
| $1,000 to $1,499 | 21 (5.6%) | 0 (0.0%) |
| $1,500 to $1,999 | 0 (0.0%) | 0 (0.0%) |
| $2,000 to $2,499 | 0 (0.0%) | 0 (0.0%) |
| $2,500 to $2,999 | 0 (0.0%) | 0 (0.0%) |
| $3,000 or more | 0 (0.0%) | 0 (0.0%) |
| Total | 375 (100.0%) | 89 (100.0%) |
Physical Housing Characteristics in Ramos
Housing Structures in Ramos
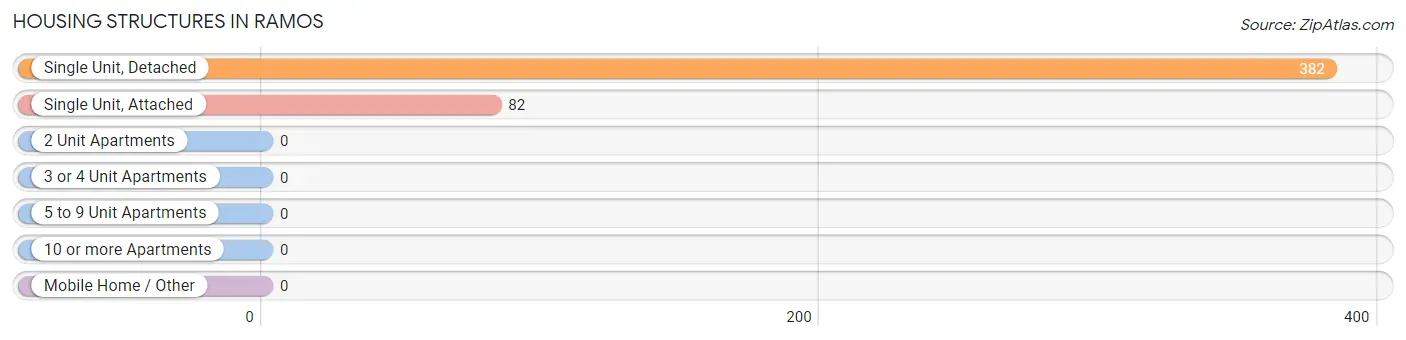
| Structure Type | # Housing Units | % Housing Units |
| Single Unit, Detached | 382 | 82.3% |
| Single Unit, Attached | 82 | 17.7% |
| 2 Unit Apartments | 0 | 0.0% |
| 3 or 4 Unit Apartments | 0 | 0.0% |
| 5 to 9 Unit Apartments | 0 | 0.0% |
| 10 or more Apartments | 0 | 0.0% |
| Mobile Home / Other | 0 | 0.0% |
| Total | 464 | 100.0% |
Housing Structures by Occupancy in Ramos
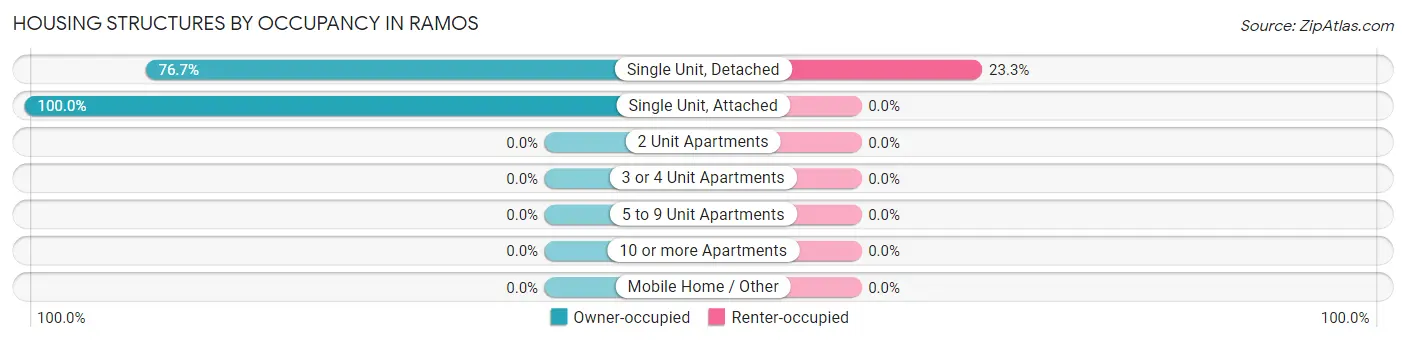
| Structure Type | Owner-occupied | Renter-occupied |
| Single Unit, Detached | 293 (76.7%) | 89 (23.3%) |
| Single Unit, Attached | 82 (100.0%) | 0 (0.0%) |
| 2 Unit Apartments | 0 (0.0%) | 0 (0.0%) |
| 3 or 4 Unit Apartments | 0 (0.0%) | 0 (0.0%) |
| 5 to 9 Unit Apartments | 0 (0.0%) | 0 (0.0%) |
| 10 or more Apartments | 0 (0.0%) | 0 (0.0%) |
| Mobile Home / Other | 0 (0.0%) | 0 (0.0%) |
| Total | 375 (80.8%) | 89 (19.2%) |
Housing Structures by Number of Rooms in Ramos
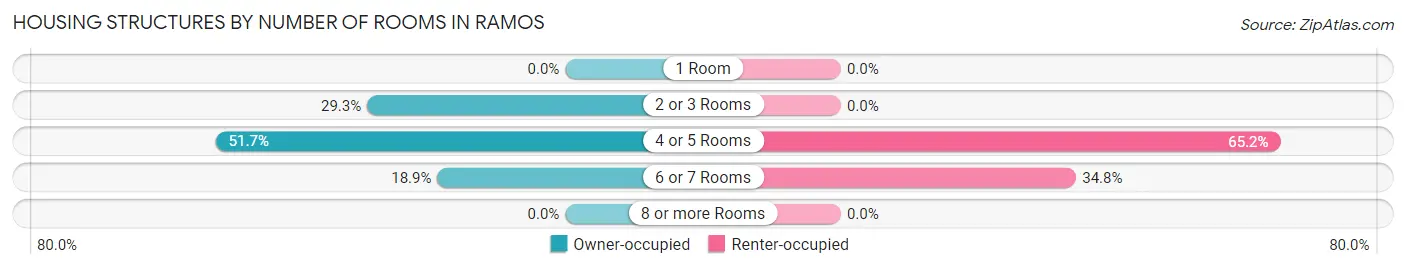
| Number of Rooms | Owner-occupied | Renter-occupied |
| 1 Room | 0 (0.0%) | 0 (0.0%) |
| 2 or 3 Rooms | 110 (29.3%) | 0 (0.0%) |
| 4 or 5 Rooms | 194 (51.7%) | 58 (65.2%) |
| 6 or 7 Rooms | 71 (18.9%) | 31 (34.8%) |
| 8 or more Rooms | 0 (0.0%) | 0 (0.0%) |
| Total | 375 (100.0%) | 89 (100.0%) |
Housing Structure by Heating Type in Ramos
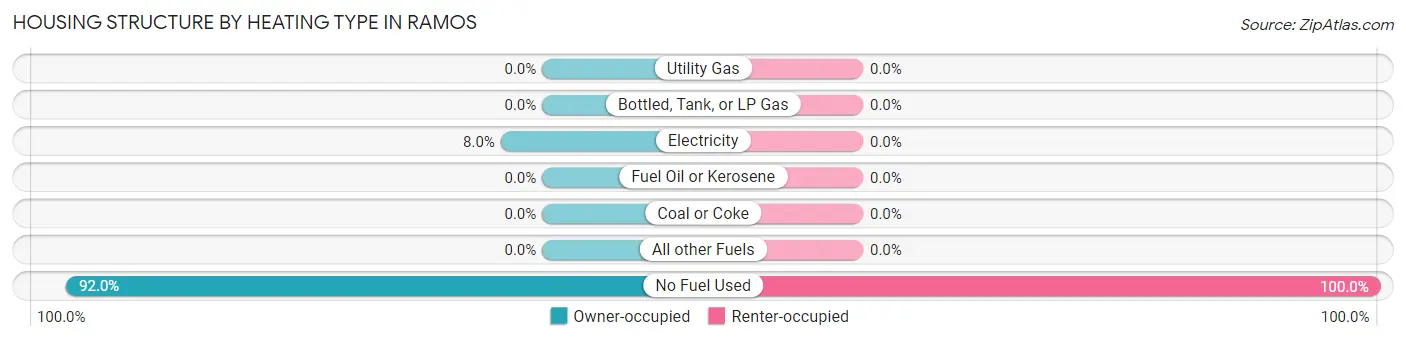
| Heating Type | Owner-occupied | Renter-occupied |
| Utility Gas | 0 (0.0%) | 0 (0.0%) |
| Bottled, Tank, or LP Gas | 0 (0.0%) | 0 (0.0%) |
| Electricity | 30 (8.0%) | 0 (0.0%) |
| Fuel Oil or Kerosene | 0 (0.0%) | 0 (0.0%) |
| Coal or Coke | 0 (0.0%) | 0 (0.0%) |
| All other Fuels | 0 (0.0%) | 0 (0.0%) |
| No Fuel Used | 345 (92.0%) | 89 (100.0%) |
| Total | 375 (100.0%) | 89 (100.0%) |
Household Vehicle Usage in Ramos
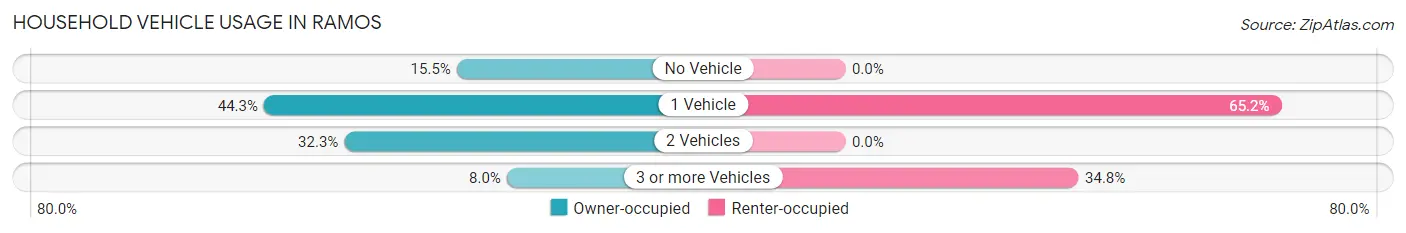
| Vehicles per Household | Owner-occupied | Renter-occupied |
| No Vehicle | 58 (15.5%) | 0 (0.0%) |
| 1 Vehicle | 166 (44.3%) | 58 (65.2%) |
| 2 Vehicles | 121 (32.3%) | 0 (0.0%) |
| 3 or more Vehicles | 30 (8.0%) | 31 (34.8%) |
| Total | 375 (100.0%) | 89 (100.0%) |
Real Estate & Mortgages in Ramos
Real Estate and Mortgage Overview in Ramos
| Characteristic | Without Mortgage | With Mortgage |
| Housing Units | 261 | 114 |
| Median Property Value | $115,400 | $85,600 |
| Median Household Income | $25,694 | $0 |
| Monthly Housing Costs | $170 | $0 |
| Real Estate Taxes | $331 | $114 |
Property Value by Mortgage Status in Ramos
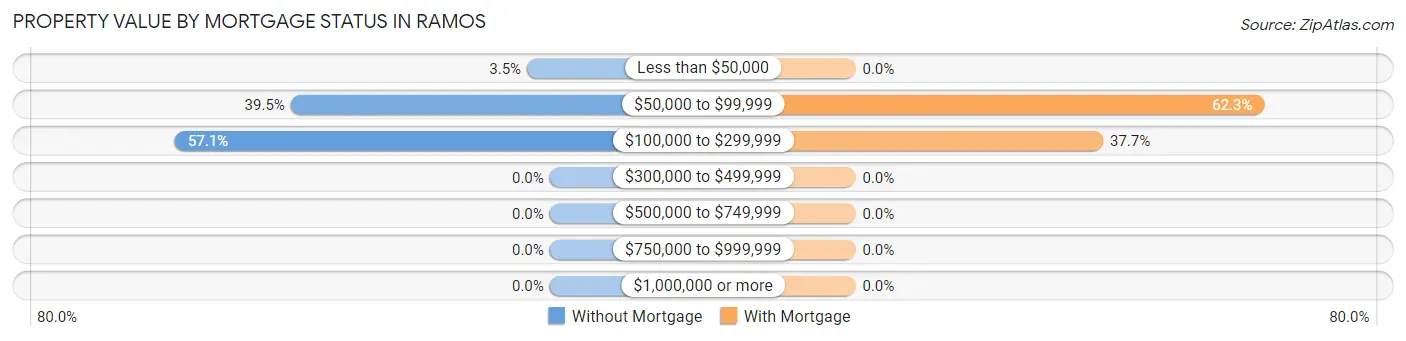
| Property Value | Without Mortgage | With Mortgage |
| Less than $50,000 | 9 (3.5%) | 0 (0.0%) |
| $50,000 to $99,999 | 103 (39.5%) | 71 (62.3%) |
| $100,000 to $299,999 | 149 (57.1%) | 43 (37.7%) |
| $300,000 to $499,999 | 0 (0.0%) | 0 (0.0%) |
| $500,000 to $749,999 | 0 (0.0%) | 0 (0.0%) |
| $750,000 to $999,999 | 0 (0.0%) | 0 (0.0%) |
| $1,000,000 or more | 0 (0.0%) | 0 (0.0%) |
| Total | 261 (100.0%) | 114 (100.0%) |
Household Income by Mortgage Status in Ramos
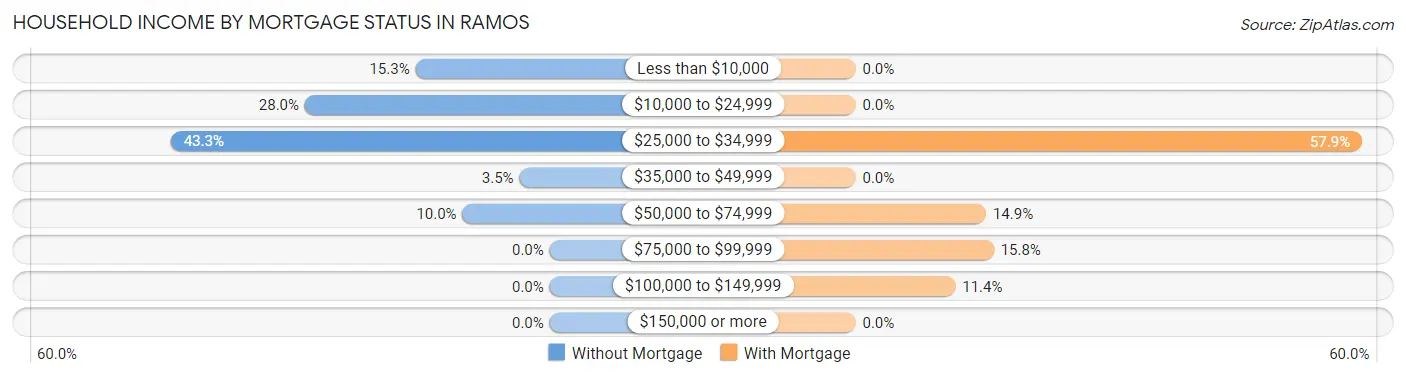
| Household Income | Without Mortgage | With Mortgage |
| Less than $10,000 | 40 (15.3%) | 0 (0.0%) |
| $10,000 to $24,999 | 73 (28.0%) | 0 (0.0%) |
| $25,000 to $34,999 | 113 (43.3%) | 66 (57.9%) |
| $35,000 to $49,999 | 9 (3.5%) | 0 (0.0%) |
| $50,000 to $74,999 | 26 (10.0%) | 17 (14.9%) |
| $75,000 to $99,999 | 0 (0.0%) | 18 (15.8%) |
| $100,000 to $149,999 | 0 (0.0%) | 13 (11.4%) |
| $150,000 or more | 0 (0.0%) | 0 (0.0%) |
| Total | 261 (100.0%) | 114 (100.0%) |
Property Value to Household Income Ratio in Ramos
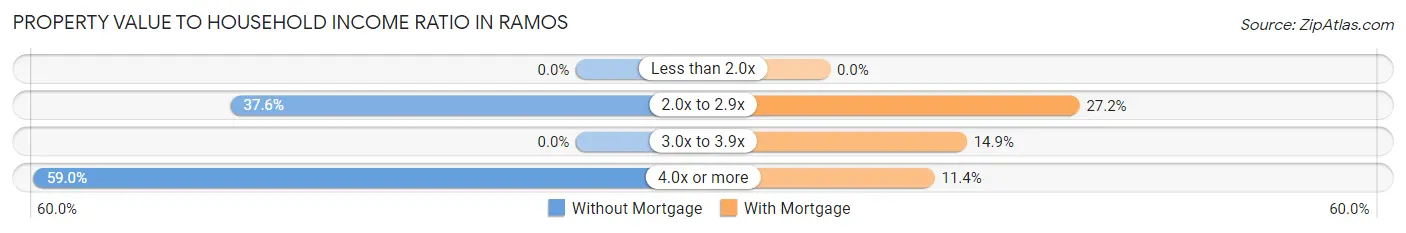
| Value-to-Income Ratio | Without Mortgage | With Mortgage |
| Less than 2.0x | 0 (0.0%) | 0 (0.0%) |
| 2.0x to 2.9x | 98 (37.6%) | 31 (27.2%) |
| 3.0x to 3.9x | 0 (0.0%) | 17 (14.9%) |
| 4.0x or more | 154 (59.0%) | 13 (11.4%) |
| Total | 261 (100.0%) | 114 (100.0%) |
Real Estate Taxes by Mortgage Status in Ramos
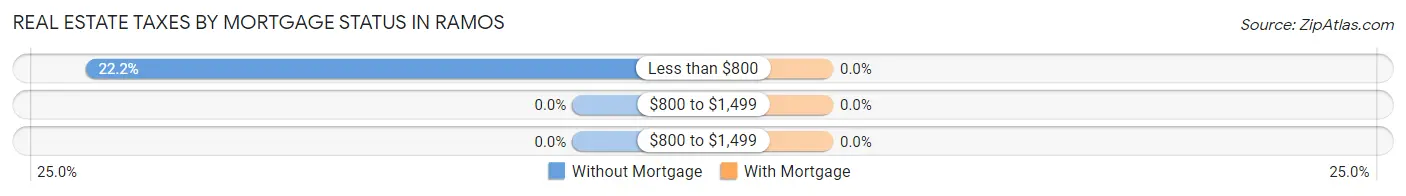
| Property Taxes | Without Mortgage | With Mortgage |
| Less than $800 | 58 (22.2%) | 0 (0.0%) |
| $800 to $1,499 | 0 (0.0%) | 0 (0.0%) |
| $800 to $1,499 | 0 (0.0%) | 0 (0.0%) |
| Total | 261 (100.0%) | 114 (100.0%) |
Health & Disability in Ramos
Health Insurance Coverage by Age in Ramos
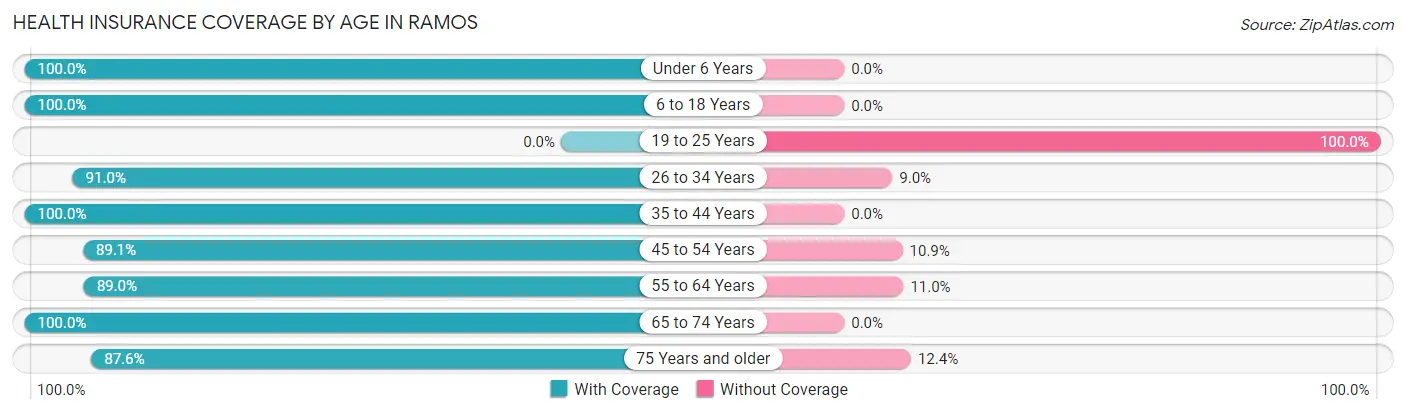
| Age Bracket | With Coverage | Without Coverage |
| Under 6 Years | 67 (100.0%) | 0 (0.0%) |
| 6 to 18 Years | 109 (100.0%) | 0 (0.0%) |
| 19 to 25 Years | 0 (0.0%) | 44 (100.0%) |
| 26 to 34 Years | 183 (91.0%) | 18 (9.0%) |
| 35 to 44 Years | 176 (100.0%) | 0 (0.0%) |
| 45 to 54 Years | 123 (89.1%) | 15 (10.9%) |
| 55 to 64 Years | 121 (89.0%) | 15 (11.0%) |
| 65 to 74 Years | 237 (100.0%) | 0 (0.0%) |
| 75 Years and older | 183 (87.6%) | 26 (12.4%) |
| Total | 1,199 (91.0%) | 118 (9.0%) |
Health Insurance Coverage by Citizenship Status in Ramos
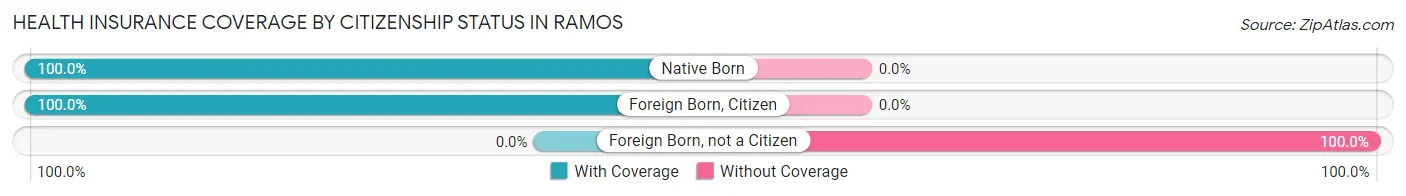
| Citizenship Status | With Coverage | Without Coverage |
| Native Born | 67 (100.0%) | 0 (0.0%) |
| Foreign Born, Citizen | 109 (100.0%) | 0 (0.0%) |
| Foreign Born, not a Citizen | 0 (0.0%) | 44 (100.0%) |
Health Insurance Coverage by Household Income in Ramos
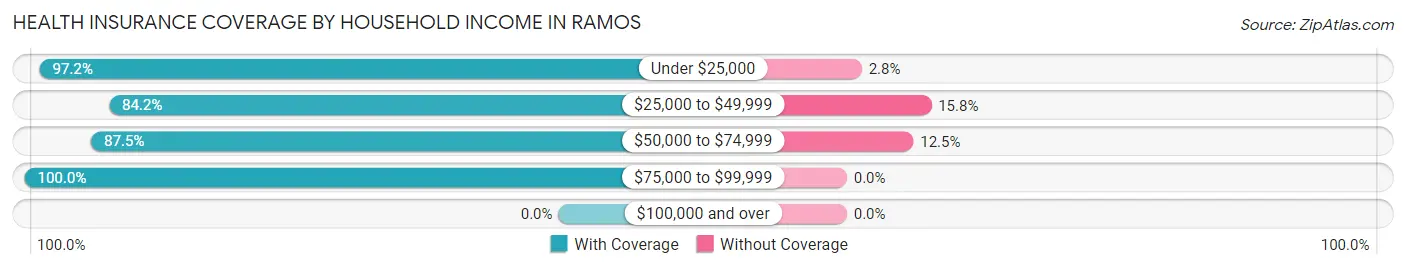
| Household Income | With Coverage | Without Coverage |
| Under $25,000 | 520 (97.2%) | 15 (2.8%) |
| $25,000 to $49,999 | 314 (84.2%) | 59 (15.8%) |
| $50,000 to $74,999 | 309 (87.5%) | 44 (12.5%) |
| $75,000 to $99,999 | 45 (100.0%) | 0 (0.0%) |
| $100,000 and over | 0 (0.0%) | 0 (0.0%) |
Public vs Private Health Insurance Coverage by Age in Ramos
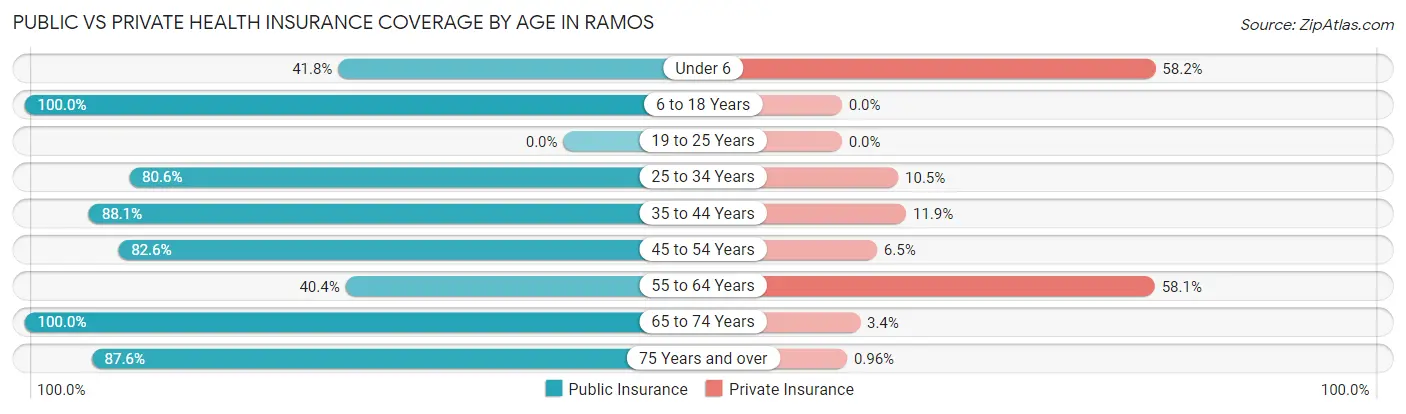
| Age Bracket | Public Insurance | Private Insurance |
| Under 6 | 28 (41.8%) | 39 (58.2%) |
| 6 to 18 Years | 109 (100.0%) | 0 (0.0%) |
| 19 to 25 Years | 0 (0.0%) | 0 (0.0%) |
| 25 to 34 Years | 162 (80.6%) | 21 (10.4%) |
| 35 to 44 Years | 155 (88.1%) | 21 (11.9%) |
| 45 to 54 Years | 114 (82.6%) | 9 (6.5%) |
| 55 to 64 Years | 55 (40.4%) | 79 (58.1%) |
| 65 to 74 Years | 237 (100.0%) | 8 (3.4%) |
| 75 Years and over | 183 (87.6%) | 2 (1.0%) |
| Total | 1,043 (79.2%) | 179 (13.6%) |
Disability Status by Sex by Age in Ramos
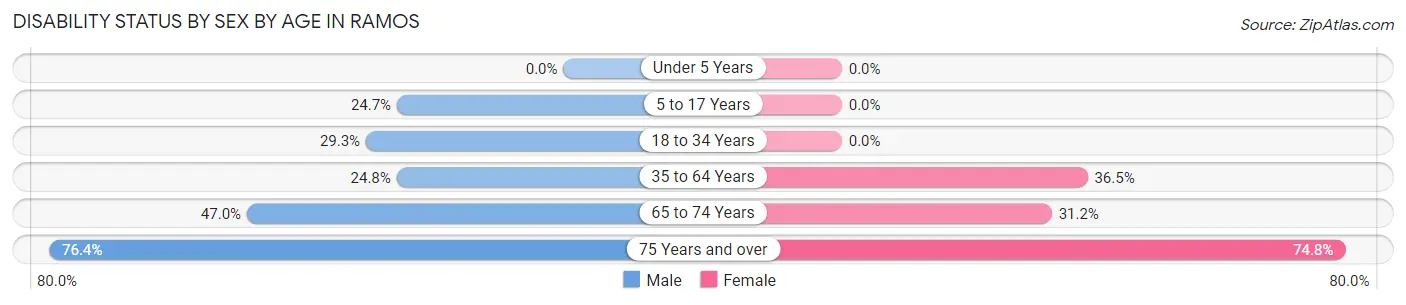
| Age Bracket | Male | Female |
| Under 5 Years | 0 (0.0%) | 0 (0.0%) |
| 5 to 17 Years | 21 (24.7%) | 0 (0.0%) |
| 18 to 34 Years | 34 (29.3%) | 0 (0.0%) |
| 35 to 64 Years | 51 (24.8%) | 89 (36.5%) |
| 65 to 74 Years | 39 (47.0%) | 48 (31.2%) |
| 75 Years and over | 84 (76.4%) | 74 (74.8%) |
Disability Class by Sex by Age in Ramos
Disability Class: Hearing Difficulty
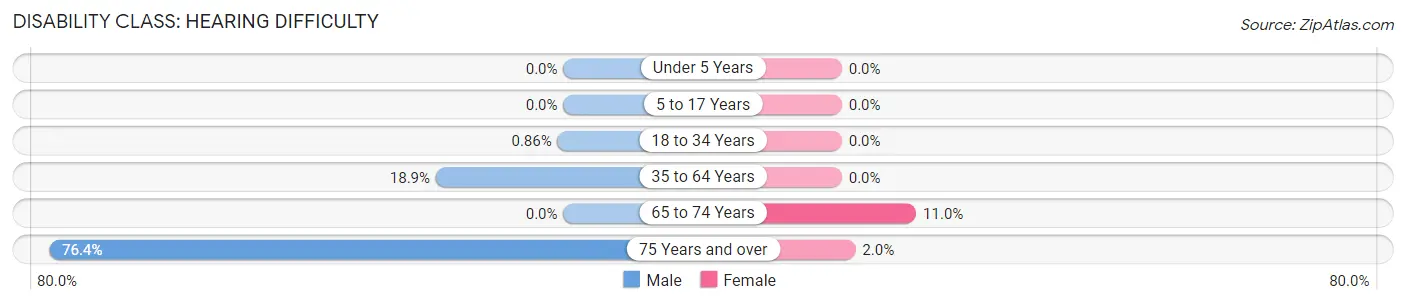
| Age Bracket | Male | Female |
| Under 5 Years | 0 (0.0%) | 0 (0.0%) |
| 5 to 17 Years | 0 (0.0%) | 0 (0.0%) |
| 18 to 34 Years | 1 (0.9%) | 0 (0.0%) |
| 35 to 64 Years | 39 (18.9%) | 0 (0.0%) |
| 65 to 74 Years | 0 (0.0%) | 17 (11.0%) |
| 75 Years and over | 84 (76.4%) | 2 (2.0%) |
Disability Class: Vision Difficulty
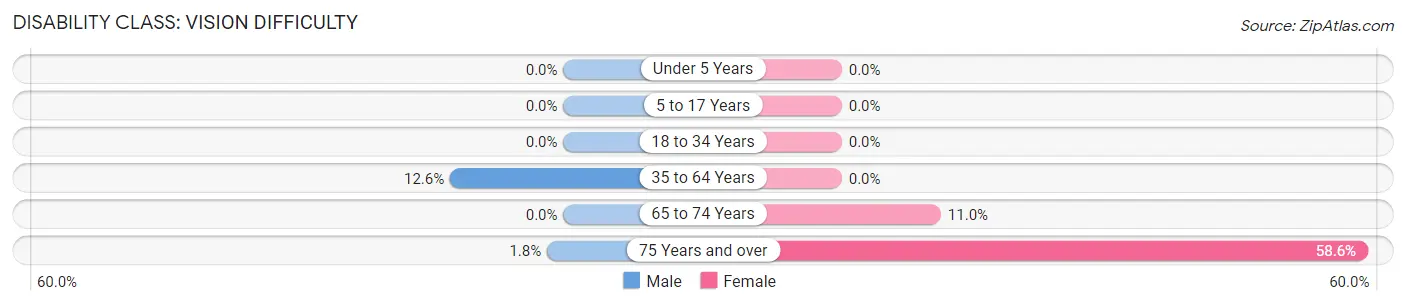
| Age Bracket | Male | Female |
| Under 5 Years | 0 (0.0%) | 0 (0.0%) |
| 5 to 17 Years | 0 (0.0%) | 0 (0.0%) |
| 18 to 34 Years | 0 (0.0%) | 0 (0.0%) |
| 35 to 64 Years | 26 (12.6%) | 0 (0.0%) |
| 65 to 74 Years | 0 (0.0%) | 17 (11.0%) |
| 75 Years and over | 2 (1.8%) | 58 (58.6%) |
Disability Class: Cognitive Difficulty
| Age Bracket | Male | Female |
| 5 to 17 Years | 21 (24.7%) | 0 (0.0%) |
| 18 to 34 Years | 33 (28.4%) | 0 (0.0%) |
| 35 to 64 Years | 51 (24.8%) | 16 (6.6%) |
| 65 to 74 Years | 10 (12.0%) | 31 (20.1%) |
| 75 Years and over | 4 (3.6%) | 5 (5.1%) |
Disability Class: Ambulatory Difficulty
| Age Bracket | Male | Female |
| 5 to 17 Years | 0 (0.0%) | 0 (0.0%) |
| 18 to 34 Years | 0 (0.0%) | 0 (0.0%) |
| 35 to 64 Years | 26 (12.6%) | 89 (36.5%) |
| 65 to 74 Years | 39 (47.0%) | 31 (20.1%) |
| 75 Years and over | 52 (47.3%) | 74 (74.8%) |
Disability Class: Self-Care Difficulty
| Age Bracket | Male | Female |
| 5 to 17 Years | 0 (0.0%) | 0 (0.0%) |
| 18 to 34 Years | 33 (28.4%) | 0 (0.0%) |
| 35 to 64 Years | 39 (18.9%) | 41 (16.8%) |
| 65 to 74 Years | 10 (12.0%) | 0 (0.0%) |
| 75 Years and over | 33 (30.0%) | 18 (18.2%) |
Technology Access in Ramos
Computing Device Access in Ramos
| Device Type | # Households | % Households |
| Desktop or Laptop | 154 | 33.2% |
| Smartphone | 355 | 76.5% |
| Tablet | 82 | 17.7% |
| No Computing Device | 109 | 23.5% |
| Total | 464 | 100.0% |
Internet Access in Ramos
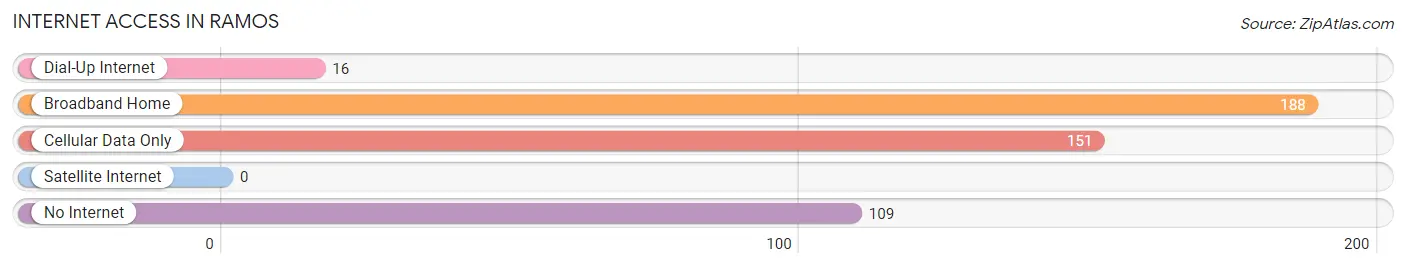
| Internet Type | # Households | % Households |
| Dial-Up Internet | 16 | 3.5% |
| Broadband Home | 188 | 40.5% |
| Cellular Data Only | 151 | 32.5% |
| Satellite Internet | 0 | 0.0% |
| No Internet | 109 | 23.5% |
| Total | 464 | 100.0% |
Ramos Summary
Ramos is a municipality located in the eastern part of the island of Puerto Rico. It is part of the San Juan-Caguas-Guaynabo Metropolitan Statistical Area. The municipality is located in the northern coast of the island, north of Toa Baja and Bayamón; east of Dorado; and west of Vega Alta. As of the 2010 census, it had a population of 24,845.
History
The area of Ramos was originally inhabited by the Taíno Indians. The first settlers of the area were the Spanish, who arrived in the 16th century. The area was part of the municipality of Bayamón until 1831, when it was established as an independent municipality.
Geography
Ramos is located in the northern coast of Puerto Rico, north of Toa Baja and Bayamón; east of Dorado; and west of Vega Alta. It is bordered by the Atlantic Ocean to the north, the municipality of Toa Baja to the south, the municipality of Dorado to the east, and the municipality of Vega Alta to the west.
The municipality has a total area of 8.9 square miles, of which 8.7 square miles is land and 0.2 square miles is water. The terrain is mostly flat, with some hills in the western part of the municipality.
Economy
The economy of Ramos is mainly based on agriculture and tourism. The main agricultural products are sugar cane, coffee, and fruits. The municipality is also home to several industrial parks, which are home to a variety of industries, including electronics, pharmaceuticals, and food processing.
Tourism is also an important part of the economy. The municipality is home to several beaches, including Playa de Ramos, which is popular with tourists.
Demographics
As of the 2010 census, Ramos had a population of 24,845. The population was spread out, with 48.3% male and 51.7% female. The median age was 38.7 years.
The racial makeup of the municipality was 79.2% White, 12.2% Black or African American, 0.3% Native American, 0.7% Asian, 0.1% Pacific Islander, 5.3% from other races, and 2.3% from two or more races. Hispanic or Latino of any race were 97.2% of the population.
The median household income was $17,845, and the median family income was $20,945. About 28.3% of the population was below the poverty line.
Common Questions
What is Per Capita Income in Ramos?
Per Capita income in Ramos is $11,359.
What is the Median Family Income in Ramos?
Median Family Income in Ramos is $25,615.
What is the Median Household income in Ramos?
Median Household Income in Ramos is $25,000.
What is Income or Wage Gap in Ramos?
Income or Wage Gap in Ramos is 3.1%.
Women in Ramos earn 96.9 cents for every dollar earned by a man.
What is Family Income Deficit in Ramos?
Family Income Deficit in Ramos is $9,083.
Families that are below poverty line in Ramos earn $9,083 less on average than the poverty threshold level.
What is Inequality or Gini Index in Ramos?
Inequality or Gini Index in Ramos is 0.35.
What is the Total Population of Ramos?
Total Population of Ramos is 1,319.
What is the Total Male Population of Ramos?
Total Male Population of Ramos is 641.
What is the Total Female Population of Ramos?
Total Female Population of Ramos is 678.
What is the Ratio of Males per 100 Females in Ramos?
There are 94.54 Males per 100 Females in Ramos.
What is the Ratio of Females per 100 Males in Ramos?
There are 105.77 Females per 100 Males in Ramos.
What is the Median Population Age in Ramos?
Median Population Age in Ramos is 51.4 Years.
What is the Average Family Size in Ramos
Average Family Size in Ramos is 3.5 People.
What is the Average Household Size in Ramos
Average Household Size in Ramos is 2.8 People.
How Large is the Labor Force in Ramos?
There are 486 People in the Labor Forcein in Ramos.
What is the Percentage of People in the Labor Force in Ramos?
40.9% of People are in the Labor Force in Ramos.
What is the Unemployment Rate in Ramos?
Unemployment Rate in Ramos is 36.4%.