Parcelas Viejas Borinquen, PR Map & Demographics
Parcelas Viejas Borinquen Map
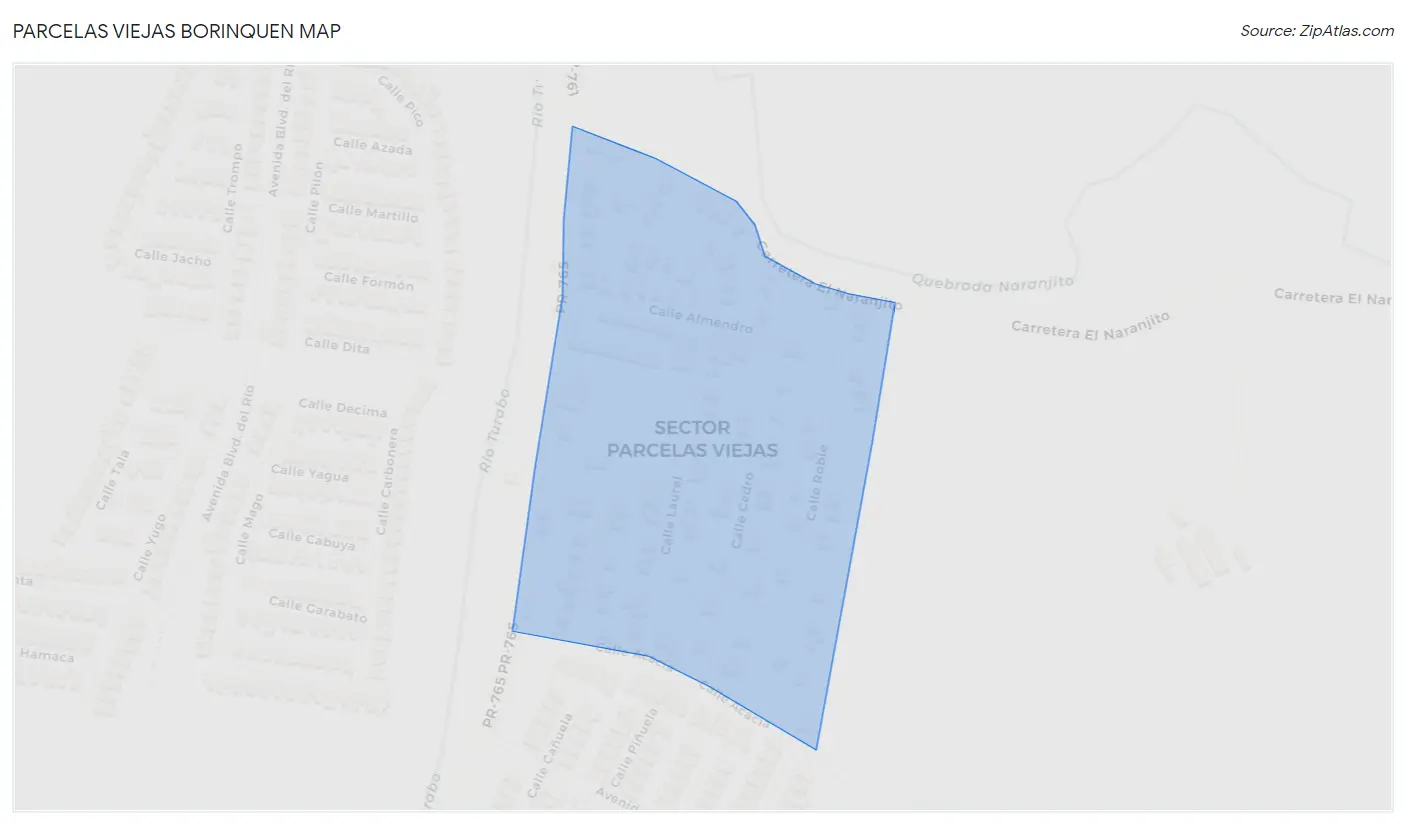
Parcelas Viejas Borinquen Overview
$9,923
PER CAPITA INCOME
$35,229
AVG FAMILY INCOME
$25,568
AVG HOUSEHOLD INCOME
0.34
INEQUALITY / GINI INDEX
1,085
TOTAL POPULATION
497
MALE POPULATION
588
FEMALE POPULATION
84.52
MALES / 100 FEMALES
118.31
FEMALES / 100 MALES
46.1
MEDIAN AGE
3.9
AVG FAMILY SIZE
3.5
AVG HOUSEHOLD SIZE
294
LABOR FORCE [ PEOPLE ]
31.0%
PERCENT IN LABOR FORCE
21.4%
UNEMPLOYMENT RATE
Income in Parcelas Viejas Borinquen
Income Overview in Parcelas Viejas Borinquen
Per Capita Income in Parcelas Viejas Borinquen is $9,923, while median incomes of families and households are $35,229 and $25,568 respectively.
| Characteristic | Number | Measure |
| Per Capita Income | 1,085 | $9,923 |
| Median Family Income | 263 | $35,229 |
| Mean Family Income | 263 | $30,184 |
| Median Household Income | 308 | $25,568 |
| Mean Household Income | 308 | $27,369 |
| Income Deficit | 263 | $0 |
| Wage / Income Gap (%) | 1,085 | 0.00% |
| Wage / Income Gap ($) | 1,085 | 100.00¢ per $1 |
| Gini / Inequality Index | 1,085 | 0.34 |
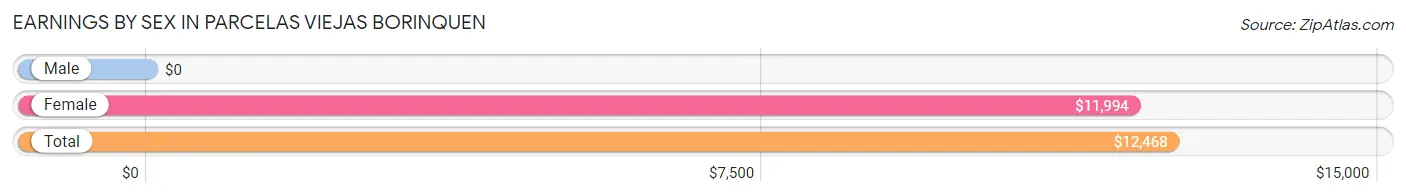
Earnings by Sex in Parcelas Viejas Borinquen
| Sex | Number | Average Earnings |
| Male | 156 (49.4%) | $0 |
| Female | 160 (50.6%) | $11,994 |
| Total | 316 (100.0%) | $12,468 |
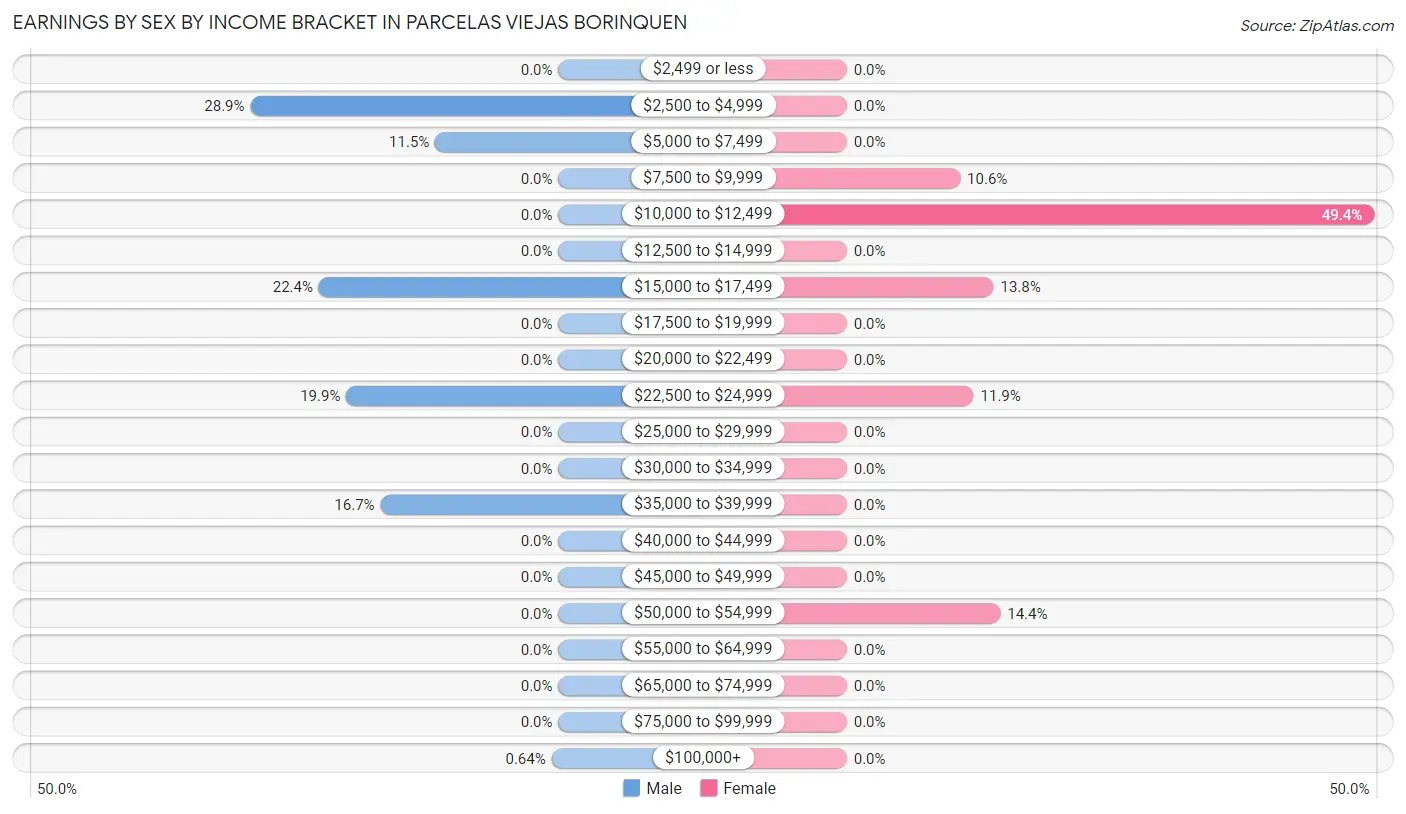
Earnings by Sex by Income Bracket in Parcelas Viejas Borinquen
The most common earnings brackets in Parcelas Viejas Borinquen are $2,500 to $4,999 for men (45 | 28.8%) and $10,000 to $12,499 for women (79 | 49.4%).
| Income | Male | Female |
| $2,499 or less | 0 (0.0%) | 0 (0.0%) |
| $2,500 to $4,999 | 45 (28.8%) | 0 (0.0%) |
| $5,000 to $7,499 | 18 (11.5%) | 0 (0.0%) |
| $7,500 to $9,999 | 0 (0.0%) | 17 (10.6%) |
| $10,000 to $12,499 | 0 (0.0%) | 79 (49.4%) |
| $12,500 to $14,999 | 0 (0.0%) | 0 (0.0%) |
| $15,000 to $17,499 | 35 (22.4%) | 22 (13.8%) |
| $17,500 to $19,999 | 0 (0.0%) | 0 (0.0%) |
| $20,000 to $22,499 | 0 (0.0%) | 0 (0.0%) |
| $22,500 to $24,999 | 31 (19.9%) | 19 (11.9%) |
| $25,000 to $29,999 | 0 (0.0%) | 0 (0.0%) |
| $30,000 to $34,999 | 0 (0.0%) | 0 (0.0%) |
| $35,000 to $39,999 | 26 (16.7%) | 0 (0.0%) |
| $40,000 to $44,999 | 0 (0.0%) | 0 (0.0%) |
| $45,000 to $49,999 | 0 (0.0%) | 0 (0.0%) |
| $50,000 to $54,999 | 0 (0.0%) | 23 (14.4%) |
| $55,000 to $64,999 | 0 (0.0%) | 0 (0.0%) |
| $65,000 to $74,999 | 0 (0.0%) | 0 (0.0%) |
| $75,000 to $99,999 | 0 (0.0%) | 0 (0.0%) |
| $100,000+ | 1 (0.6%) | 0 (0.0%) |
| Total | 156 (100.0%) | 160 (100.0%) |
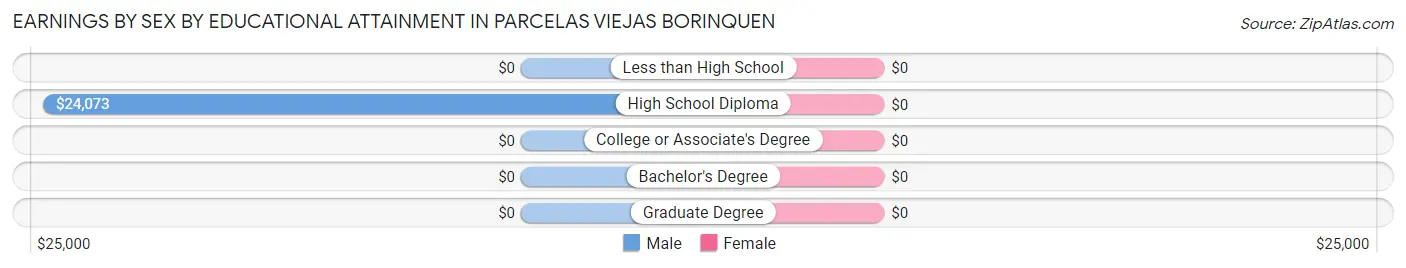
Earnings by Sex by Educational Attainment in Parcelas Viejas Borinquen
| Educational Attainment | Male Income | Female Income |
| Less than High School | - | - |
| High School Diploma | $24,073 | $0 |
| College or Associate's Degree | - | - |
| Bachelor's Degree | - | - |
| Graduate Degree | - | - |
| Total | - | - |
Family Income in Parcelas Viejas Borinquen
Family Income Brackets in Parcelas Viejas Borinquen
According to the Parcelas Viejas Borinquen family income data, there are 104 families falling into the $10,000 to $14,999 income range, which is the most common income bracket and makes up 39.5% of all families.
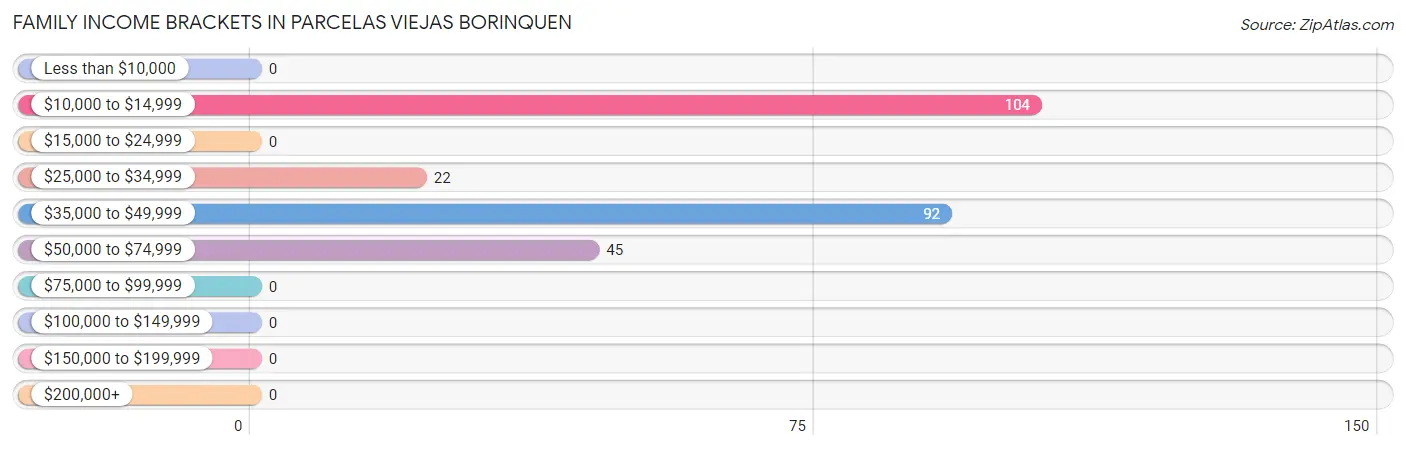
| Income Bracket | # Families | % Families |
| Less than $10,000 | 0 | 0.0% |
| $10,000 to $14,999 | 104 | 39.5% |
| $15,000 to $24,999 | 0 | 0.0% |
| $25,000 to $34,999 | 22 | 8.4% |
| $35,000 to $49,999 | 92 | 35.0% |
| $50,000 to $74,999 | 45 | 17.1% |
| $75,000 to $99,999 | 0 | 0.0% |
| $100,000 to $149,999 | 0 | 0.0% |
| $150,000 to $199,999 | 0 | 0.0% |
| $200,000+ | 0 | 0.0% |
Family Income by Famaliy Size in Parcelas Viejas Borinquen
4-person families (113 | 43.0%) account for the highest median family income in Parcelas Viejas Borinquen with $36,343 per family, while 4-person families (113 | 43.0%) have the highest median income of $9,086 per family member.
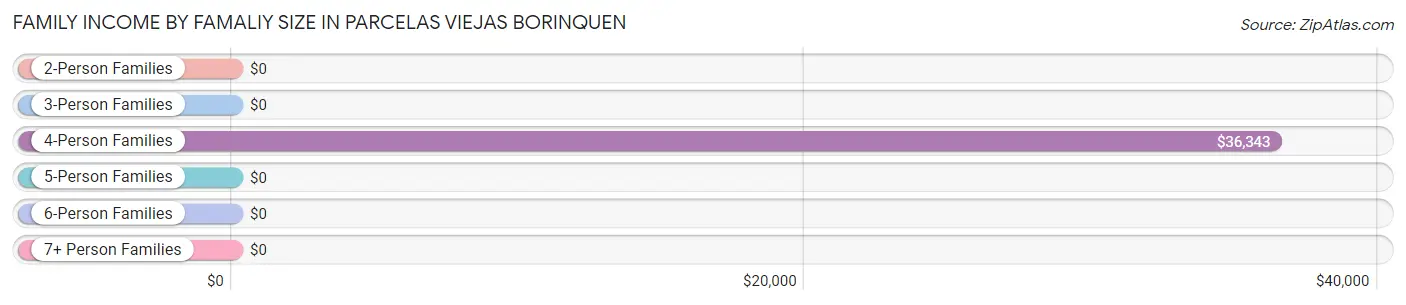
| Income Bracket | # Families | Median Income |
| 2-Person Families | 105 (39.9%) | $0 |
| 3-Person Families | 12 (4.6%) | $0 |
| 4-Person Families | 113 (43.0%) | $36,343 |
| 5-Person Families | 33 (12.6%) | $0 |
| 6-Person Families | 0 (0.0%) | $0 |
| 7+ Person Families | 0 (0.0%) | $0 |
| Total | 263 (100.0%) | $35,229 |
Family Income by Number of Earners in Parcelas Viejas Borinquen
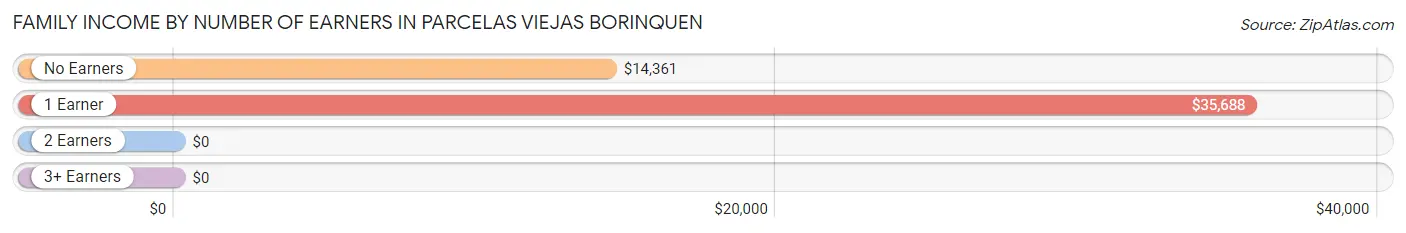
| Number of Earners | # Families | Median Income |
| No Earners | 67 (25.5%) | $14,361 |
| 1 Earner | 151 (57.4%) | $35,688 |
| 2 Earners | 45 (17.1%) | $0 |
| 3+ Earners | 0 (0.0%) | $0 |
| Total | 263 (100.0%) | $35,229 |
Household Income in Parcelas Viejas Borinquen
Household Income Brackets in Parcelas Viejas Borinquen
With 127 households falling in the category, the $10,000 to $14,999 income range is the most frequent in Parcelas Viejas Borinquen, accounting for 41.2% of all households.
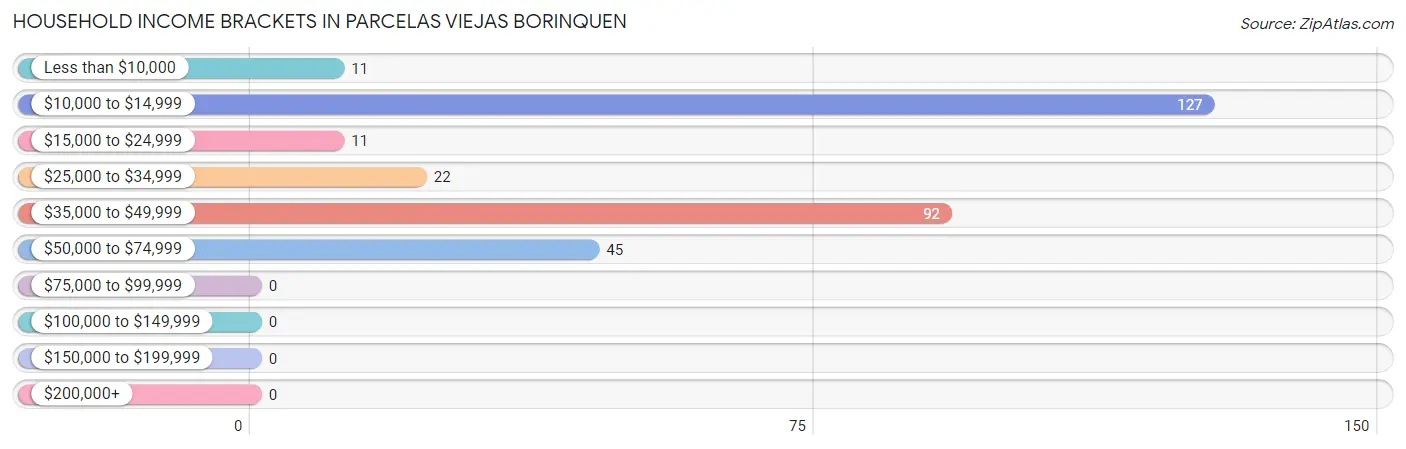
| Income Bracket | # Households | % Households |
| Less than $10,000 | 11 | 3.6% |
| $10,000 to $14,999 | 127 | 41.2% |
| $15,000 to $24,999 | 11 | 3.6% |
| $25,000 to $34,999 | 22 | 7.1% |
| $35,000 to $49,999 | 92 | 29.9% |
| $50,000 to $74,999 | 45 | 14.6% |
| $75,000 to $99,999 | 0 | 0.0% |
| $100,000 to $149,999 | 0 | 0.0% |
| $150,000 to $199,999 | 0 | 0.0% |
| $200,000+ | 0 | 0.0% |
Household Income by Householder Age in Parcelas Viejas Borinquen
The median household income in Parcelas Viejas Borinquen is $25,568, with the highest median household income of $26,818 found in the 65+ years age bracket for the primary householder. A total of 78 households (25.3%) fall into this category.
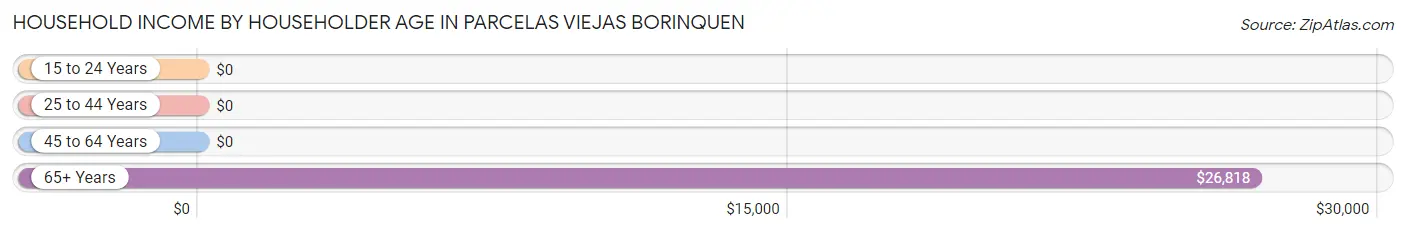
| Income Bracket | # Households | Median Income |
| 15 to 24 Years | 0 (0.0%) | $0 |
| 25 to 44 Years | 64 (20.8%) | $0 |
| 45 to 64 Years | 166 (53.9%) | $0 |
| 65+ Years | 78 (25.3%) | $26,818 |
| Total | 308 (100.0%) | $25,568 |
Poverty in Parcelas Viejas Borinquen
Income Below Poverty by Sex and Age in Parcelas Viejas Borinquen
With 51.9% poverty level for males and 47.8% for females among the residents of Parcelas Viejas Borinquen, under 5 year old males and 6 to 11 year old females are the most vulnerable to poverty, with 32 males (100.0%) and 30 females (100.0%) in their respective age groups living below the poverty level.
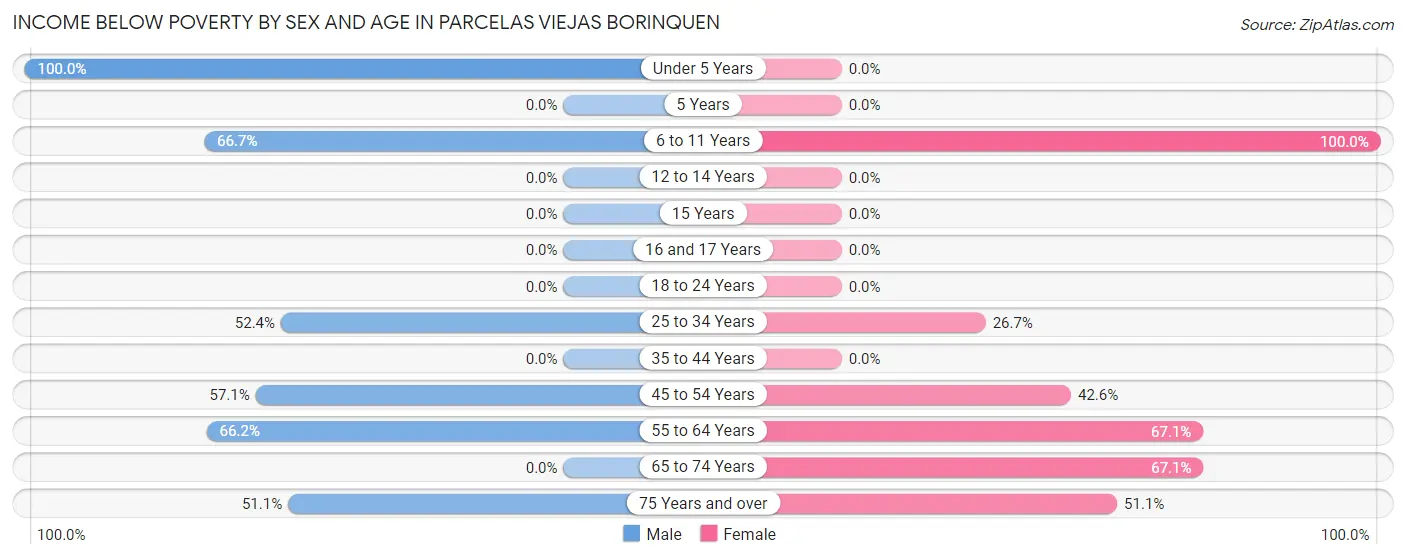
| Age Bracket | Male | Female |
| Under 5 Years | 32 (100.0%) | 0 (0.0%) |
| 5 Years | 0 (0.0%) | 0 (0.0%) |
| 6 to 11 Years | 50 (66.7%) | 30 (100.0%) |
| 12 to 14 Years | 0 (0.0%) | 0 (0.0%) |
| 15 Years | 0 (0.0%) | 0 (0.0%) |
| 16 and 17 Years | 0 (0.0%) | 0 (0.0%) |
| 18 to 24 Years | 0 (0.0%) | 0 (0.0%) |
| 25 to 34 Years | 54 (52.4%) | 43 (26.7%) |
| 35 to 44 Years | 0 (0.0%) | 0 (0.0%) |
| 45 to 54 Years | 48 (57.1%) | 20 (42.5%) |
| 55 to 64 Years | 51 (66.2%) | 112 (67.1%) |
| 65 to 74 Years | 0 (0.0%) | 53 (67.1%) |
| 75 Years and over | 23 (51.1%) | 23 (51.1%) |
| Total | 258 (51.9%) | 281 (47.8%) |
Income Above Poverty by Sex and Age in Parcelas Viejas Borinquen
According to the poverty statistics in Parcelas Viejas Borinquen, males aged 35 to 44 years and females aged 35 to 44 years are the age groups that are most secure financially, with 100.0% of males and 100.0% of females in these age groups living above the poverty line.
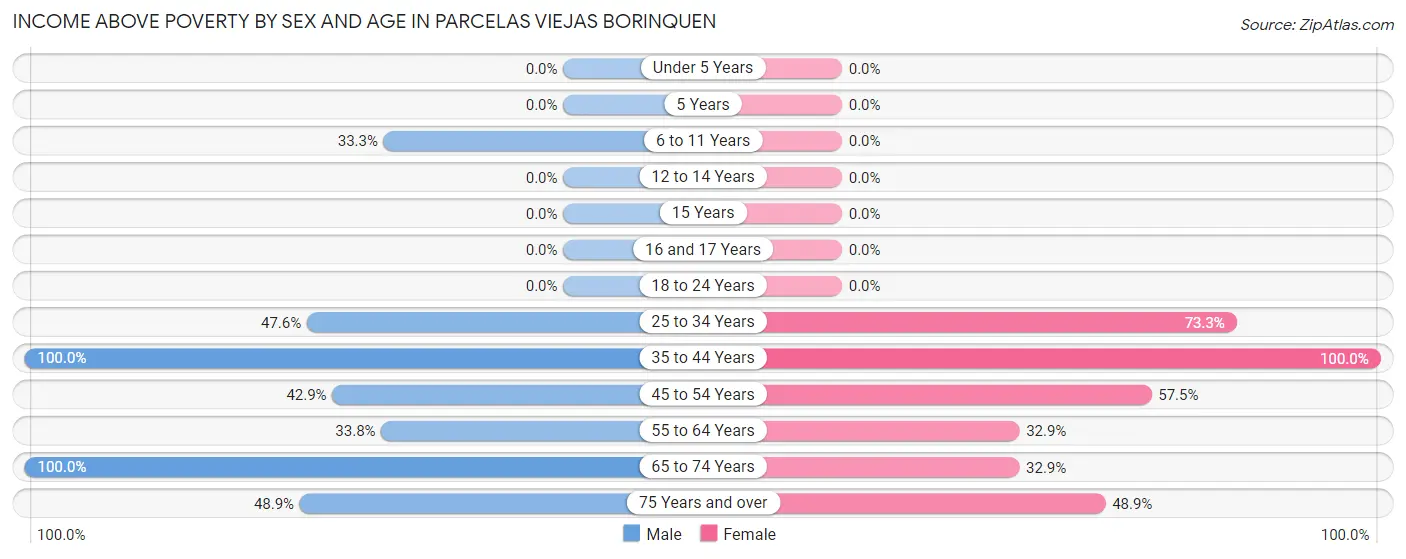
| Age Bracket | Male | Female |
| Under 5 Years | 0 (0.0%) | 0 (0.0%) |
| 5 Years | 0 (0.0%) | 0 (0.0%) |
| 6 to 11 Years | 25 (33.3%) | 0 (0.0%) |
| 12 to 14 Years | 0 (0.0%) | 0 (0.0%) |
| 15 Years | 0 (0.0%) | 0 (0.0%) |
| 16 and 17 Years | 0 (0.0%) | 0 (0.0%) |
| 18 to 24 Years | 0 (0.0%) | 0 (0.0%) |
| 25 to 34 Years | 49 (47.6%) | 118 (73.3%) |
| 35 to 44 Years | 45 (100.0%) | 59 (100.0%) |
| 45 to 54 Years | 36 (42.9%) | 27 (57.5%) |
| 55 to 64 Years | 26 (33.8%) | 55 (32.9%) |
| 65 to 74 Years | 36 (100.0%) | 26 (32.9%) |
| 75 Years and over | 22 (48.9%) | 22 (48.9%) |
| Total | 239 (48.1%) | 307 (52.2%) |
Income Below Poverty Among Married-Couple Families in Parcelas Viejas Borinquen
The poverty statistics for married-couple families in Parcelas Viejas Borinquen show that 59.8% or 73 of the total 122 families live below the poverty line. Families with 1 or 2 children have the highest poverty rate of 100.0%, comprising of 11 families. On the other hand, families with no children have the lowest poverty rate of 55.9%, which includes 62 families.
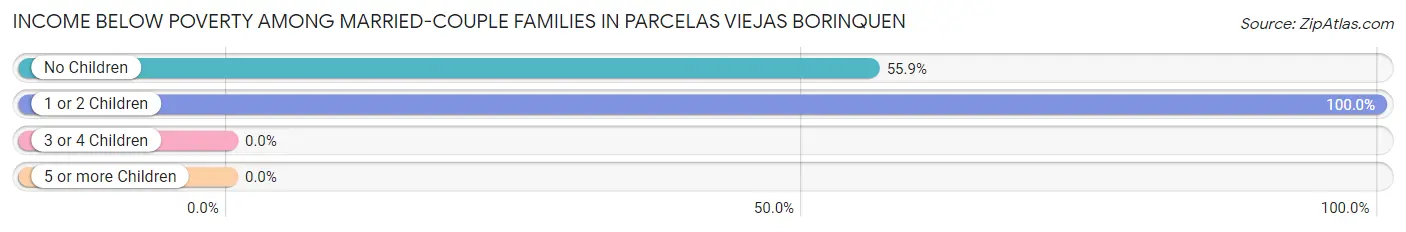
| Children | Above Poverty | Below Poverty |
| No Children | 49 (44.1%) | 62 (55.9%) |
| 1 or 2 Children | 0 (0.0%) | 11 (100.0%) |
| 3 or 4 Children | 0 (0.0%) | 0 (0.0%) |
| 5 or more Children | 0 (0.0%) | 0 (0.0%) |
| Total | 49 (40.2%) | 73 (59.8%) |
Income Below Poverty Among Single-Parent Households in Parcelas Viejas Borinquen
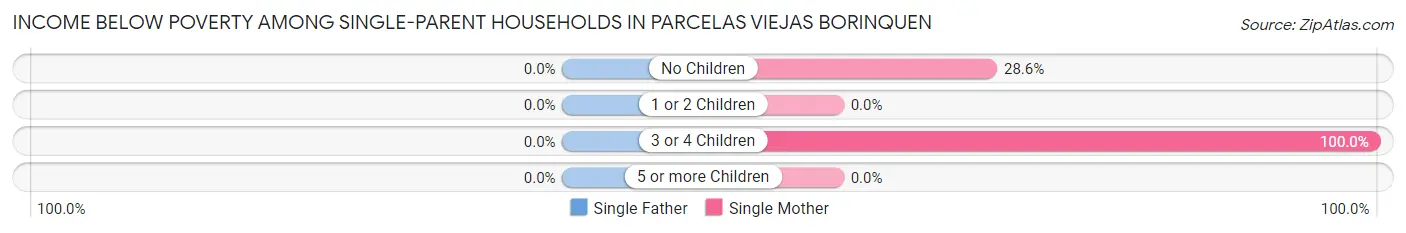
| Children | Single Father | Single Mother |
| No Children | 0 (0.0%) | 22 (28.6%) |
| 1 or 2 Children | 0 (0.0%) | 0 (0.0%) |
| 3 or 4 Children | 0 (0.0%) | 42 (100.0%) |
| 5 or more Children | 0 (0.0%) | 0 (0.0%) |
| Total | 0 (0.0%) | 64 (45.4%) |
Income Below Poverty Among Married-Couple vs Single-Parent Households in Parcelas Viejas Borinquen
The poverty data for Parcelas Viejas Borinquen shows that 73 of the married-couple family households (59.8%) and 64 of the single-parent households (45.4%) are living below the poverty level. Within the married-couple family households, those with 1 or 2 children have the highest poverty rate, with 11 households (100.0%) falling below the poverty line. Among the single-parent households, those with 3 or 4 children have the highest poverty rate, with 42 household (100.0%) living below poverty.
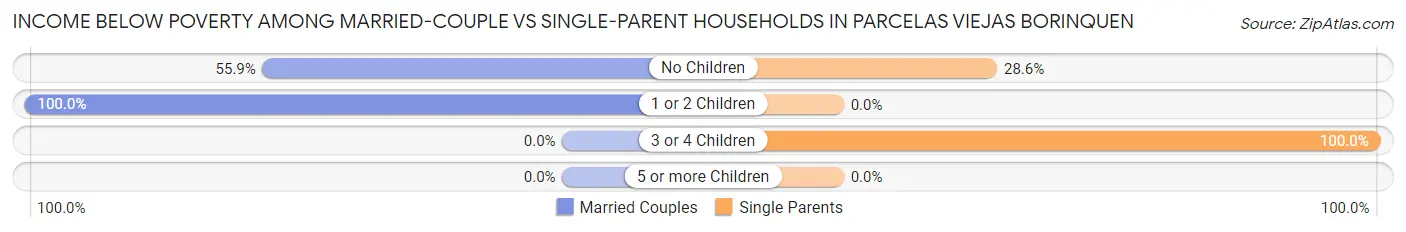
| Children | Married-Couple Families | Single-Parent Households |
| No Children | 62 (55.9%) | 22 (28.6%) |
| 1 or 2 Children | 11 (100.0%) | 0 (0.0%) |
| 3 or 4 Children | 0 (0.0%) | 42 (100.0%) |
| 5 or more Children | 0 (0.0%) | 0 (0.0%) |
| Total | 73 (59.8%) | 64 (45.4%) |
Race in Parcelas Viejas Borinquen
The most populous races in Parcelas Viejas Borinquen are Hispanic or Latino (1,085 | 100.0%), White / Caucasian (592 | 54.6%), and Two or more Races (172 | 15.9%).
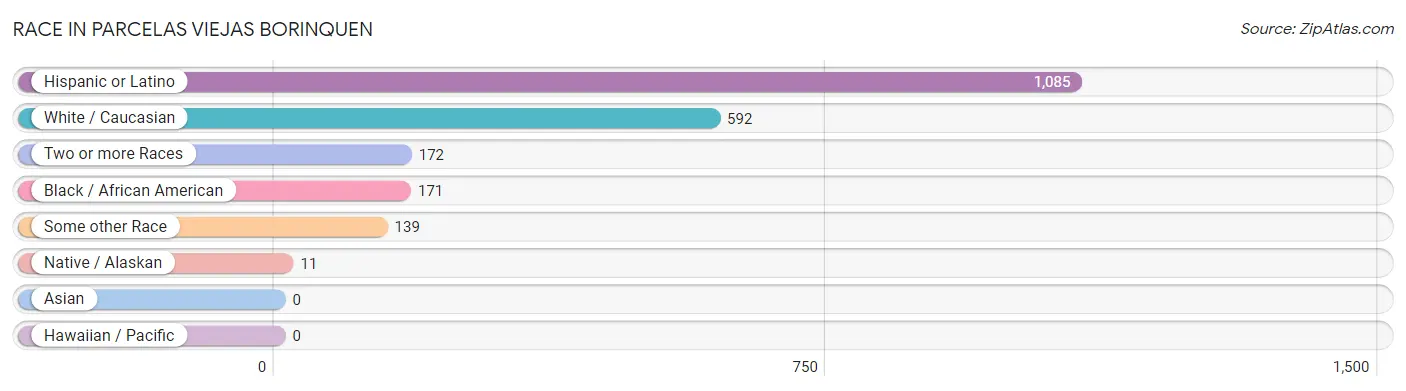
| Race | # Population | % Population |
| Asian | 0 | 0.0% |
| Black / African American | 171 | 15.8% |
| Hawaiian / Pacific | 0 | 0.0% |
| Hispanic or Latino | 1,085 | 100.0% |
| Native / Alaskan | 11 | 1.0% |
| White / Caucasian | 592 | 54.6% |
| Two or more Races | 172 | 15.9% |
| Some other Race | 139 | 12.8% |
| Total | 1,085 | 100.0% |
Ancestry in Parcelas Viejas Borinquen
The most populous ancestries reported in Parcelas Viejas Borinquen are Puerto Rican (1,083 | 99.8%), American (12 | 1.1%), Cuban (1 | 0.1%), and Mexican (1 | 0.1%), together accounting for 101.1% of all Parcelas Viejas Borinquen residents.
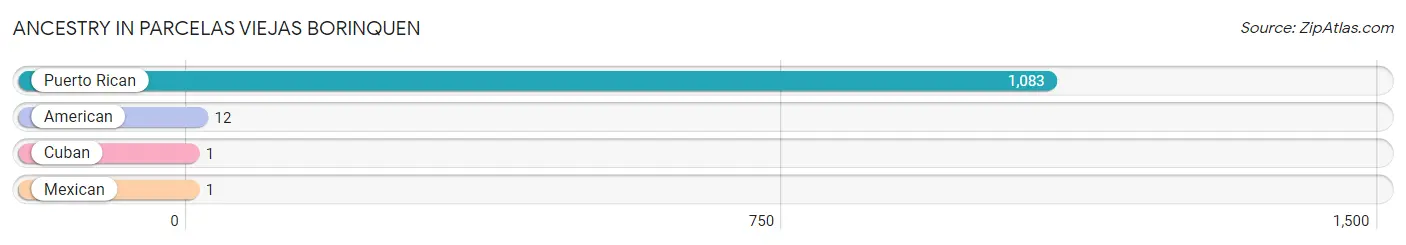
| Ancestry | # Population | % Population |
| American | 12 | 1.1% |
| Cuban | 1 | 0.1% |
| Mexican | 1 | 0.1% |
| Puerto Rican | 1,083 | 99.8% | View All 4 Rows |
Immigrants in Parcelas Viejas Borinquen

| Immigration Origin | # Population | % Population | View All 0 Rows |
Sex and Age in Parcelas Viejas Borinquen
Sex and Age in Parcelas Viejas Borinquen
The most populous age groups in Parcelas Viejas Borinquen are 5 to 9 Years (75 | 15.1%) for men and 25 to 29 Years (160 | 27.2%) for women.
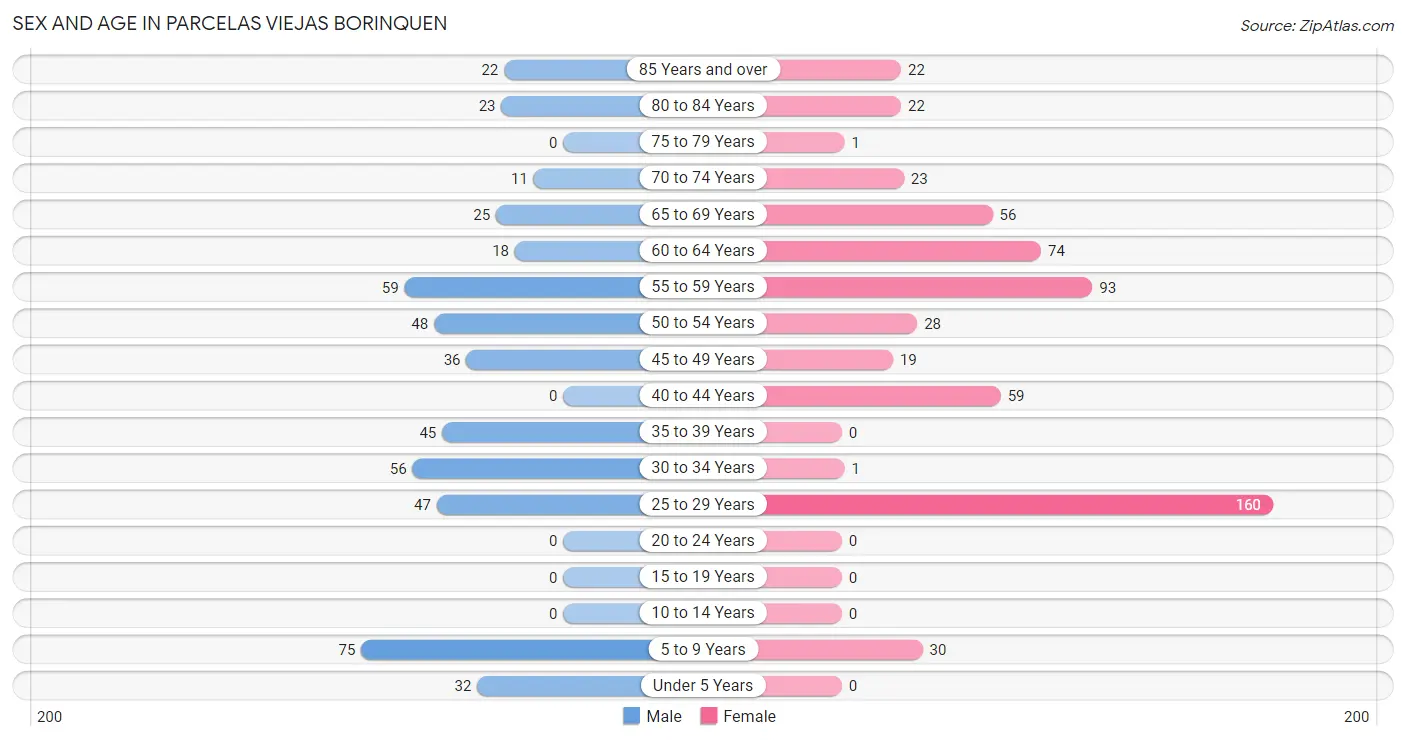
| Age Bracket | Male | Female |
| Under 5 Years | 32 (6.4%) | 0 (0.0%) |
| 5 to 9 Years | 75 (15.1%) | 30 (5.1%) |
| 10 to 14 Years | 0 (0.0%) | 0 (0.0%) |
| 15 to 19 Years | 0 (0.0%) | 0 (0.0%) |
| 20 to 24 Years | 0 (0.0%) | 0 (0.0%) |
| 25 to 29 Years | 47 (9.5%) | 160 (27.2%) |
| 30 to 34 Years | 56 (11.3%) | 1 (0.2%) |
| 35 to 39 Years | 45 (9.0%) | 0 (0.0%) |
| 40 to 44 Years | 0 (0.0%) | 59 (10.0%) |
| 45 to 49 Years | 36 (7.2%) | 19 (3.2%) |
| 50 to 54 Years | 48 (9.7%) | 28 (4.8%) |
| 55 to 59 Years | 59 (11.9%) | 93 (15.8%) |
| 60 to 64 Years | 18 (3.6%) | 74 (12.6%) |
| 65 to 69 Years | 25 (5.0%) | 56 (9.5%) |
| 70 to 74 Years | 11 (2.2%) | 23 (3.9%) |
| 75 to 79 Years | 0 (0.0%) | 1 (0.2%) |
| 80 to 84 Years | 23 (4.6%) | 22 (3.7%) |
| 85 Years and over | 22 (4.4%) | 22 (3.7%) |
| Total | 497 (100.0%) | 588 (100.0%) |
Families and Households in Parcelas Viejas Borinquen
Median Family Size in Parcelas Viejas Borinquen
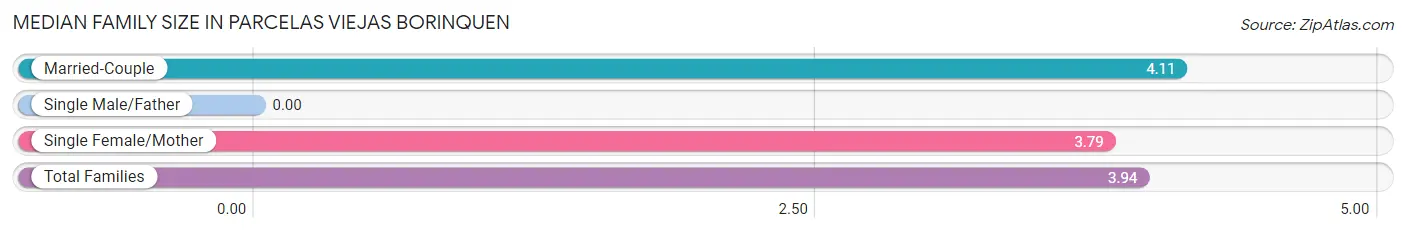
| Family Type | # Families | Family Size |
| Married-Couple | 122 (46.4%) | 4.11 |
| Single Male/Father | 0 (0.0%) | - |
| Single Female/Mother | 141 (53.6%) | 3.79 |
| Total Families | 263 (100.0%) | 3.94 |
Median Household Size in Parcelas Viejas Borinquen
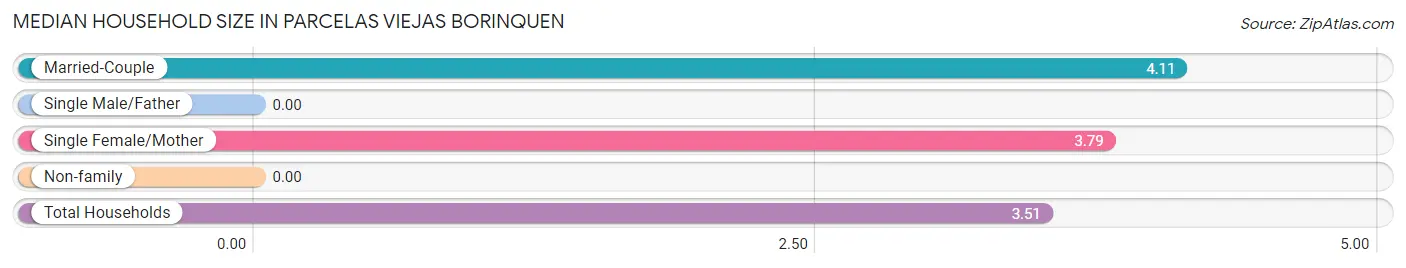
| Household Type | # Households | Household Size |
| Married-Couple | 122 (39.6%) | 4.11 |
| Single Male/Father | 0 (0.0%) | - |
| Single Female/Mother | 141 (45.8%) | 3.79 |
| Non-family | 45 (14.6%) | - |
| Total Households | 308 (100.0%) | 3.51 |
Household Size by Marriage Status in Parcelas Viejas Borinquen
Out of a total of 308 households in Parcelas Viejas Borinquen, 263 (85.4%) are family households, while 45 (14.6%) are nonfamily households. The most numerous type of family households are 4-person households, comprising 113, and the most common type of nonfamily households are 1-person households, comprising 45.
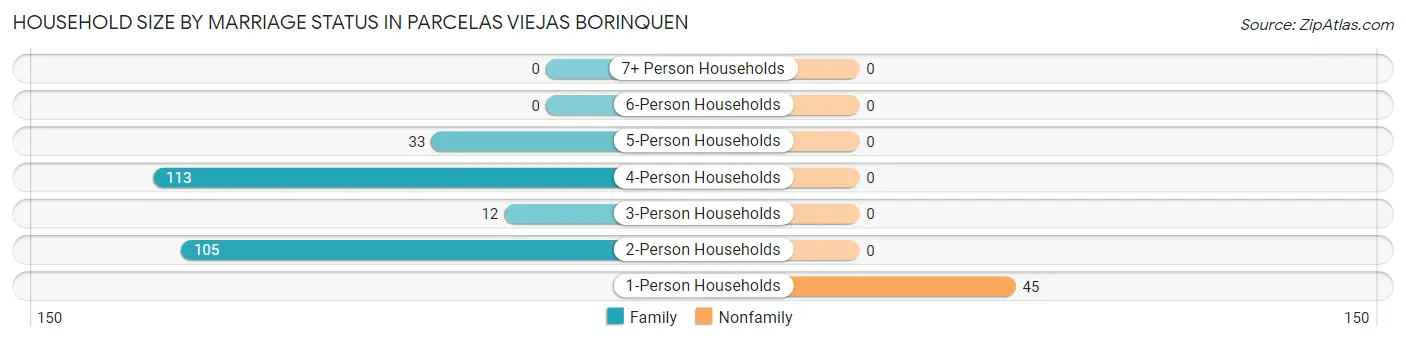
| Household Size | Family Households | Nonfamily Households |
| 1-Person Households | - | 45 (14.6%) |
| 2-Person Households | 105 (34.1%) | 0 (0.0%) |
| 3-Person Households | 12 (3.9%) | 0 (0.0%) |
| 4-Person Households | 113 (36.7%) | 0 (0.0%) |
| 5-Person Households | 33 (10.7%) | 0 (0.0%) |
| 6-Person Households | 0 (0.0%) | 0 (0.0%) |
| 7+ Person Households | 0 (0.0%) | 0 (0.0%) |
| Total | 263 (85.4%) | 45 (14.6%) |
Female Fertility in Parcelas Viejas Borinquen
Fertility by Age in Parcelas Viejas Borinquen
| Age Bracket | Women with Births | Births / 1,000 Women |
| 15 to 19 years | 0 (0.0%) | 0.0 |
| 20 to 34 years | 0 (0.0%) | 0.0 |
| 35 to 50 years | 0 (0.0%) | 0.0 |
| Total | 0 (0.0%) | 0.0 |
Fertility by Age by Marriage Status in Parcelas Viejas Borinquen
| Age Bracket | Married | Unmarried |
| 15 to 19 years | 0 (0.0%) | 0 (0.0%) |
| 20 to 34 years | 0 (0.0%) | 0 (0.0%) |
| 35 to 50 years | 0 (0.0%) | 0 (0.0%) |
| Total | 0 (0.0%) | 0 (0.0%) |
Fertility by Education in Parcelas Viejas Borinquen
| Educational Attainment | Women with Births | Births / 1,000 Women |
| Less than High School | 0 (0.0%) | 0.0 |
| High School Diploma | 0 (0.0%) | 0.0 |
| College or Associate's Degree | 0 (0.0%) | 0.0 |
| Bachelor's Degree | 0 (0.0%) | 0.0 |
| Graduate Degree | 0 (0.0%) | 0.0 |
| Total | 0 (0.0%) | 0.0 |
Fertility by Education by Marriage Status in Parcelas Viejas Borinquen
| Educational Attainment | Married | Unmarried |
| Less than High School | 0 (0.0%) | 0 (0.0%) |
| High School Diploma | 0 (0.0%) | 0 (0.0%) |
| College or Associate's Degree | 0 (0.0%) | 0 (0.0%) |
| Bachelor's Degree | 0 (0.0%) | 0 (0.0%) |
| Graduate Degree | 0 (0.0%) | 0 (0.0%) |
| Total | 0 (0.0%) | 0 (0.0%) |
Employment Characteristics in Parcelas Viejas Borinquen
Employment by Class of Employer in Parcelas Viejas Borinquen
Among the 231 employed individuals in Parcelas Viejas Borinquen, private company employees (190 | 82.3%), state government employees (23 | 10.0%), and not-for-profit organizations (18 | 7.8%) make up the most common classes of employment.
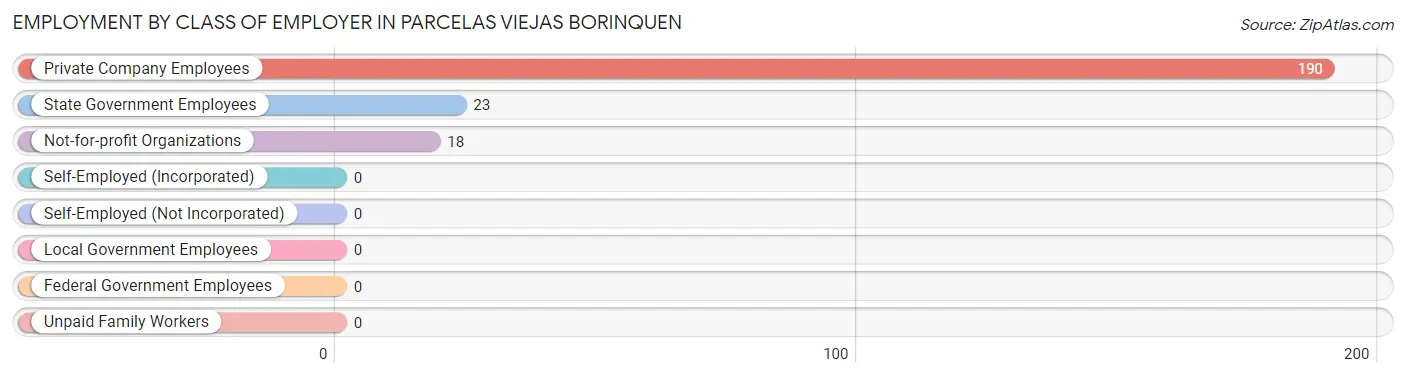
| Employer Class | # Employees | % Employees |
| Private Company Employees | 190 | 82.3% |
| Self-Employed (Incorporated) | 0 | 0.0% |
| Self-Employed (Not Incorporated) | 0 | 0.0% |
| Not-for-profit Organizations | 18 | 7.8% |
| Local Government Employees | 0 | 0.0% |
| State Government Employees | 23 | 10.0% |
| Federal Government Employees | 0 | 0.0% |
| Unpaid Family Workers | 0 | 0.0% |
| Total | 231 | 100.0% |
Employment Status by Age in Parcelas Viejas Borinquen
According to the labor force statistics for Parcelas Viejas Borinquen, out of the total population over 16 years of age (948), 31.0% or 294 individuals are in the labor force, with 21.4% or 63 of them unemployed. The age group with the highest labor force participation rate is 35 to 44 years, with 78.8% or 82 individuals in the labor force. Within the labor force, the 30 to 34 years age range has the highest percentage of unemployed individuals, with 100.0% or 18 of them being unemployed.
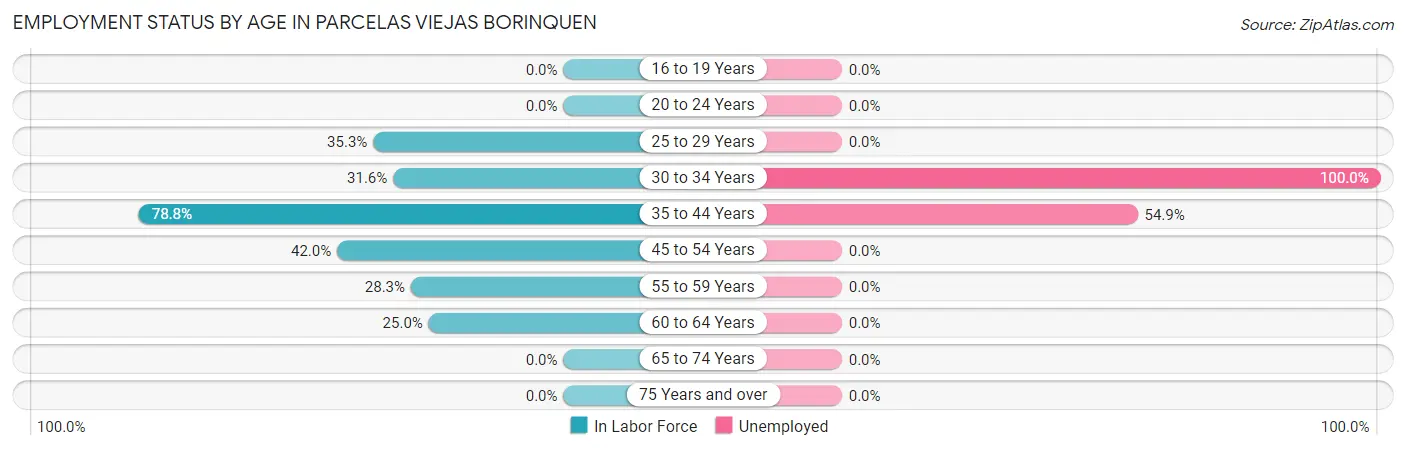
| Age Bracket | In Labor Force | Unemployed |
| 16 to 19 Years | 0 (0.0%) | 0 (0.0%) |
| 20 to 24 Years | 0 (0.0%) | 0 (0.0%) |
| 25 to 29 Years | 73 (35.3%) | 0 (0.0%) |
| 30 to 34 Years | 18 (31.6%) | 18 (100.0%) |
| 35 to 44 Years | 82 (78.8%) | 45 (54.9%) |
| 45 to 54 Years | 55 (42.0%) | 0 (0.0%) |
| 55 to 59 Years | 43 (28.3%) | 0 (0.0%) |
| 60 to 64 Years | 23 (25.0%) | 0 (0.0%) |
| 65 to 74 Years | 0 (0.0%) | 0 (0.0%) |
| 75 Years and over | 0 (0.0%) | 0 (0.0%) |
| Total | 294 (31.0%) | 63 (21.4%) |
Employment Status by Educational Attainment in Parcelas Viejas Borinquen
According to labor force statistics for Parcelas Viejas Borinquen, 39.6% of individuals (294) out of the total population between 25 and 64 years of age (743) are in the labor force, with 21.4% or 63 of them being unemployed. The group with the highest labor force participation rate are those with the educational attainment of high school diploma, with 49.7% or 154 individuals in the labor force. Within the labor force, individuals with less than high school education have the highest percentage of unemployment, with 45.9% or 45 of them being unemployed.
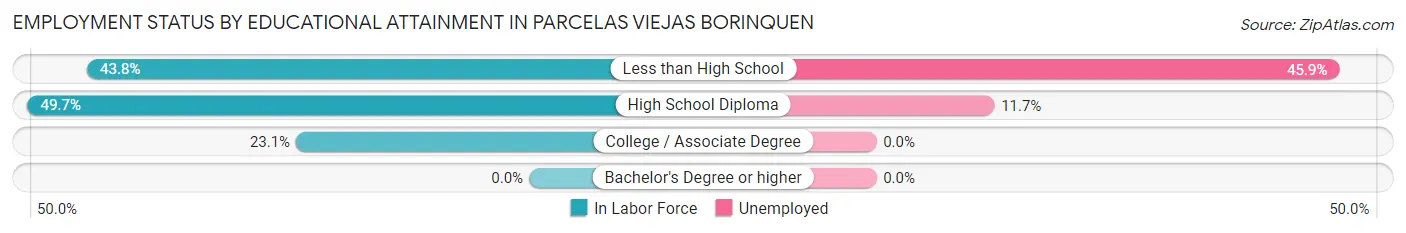
| Educational Attainment | In Labor Force | Unemployed |
| Less than High School | 98 (43.8%) | 103 (45.9%) |
| High School Diploma | 154 (49.7%) | 36 (11.7%) |
| College / Associate Degree | 42 (23.1%) | 0 (0.0%) |
| Bachelor's Degree or higher | 0 (0.0%) | 0 (0.0%) |
| Total | 294 (39.6%) | 159 (21.4%) |
Employment Occupations by Sex in Parcelas Viejas Borinquen
Management, Business, Science and Arts Occupations
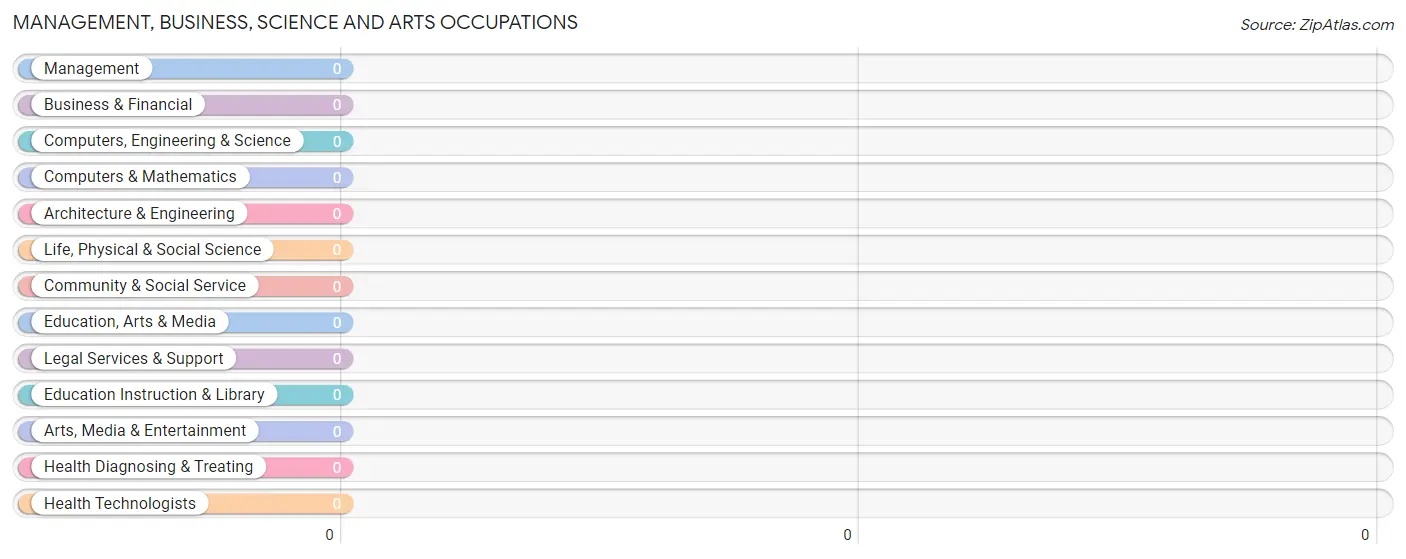
Management, Business, Science and Arts Occupations by Sex
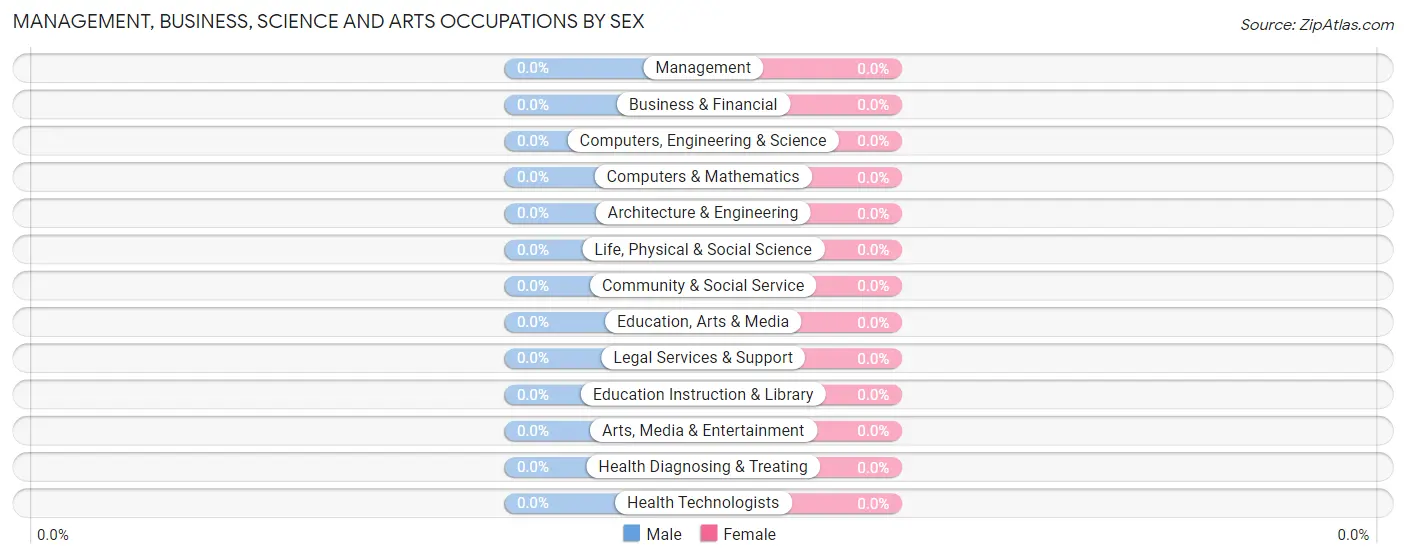
| Occupation | Male | Female |
| Management | 0 (0.0%) | 0 (0.0%) |
| Business & Financial | 0 (0.0%) | 0 (0.0%) |
| Computers, Engineering & Science | 0 (0.0%) | 0 (0.0%) |
| Computers & Mathematics | 0 (0.0%) | 0 (0.0%) |
| Architecture & Engineering | 0 (0.0%) | 0 (0.0%) |
| Life, Physical & Social Science | 0 (0.0%) | 0 (0.0%) |
| Community & Social Service | 0 (0.0%) | 0 (0.0%) |
| Education, Arts & Media | 0 (0.0%) | 0 (0.0%) |
| Legal Services & Support | 0 (0.0%) | 0 (0.0%) |
| Education Instruction & Library | 0 (0.0%) | 0 (0.0%) |
| Arts, Media & Entertainment | 0 (0.0%) | 0 (0.0%) |
| Health Diagnosing & Treating | 0 (0.0%) | 0 (0.0%) |
| Health Technologists | 0 (0.0%) | 0 (0.0%) |
| Total (Category) | 0 (0.0%) | 0 (0.0%) |
| Total (Overall) | 93 (40.3%) | 138 (59.7%) |
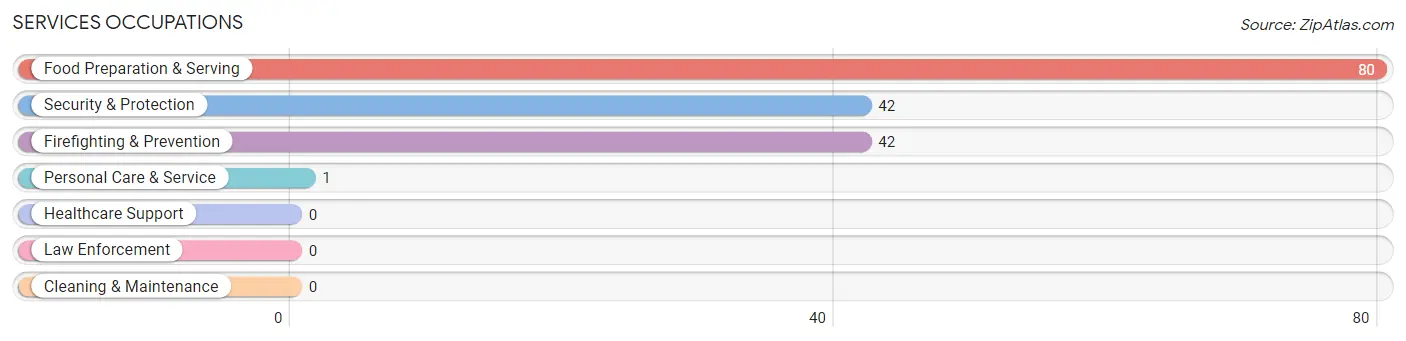
Services Occupations
The most common Services occupations in Parcelas Viejas Borinquen are Food Preparation & Serving (80 | 34.6%), Security & Protection (42 | 18.2%), Firefighting & Prevention (42 | 18.2%), and Personal Care & Service (1 | 0.4%).
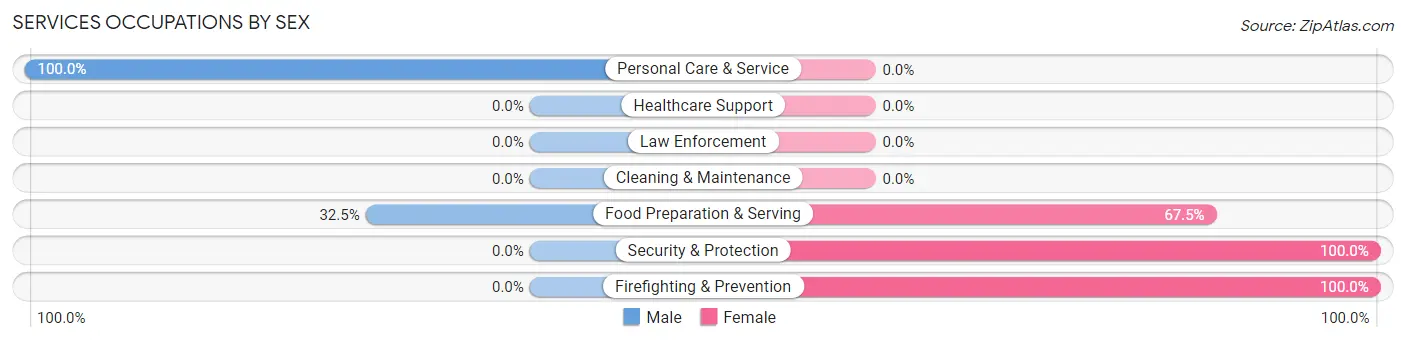
Services Occupations by Sex
Within the Services occupations in Parcelas Viejas Borinquen, the most male-oriented occupations are Personal Care & Service (100.0%), and Food Preparation & Serving (32.5%), while the most female-oriented occupations are Security & Protection (100.0%), Firefighting & Prevention (100.0%), and Food Preparation & Serving (67.5%).
| Occupation | Male | Female |
| Healthcare Support | 0 (0.0%) | 0 (0.0%) |
| Security & Protection | 0 (0.0%) | 42 (100.0%) |
| Firefighting & Prevention | 0 (0.0%) | 42 (100.0%) |
| Law Enforcement | 0 (0.0%) | 0 (0.0%) |
| Food Preparation & Serving | 26 (32.5%) | 54 (67.5%) |
| Cleaning & Maintenance | 0 (0.0%) | 0 (0.0%) |
| Personal Care & Service | 1 (100.0%) | 0 (0.0%) |
| Total (Category) | 27 (22.0%) | 96 (78.0%) |
| Total (Overall) | 93 (40.3%) | 138 (59.7%) |
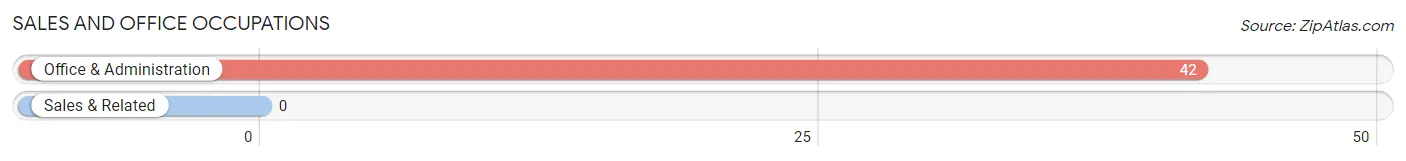
Sales and Office Occupations
The most common Sales and Office occupations in Parcelas Viejas Borinquen are , and Office & Administration (42 | 18.2%).
Sales and Office Occupations by Sex
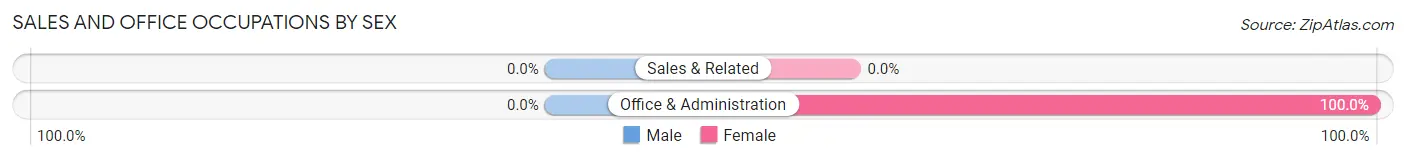
| Occupation | Male | Female |
| Sales & Related | 0 (0.0%) | 0 (0.0%) |
| Office & Administration | 0 (0.0%) | 42 (100.0%) |
| Total (Category) | 0 (0.0%) | 42 (100.0%) |
| Total (Overall) | 93 (40.3%) | 138 (59.7%) |
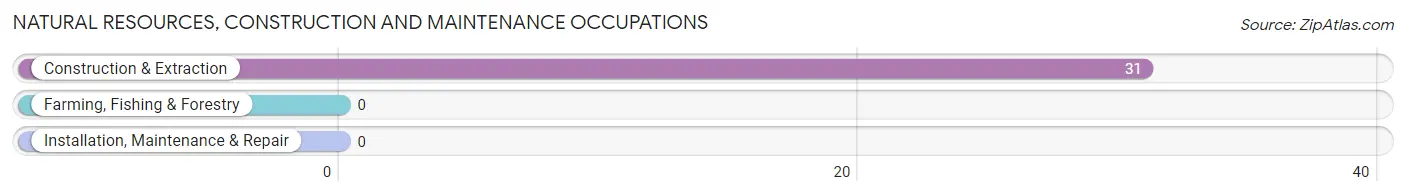
Natural Resources, Construction and Maintenance Occupations
The most common Natural Resources, Construction and Maintenance occupations in Parcelas Viejas Borinquen are , and Construction & Extraction (31 | 13.4%).
Natural Resources, Construction and Maintenance Occupations by Sex
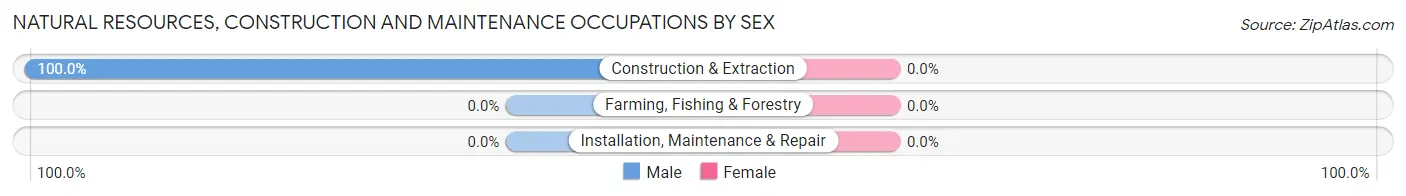
| Occupation | Male | Female |
| Farming, Fishing & Forestry | 0 (0.0%) | 0 (0.0%) |
| Construction & Extraction | 31 (100.0%) | 0 (0.0%) |
| Installation, Maintenance & Repair | 0 (0.0%) | 0 (0.0%) |
| Total (Category) | 31 (100.0%) | 0 (0.0%) |
| Total (Overall) | 93 (40.3%) | 138 (59.7%) |
Production, Transportation and Moving Occupations
The most common Production, Transportation and Moving occupations in Parcelas Viejas Borinquen are , and Production (35 | 15.1%).
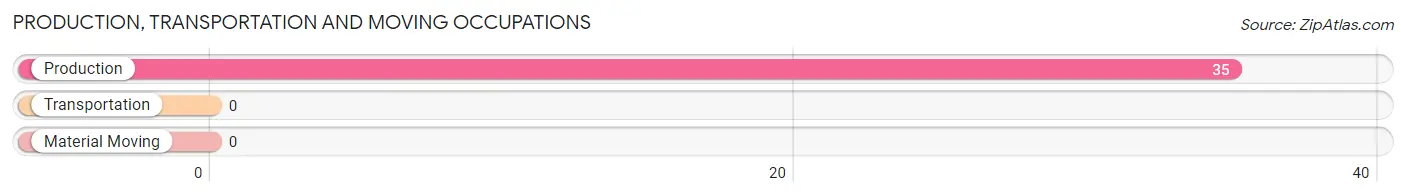
Production, Transportation and Moving Occupations by Sex
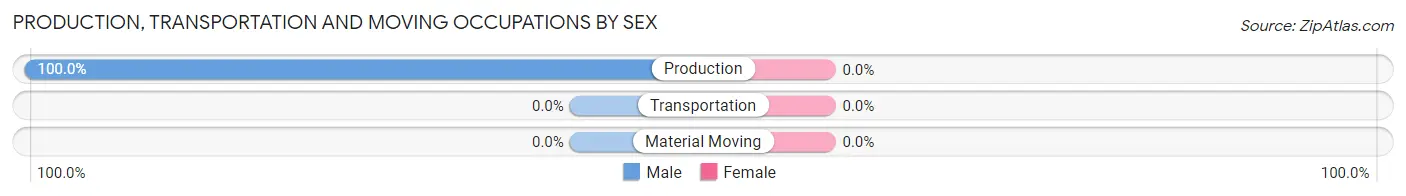
| Occupation | Male | Female |
| Production | 35 (100.0%) | 0 (0.0%) |
| Transportation | 0 (0.0%) | 0 (0.0%) |
| Material Moving | 0 (0.0%) | 0 (0.0%) |
| Total (Category) | 35 (100.0%) | 0 (0.0%) |
| Total (Overall) | 93 (40.3%) | 138 (59.7%) |
Employment Industries by Sex in Parcelas Viejas Borinquen
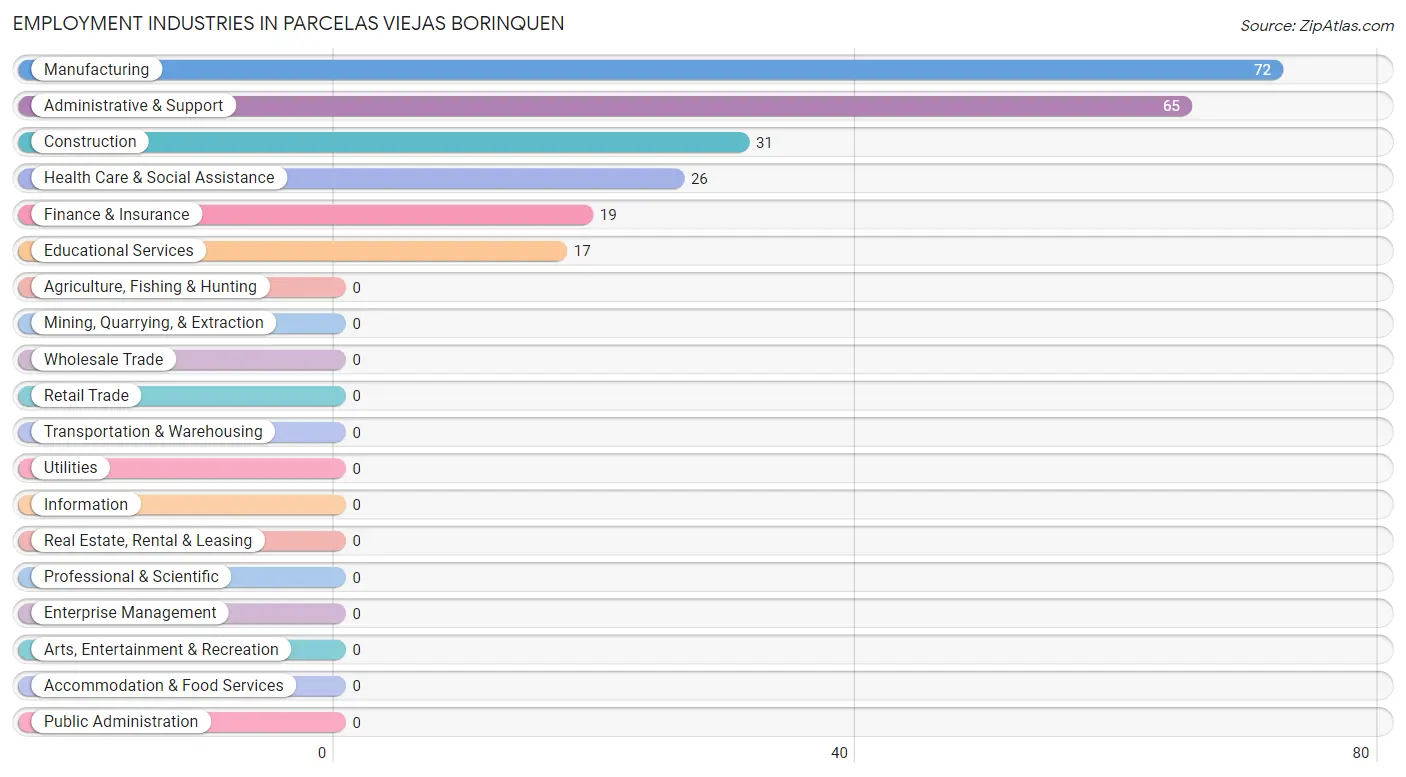
Employment Industries in Parcelas Viejas Borinquen
The major employment industries in Parcelas Viejas Borinquen include Manufacturing (72 | 31.2%), Administrative & Support (65 | 28.1%), Construction (31 | 13.4%), Health Care & Social Assistance (26 | 11.3%), and Finance & Insurance (19 | 8.2%).
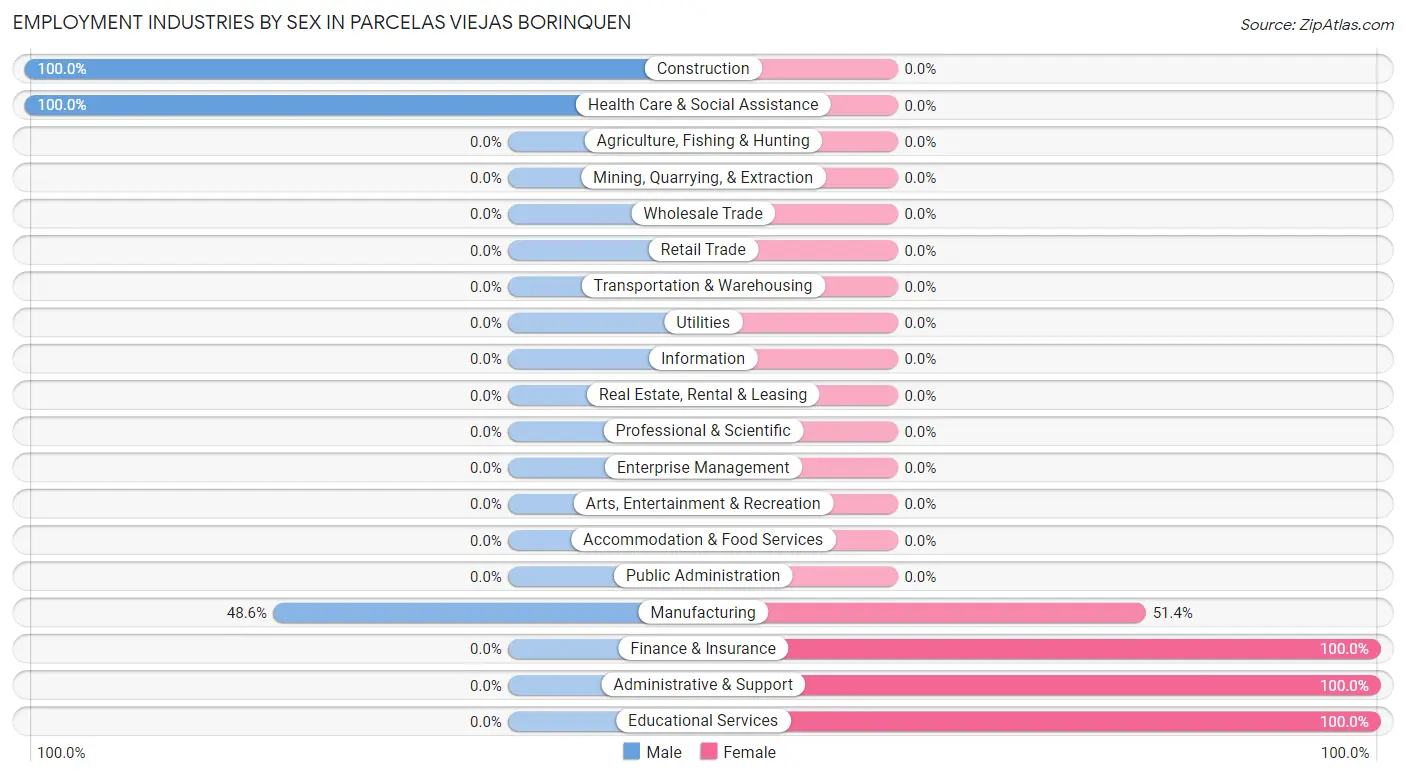
Employment Industries by Sex in Parcelas Viejas Borinquen
The Parcelas Viejas Borinquen industries that see more men than women are Construction (100.0%), Health Care & Social Assistance (100.0%), and Manufacturing (48.6%), whereas the industries that tend to have a higher number of women are Finance & Insurance (100.0%), Administrative & Support (100.0%), and Educational Services (100.0%).
| Industry | Male | Female |
| Agriculture, Fishing & Hunting | 0 (0.0%) | 0 (0.0%) |
| Mining, Quarrying, & Extraction | 0 (0.0%) | 0 (0.0%) |
| Construction | 31 (100.0%) | 0 (0.0%) |
| Manufacturing | 35 (48.6%) | 37 (51.4%) |
| Wholesale Trade | 0 (0.0%) | 0 (0.0%) |
| Retail Trade | 0 (0.0%) | 0 (0.0%) |
| Transportation & Warehousing | 0 (0.0%) | 0 (0.0%) |
| Utilities | 0 (0.0%) | 0 (0.0%) |
| Information | 0 (0.0%) | 0 (0.0%) |
| Finance & Insurance | 0 (0.0%) | 19 (100.0%) |
| Real Estate, Rental & Leasing | 0 (0.0%) | 0 (0.0%) |
| Professional & Scientific | 0 (0.0%) | 0 (0.0%) |
| Enterprise Management | 0 (0.0%) | 0 (0.0%) |
| Administrative & Support | 0 (0.0%) | 65 (100.0%) |
| Educational Services | 0 (0.0%) | 17 (100.0%) |
| Health Care & Social Assistance | 26 (100.0%) | 0 (0.0%) |
| Arts, Entertainment & Recreation | 0 (0.0%) | 0 (0.0%) |
| Accommodation & Food Services | 0 (0.0%) | 0 (0.0%) |
| Public Administration | 0 (0.0%) | 0 (0.0%) |
| Total | 93 (40.3%) | 138 (59.7%) |
Education in Parcelas Viejas Borinquen
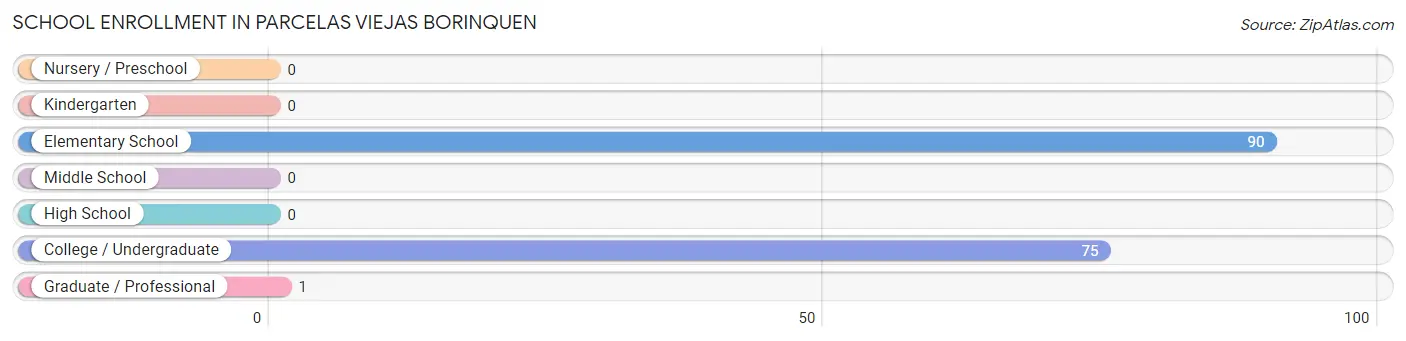
School Enrollment in Parcelas Viejas Borinquen
The most common levels of schooling among the 166 students in Parcelas Viejas Borinquen are elementary school (90 | 54.2%), college / undergraduate (75 | 45.2%), and graduate / professional (1 | 0.6%).
| School Level | # Students | % Students |
| Nursery / Preschool | 0 | 0.0% |
| Kindergarten | 0 | 0.0% |
| Elementary School | 90 | 54.2% |
| Middle School | 0 | 0.0% |
| High School | 0 | 0.0% |
| College / Undergraduate | 75 | 45.2% |
| Graduate / Professional | 1 | 0.6% |
| Total | 166 | 100.0% |
School Enrollment by Age by Funding Source in Parcelas Viejas Borinquen
Out of a total of 166 students who are enrolled in schools in Parcelas Viejas Borinquen, 76 (45.8%) attend a private institution, while the remaining 90 (54.2%) are enrolled in public schools. The age group of 25 to 34 year olds has the highest likelihood of being enrolled in private schools, with 75 (100.0% in the age bracket) enrolled. Conversely, the age group of 5 to 9 year old has the lowest likelihood of being enrolled in a private school, with 90 (100.0% in the age bracket) attending a public institution.
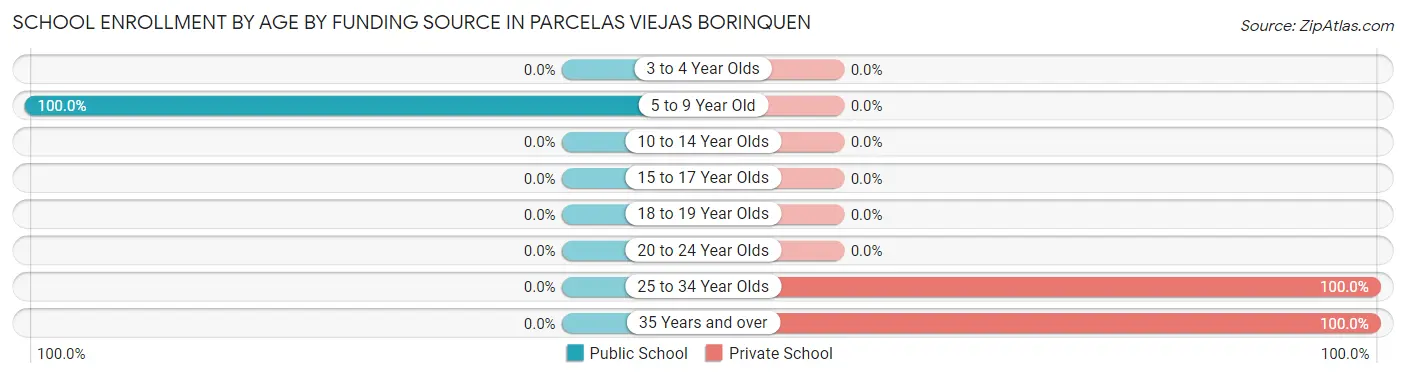
| Age Bracket | Public School | Private School |
| 3 to 4 Year Olds | 0 (0.0%) | 0 (0.0%) |
| 5 to 9 Year Old | 90 (100.0%) | 0 (0.0%) |
| 10 to 14 Year Olds | 0 (0.0%) | 0 (0.0%) |
| 15 to 17 Year Olds | 0 (0.0%) | 0 (0.0%) |
| 18 to 19 Year Olds | 0 (0.0%) | 0 (0.0%) |
| 20 to 24 Year Olds | 0 (0.0%) | 0 (0.0%) |
| 25 to 34 Year Olds | 0 (0.0%) | 75 (100.0%) |
| 35 Years and over | 0 (0.0%) | 1 (100.0%) |
| Total | 90 (54.2%) | 76 (45.8%) |
Educational Attainment by Field of Study in Parcelas Viejas Borinquen
Business (25 | 48.1%), education (16 | 30.8%), physical & health sciences (10 | 19.2%), and arts & humanities (1 | 1.9%) are the most common fields of study among 52 individuals in Parcelas Viejas Borinquen who have obtained a bachelor's degree or higher.
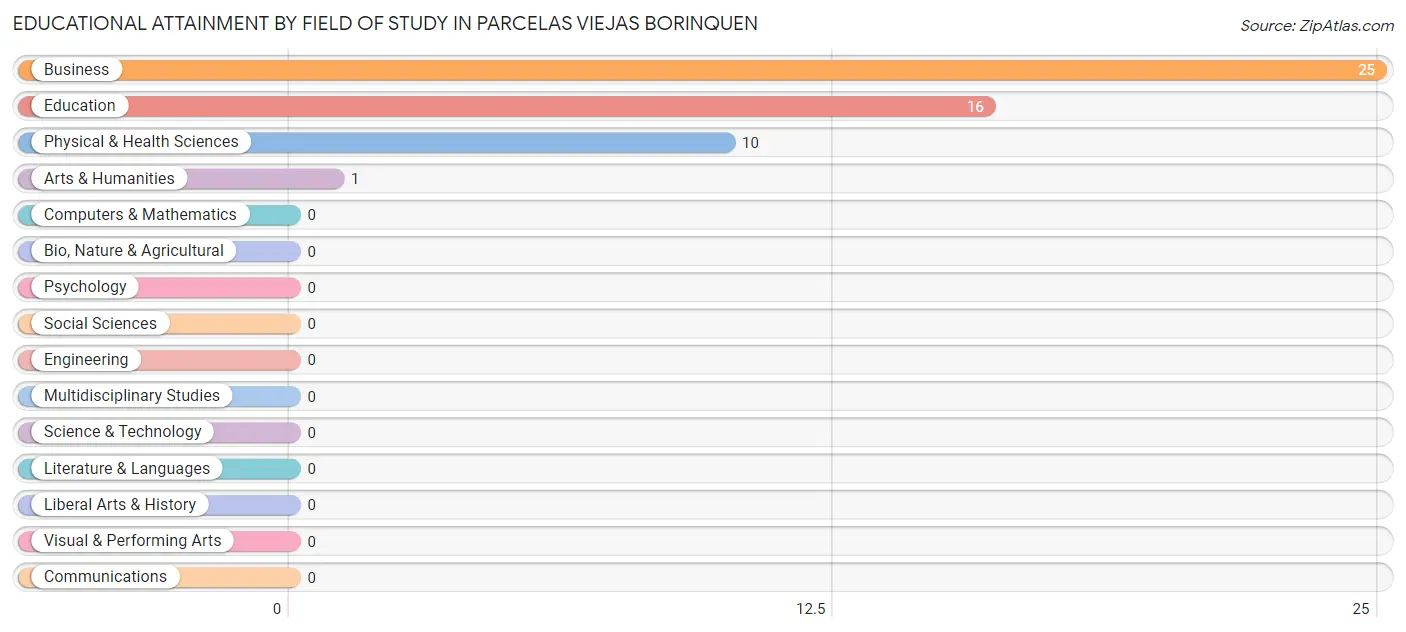
| Field of Study | # Graduates | % Graduates |
| Computers & Mathematics | 0 | 0.0% |
| Bio, Nature & Agricultural | 0 | 0.0% |
| Physical & Health Sciences | 10 | 19.2% |
| Psychology | 0 | 0.0% |
| Social Sciences | 0 | 0.0% |
| Engineering | 0 | 0.0% |
| Multidisciplinary Studies | 0 | 0.0% |
| Science & Technology | 0 | 0.0% |
| Business | 25 | 48.1% |
| Education | 16 | 30.8% |
| Literature & Languages | 0 | 0.0% |
| Liberal Arts & History | 0 | 0.0% |
| Visual & Performing Arts | 0 | 0.0% |
| Communications | 0 | 0.0% |
| Arts & Humanities | 1 | 1.9% |
| Total | 52 | 100.0% |
Transportation & Commute in Parcelas Viejas Borinquen
Vehicle Availability by Sex in Parcelas Viejas Borinquen
The most prevalent vehicle ownership categories in Parcelas Viejas Borinquen are males with 1 vehicle (92, accounting for 100.0%) and females with 1 vehicle (79, making up 66.7%).
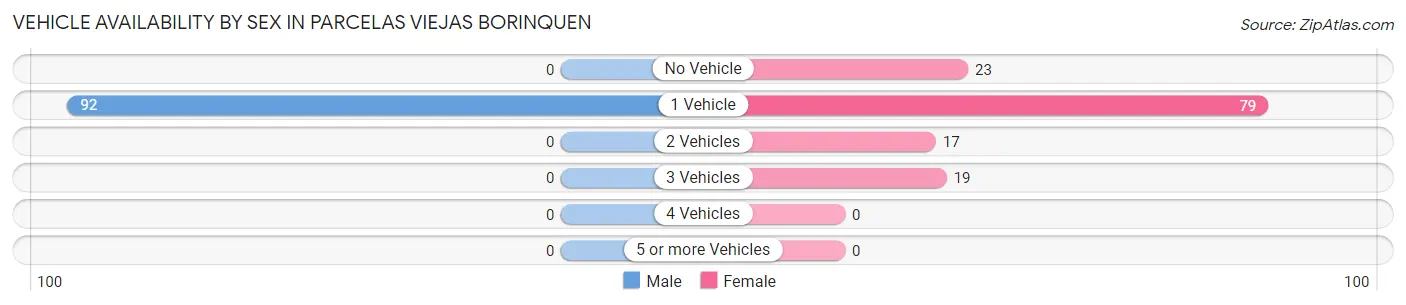
| Vehicles Available | Male | Female |
| No Vehicle | 0 (0.0%) | 23 (16.7%) |
| 1 Vehicle | 92 (100.0%) | 79 (57.3%) |
| 2 Vehicles | 0 (0.0%) | 17 (12.3%) |
| 3 Vehicles | 0 (0.0%) | 19 (13.8%) |
| 4 Vehicles | 0 (0.0%) | 0 (0.0%) |
| 5 or more Vehicles | 0 (0.0%) | 0 (0.0%) |
| Total | 92 (100.0%) | 138 (100.0%) |
Commute Time in Parcelas Viejas Borinquen
The most frequently occuring commute durations in Parcelas Viejas Borinquen are 15 to 19 minutes (72 commuters, 31.2%), 20 to 24 minutes (49 commuters, 21.2%), and 30 to 34 minutes (42 commuters, 18.2%).
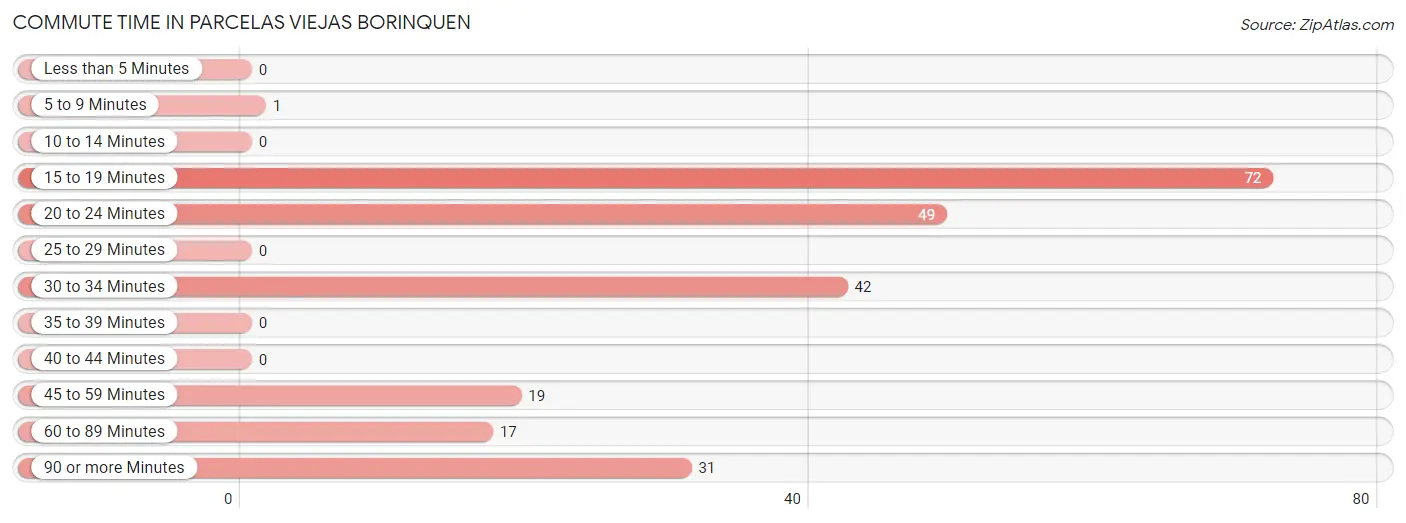
| Commute Time | # Commuters | % Commuters |
| Less than 5 Minutes | 0 | 0.0% |
| 5 to 9 Minutes | 1 | 0.4% |
| 10 to 14 Minutes | 0 | 0.0% |
| 15 to 19 Minutes | 72 | 31.2% |
| 20 to 24 Minutes | 49 | 21.2% |
| 25 to 29 Minutes | 0 | 0.0% |
| 30 to 34 Minutes | 42 | 18.2% |
| 35 to 39 Minutes | 0 | 0.0% |
| 40 to 44 Minutes | 0 | 0.0% |
| 45 to 59 Minutes | 19 | 8.2% |
| 60 to 89 Minutes | 17 | 7.4% |
| 90 or more Minutes | 31 | 13.4% |
Commute Time by Sex in Parcelas Viejas Borinquen
The most common commute times in Parcelas Viejas Borinquen are 15 to 19 minutes (35 commuters, 37.6%) for males and 30 to 34 minutes (42 commuters, 30.4%) for females.
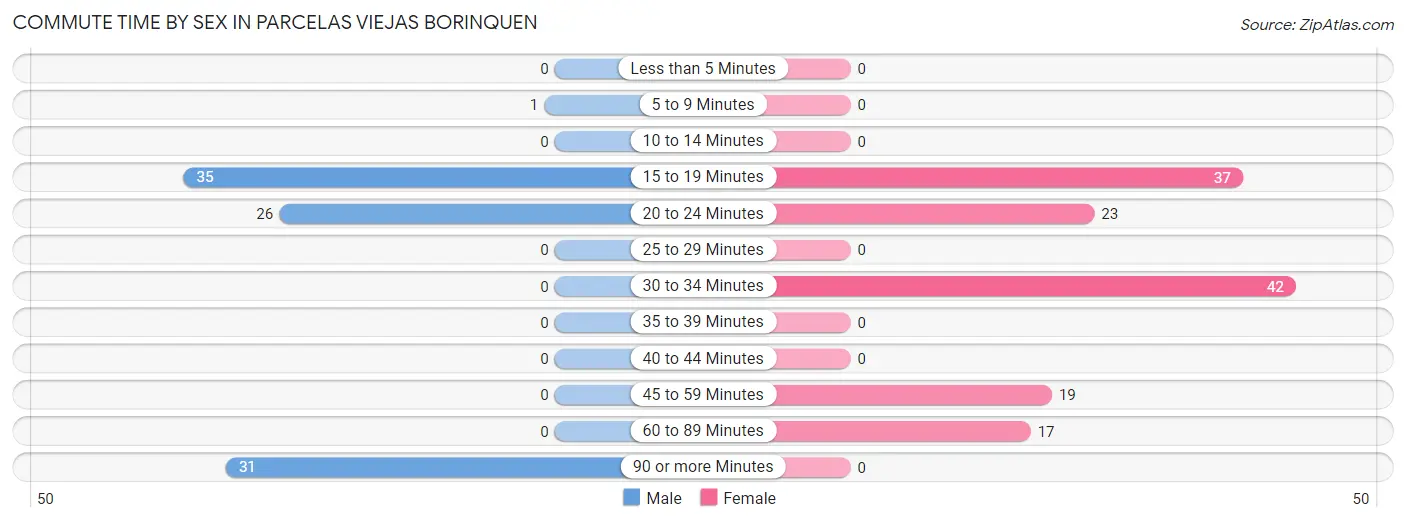
| Commute Time | Male | Female |
| Less than 5 Minutes | 0 (0.0%) | 0 (0.0%) |
| 5 to 9 Minutes | 1 (1.1%) | 0 (0.0%) |
| 10 to 14 Minutes | 0 (0.0%) | 0 (0.0%) |
| 15 to 19 Minutes | 35 (37.6%) | 37 (26.8%) |
| 20 to 24 Minutes | 26 (28.0%) | 23 (16.7%) |
| 25 to 29 Minutes | 0 (0.0%) | 0 (0.0%) |
| 30 to 34 Minutes | 0 (0.0%) | 42 (30.4%) |
| 35 to 39 Minutes | 0 (0.0%) | 0 (0.0%) |
| 40 to 44 Minutes | 0 (0.0%) | 0 (0.0%) |
| 45 to 59 Minutes | 0 (0.0%) | 19 (13.8%) |
| 60 to 89 Minutes | 0 (0.0%) | 17 (12.3%) |
| 90 or more Minutes | 31 (33.3%) | 0 (0.0%) |
Time of Departure to Work by Sex in Parcelas Viejas Borinquen
The most frequent times of departure to work in Parcelas Viejas Borinquen are 12:00 AM to 4:59 AM (66, 71.0%) for males and 12:00 AM to 4:59 AM (79, 57.3%) for females.
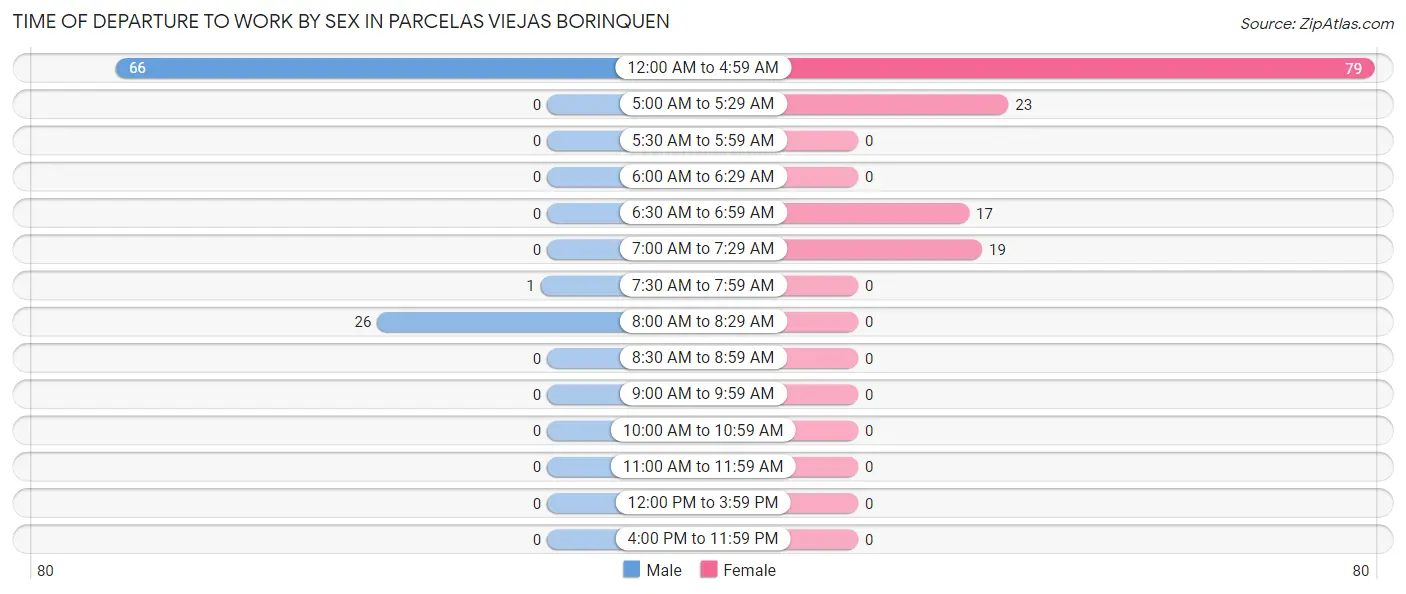
| Time of Departure | Male | Female |
| 12:00 AM to 4:59 AM | 66 (71.0%) | 79 (57.3%) |
| 5:00 AM to 5:29 AM | 0 (0.0%) | 23 (16.7%) |
| 5:30 AM to 5:59 AM | 0 (0.0%) | 0 (0.0%) |
| 6:00 AM to 6:29 AM | 0 (0.0%) | 0 (0.0%) |
| 6:30 AM to 6:59 AM | 0 (0.0%) | 17 (12.3%) |
| 7:00 AM to 7:29 AM | 0 (0.0%) | 19 (13.8%) |
| 7:30 AM to 7:59 AM | 1 (1.1%) | 0 (0.0%) |
| 8:00 AM to 8:29 AM | 26 (28.0%) | 0 (0.0%) |
| 8:30 AM to 8:59 AM | 0 (0.0%) | 0 (0.0%) |
| 9:00 AM to 9:59 AM | 0 (0.0%) | 0 (0.0%) |
| 10:00 AM to 10:59 AM | 0 (0.0%) | 0 (0.0%) |
| 11:00 AM to 11:59 AM | 0 (0.0%) | 0 (0.0%) |
| 12:00 PM to 3:59 PM | 0 (0.0%) | 0 (0.0%) |
| 4:00 PM to 11:59 PM | 0 (0.0%) | 0 (0.0%) |
| Total | 93 (100.0%) | 138 (100.0%) |
Housing Occupancy in Parcelas Viejas Borinquen
Occupancy by Ownership in Parcelas Viejas Borinquen
Of the total 308 dwellings in Parcelas Viejas Borinquen, owner-occupied units account for 171 (55.5%), while renter-occupied units make up 137 (44.5%).
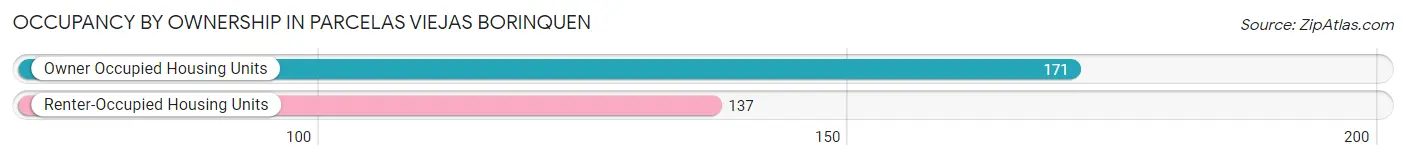
| Occupancy | # Housing Units | % Housing Units |
| Owner Occupied Housing Units | 171 | 55.5% |
| Renter-Occupied Housing Units | 137 | 44.5% |
| Total Occupied Housing Units | 308 | 100.0% |
Occupancy by Household Size in Parcelas Viejas Borinquen
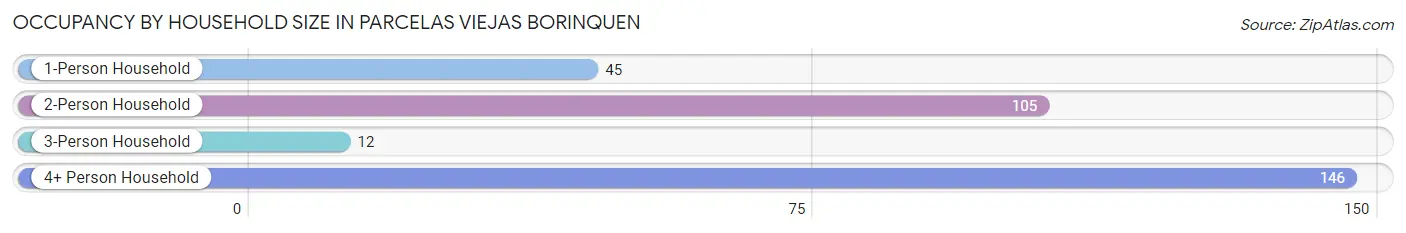
| Household Size | # Housing Units | % Housing Units |
| 1-Person Household | 45 | 14.6% |
| 2-Person Household | 105 | 34.1% |
| 3-Person Household | 12 | 3.9% |
| 4+ Person Household | 146 | 47.4% |
| Total Housing Units | 308 | 100.0% |
Occupancy by Ownership by Household Size in Parcelas Viejas Borinquen
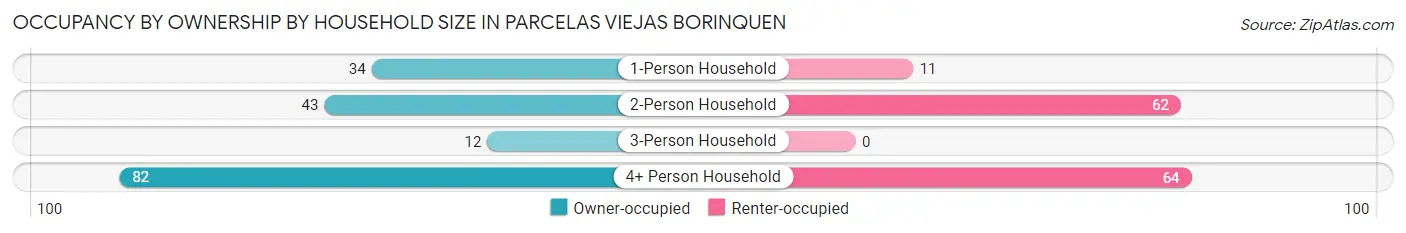
| Household Size | Owner-occupied | Renter-occupied |
| 1-Person Household | 34 (75.6%) | 11 (24.4%) |
| 2-Person Household | 43 (40.9%) | 62 (59.1%) |
| 3-Person Household | 12 (100.0%) | 0 (0.0%) |
| 4+ Person Household | 82 (56.2%) | 64 (43.8%) |
| Total Housing Units | 171 (55.5%) | 137 (44.5%) |
Occupancy by Educational Attainment in Parcelas Viejas Borinquen
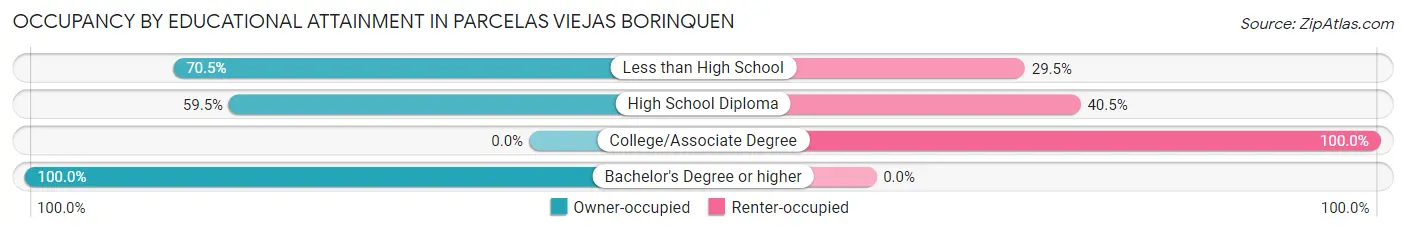
| Household Size | Owner-occupied | Renter-occupied |
| Less than High School | 67 (70.5%) | 28 (29.5%) |
| High School Diploma | 94 (59.5%) | 64 (40.5%) |
| College/Associate Degree | 0 (0.0%) | 45 (100.0%) |
| Bachelor's Degree or higher | 10 (100.0%) | 0 (0.0%) |
Occupancy by Age of Householder in Parcelas Viejas Borinquen
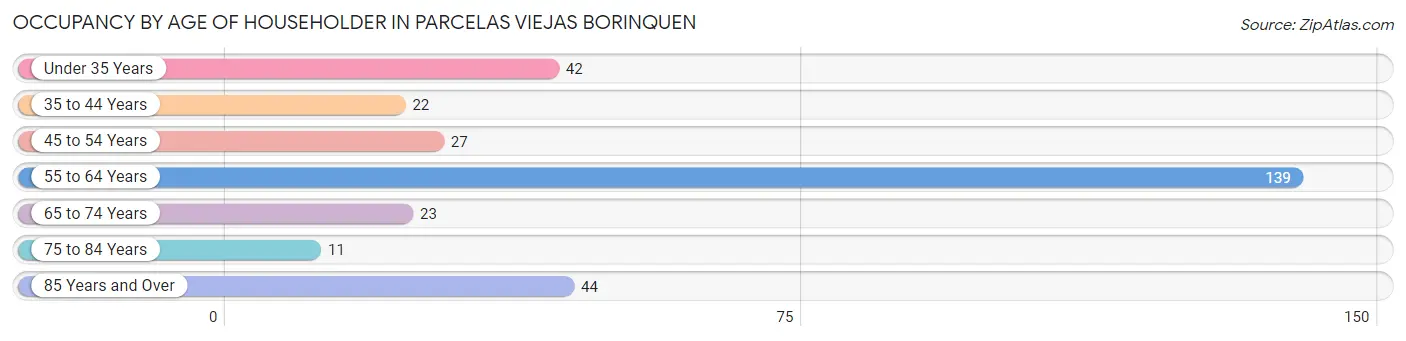
| Age Bracket | # Households | % Households |
| Under 35 Years | 42 | 13.6% |
| 35 to 44 Years | 22 | 7.1% |
| 45 to 54 Years | 27 | 8.8% |
| 55 to 64 Years | 139 | 45.1% |
| 65 to 74 Years | 23 | 7.5% |
| 75 to 84 Years | 11 | 3.6% |
| 85 Years and Over | 44 | 14.3% |
| Total | 308 | 100.0% |
Housing Finances in Parcelas Viejas Borinquen
Median Income by Occupancy in Parcelas Viejas Borinquen
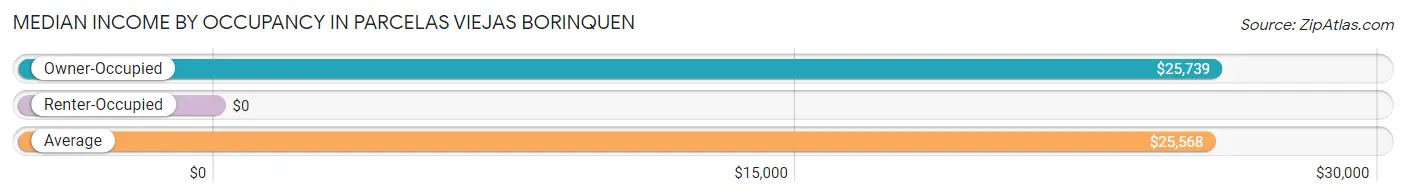
| Occupancy Type | # Households | Median Income |
| Owner-Occupied | 171 (55.5%) | $25,739 |
| Renter-Occupied | 137 (44.5%) | $0 |
| Average | 308 (100.0%) | $25,568 |
Occupancy by Householder Income Bracket in Parcelas Viejas Borinquen
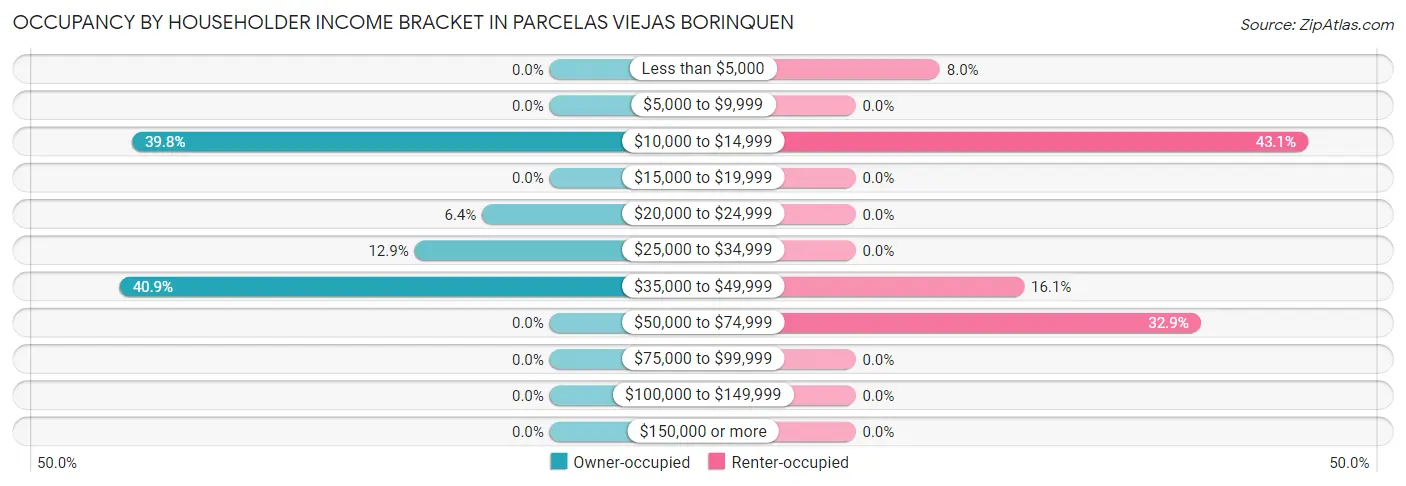
| Income Bracket | Owner-occupied | Renter-occupied |
| Less than $5,000 | 0 (0.0%) | 11 (8.0%) |
| $5,000 to $9,999 | 0 (0.0%) | 0 (0.0%) |
| $10,000 to $14,999 | 68 (39.8%) | 59 (43.1%) |
| $15,000 to $19,999 | 0 (0.0%) | 0 (0.0%) |
| $20,000 to $24,999 | 11 (6.4%) | 0 (0.0%) |
| $25,000 to $34,999 | 22 (12.9%) | 0 (0.0%) |
| $35,000 to $49,999 | 70 (40.9%) | 22 (16.1%) |
| $50,000 to $74,999 | 0 (0.0%) | 45 (32.9%) |
| $75,000 to $99,999 | 0 (0.0%) | 0 (0.0%) |
| $100,000 to $149,999 | 0 (0.0%) | 0 (0.0%) |
| $150,000 or more | 0 (0.0%) | 0 (0.0%) |
| Total | 171 (100.0%) | 137 (100.0%) |
Monthly Housing Cost Tiers in Parcelas Viejas Borinquen
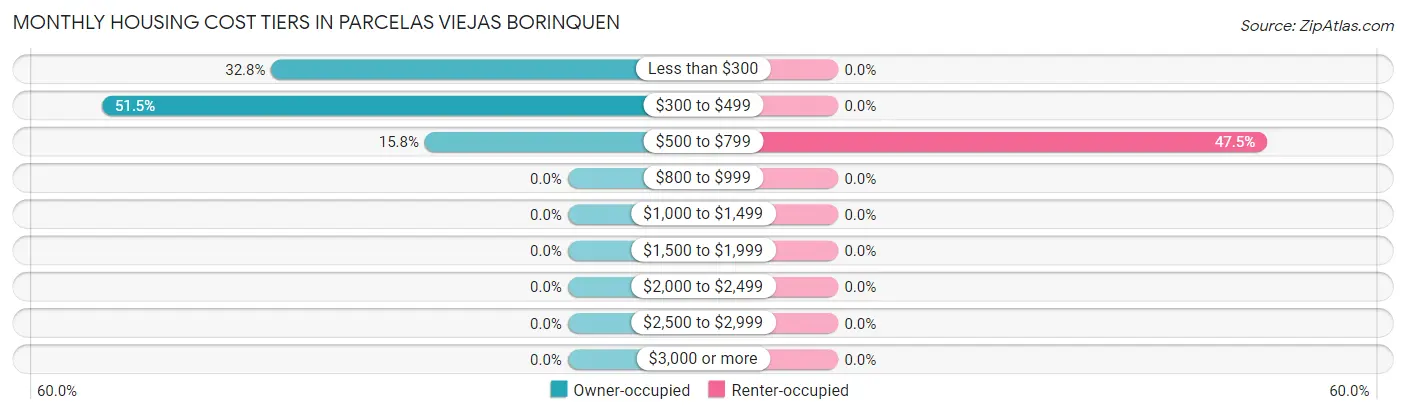
| Monthly Cost | Owner-occupied | Renter-occupied |
| Less than $300 | 56 (32.8%) | 0 (0.0%) |
| $300 to $499 | 88 (51.5%) | 0 (0.0%) |
| $500 to $799 | 27 (15.8%) | 65 (47.4%) |
| $800 to $999 | 0 (0.0%) | 0 (0.0%) |
| $1,000 to $1,499 | 0 (0.0%) | 0 (0.0%) |
| $1,500 to $1,999 | 0 (0.0%) | 0 (0.0%) |
| $2,000 to $2,499 | 0 (0.0%) | 0 (0.0%) |
| $2,500 to $2,999 | 0 (0.0%) | 0 (0.0%) |
| $3,000 or more | 0 (0.0%) | 0 (0.0%) |
| Total | 171 (100.0%) | 137 (100.0%) |
Physical Housing Characteristics in Parcelas Viejas Borinquen
Housing Structures in Parcelas Viejas Borinquen
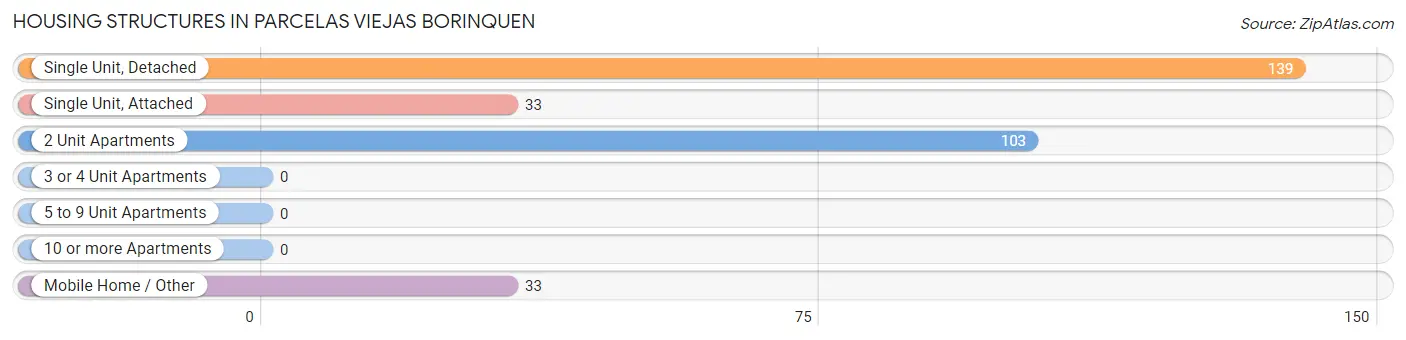
| Structure Type | # Housing Units | % Housing Units |
| Single Unit, Detached | 139 | 45.1% |
| Single Unit, Attached | 33 | 10.7% |
| 2 Unit Apartments | 103 | 33.4% |
| 3 or 4 Unit Apartments | 0 | 0.0% |
| 5 to 9 Unit Apartments | 0 | 0.0% |
| 10 or more Apartments | 0 | 0.0% |
| Mobile Home / Other | 33 | 10.7% |
| Total | 308 | 100.0% |
Housing Structures by Occupancy in Parcelas Viejas Borinquen
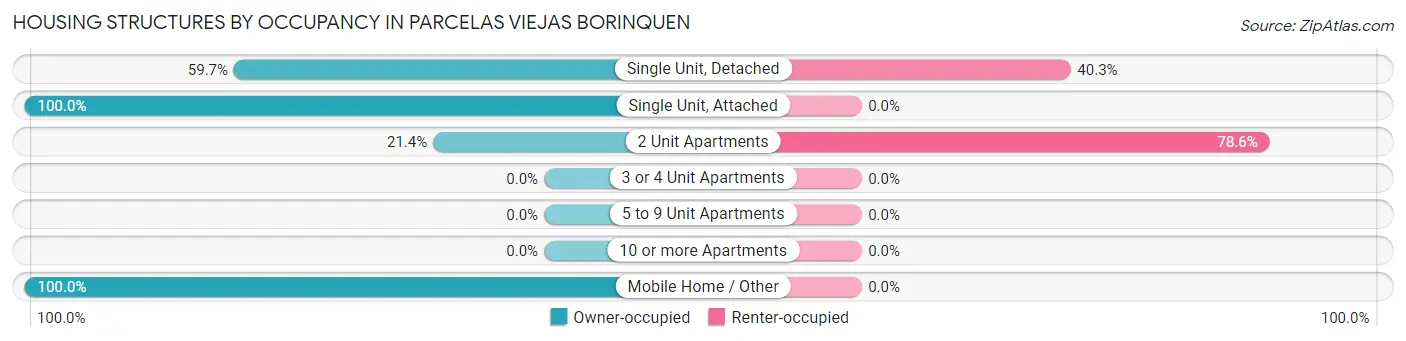
| Structure Type | Owner-occupied | Renter-occupied |
| Single Unit, Detached | 83 (59.7%) | 56 (40.3%) |
| Single Unit, Attached | 33 (100.0%) | 0 (0.0%) |
| 2 Unit Apartments | 22 (21.4%) | 81 (78.6%) |
| 3 or 4 Unit Apartments | 0 (0.0%) | 0 (0.0%) |
| 5 to 9 Unit Apartments | 0 (0.0%) | 0 (0.0%) |
| 10 or more Apartments | 0 (0.0%) | 0 (0.0%) |
| Mobile Home / Other | 33 (100.0%) | 0 (0.0%) |
| Total | 171 (55.5%) | 137 (44.5%) |
Housing Structures by Number of Rooms in Parcelas Viejas Borinquen
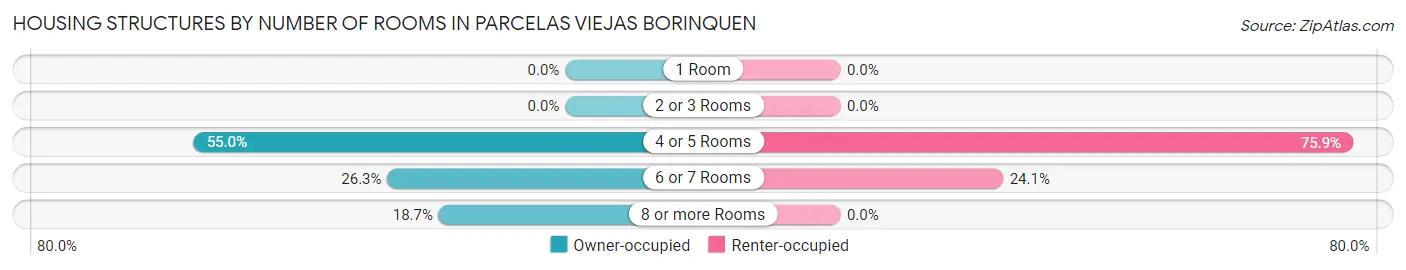
| Number of Rooms | Owner-occupied | Renter-occupied |
| 1 Room | 0 (0.0%) | 0 (0.0%) |
| 2 or 3 Rooms | 0 (0.0%) | 0 (0.0%) |
| 4 or 5 Rooms | 94 (55.0%) | 104 (75.9%) |
| 6 or 7 Rooms | 45 (26.3%) | 33 (24.1%) |
| 8 or more Rooms | 32 (18.7%) | 0 (0.0%) |
| Total | 171 (100.0%) | 137 (100.0%) |
Housing Structure by Heating Type in Parcelas Viejas Borinquen
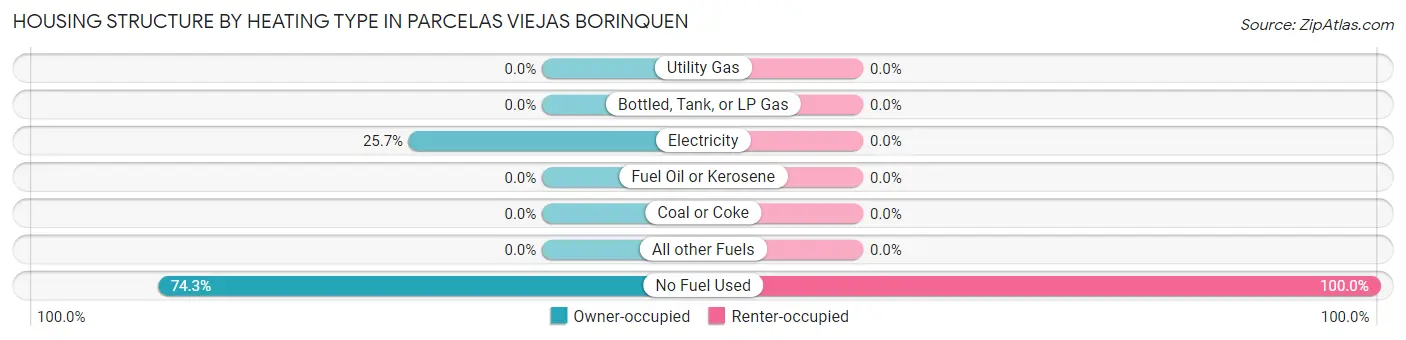
| Heating Type | Owner-occupied | Renter-occupied |
| Utility Gas | 0 (0.0%) | 0 (0.0%) |
| Bottled, Tank, or LP Gas | 0 (0.0%) | 0 (0.0%) |
| Electricity | 44 (25.7%) | 0 (0.0%) |
| Fuel Oil or Kerosene | 0 (0.0%) | 0 (0.0%) |
| Coal or Coke | 0 (0.0%) | 0 (0.0%) |
| All other Fuels | 0 (0.0%) | 0 (0.0%) |
| No Fuel Used | 127 (74.3%) | 137 (100.0%) |
| Total | 171 (100.0%) | 137 (100.0%) |
Household Vehicle Usage in Parcelas Viejas Borinquen
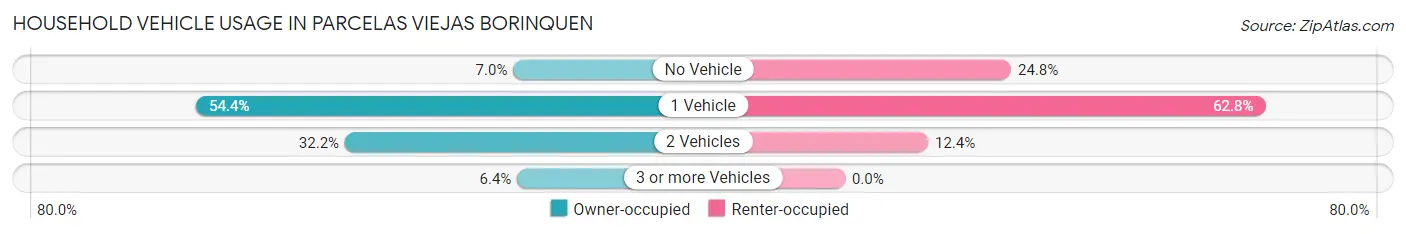
| Vehicles per Household | Owner-occupied | Renter-occupied |
| No Vehicle | 12 (7.0%) | 34 (24.8%) |
| 1 Vehicle | 93 (54.4%) | 86 (62.8%) |
| 2 Vehicles | 55 (32.2%) | 17 (12.4%) |
| 3 or more Vehicles | 11 (6.4%) | 0 (0.0%) |
| Total | 171 (100.0%) | 137 (100.0%) |
Real Estate & Mortgages in Parcelas Viejas Borinquen
Real Estate and Mortgage Overview in Parcelas Viejas Borinquen
| Characteristic | Without Mortgage | With Mortgage |
| Housing Units | 144 | 27 |
| Median Property Value | $101,900 | $0 |
| Median Household Income | $20,909 | $0 |
| Monthly Housing Costs | $310 | $0 |
| Real Estate Taxes | $591 | $27 |
Property Value by Mortgage Status in Parcelas Viejas Borinquen
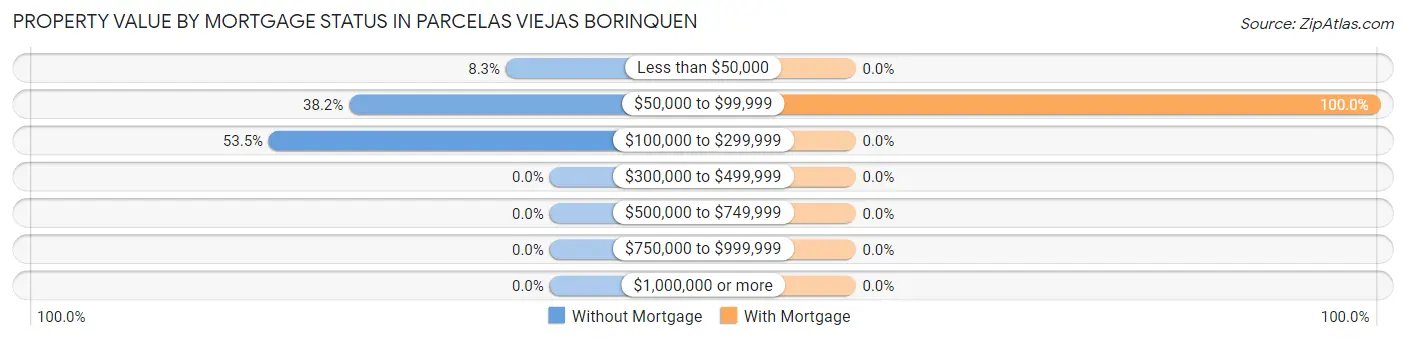
| Property Value | Without Mortgage | With Mortgage |
| Less than $50,000 | 12 (8.3%) | 0 (0.0%) |
| $50,000 to $99,999 | 55 (38.2%) | 27 (100.0%) |
| $100,000 to $299,999 | 77 (53.5%) | 0 (0.0%) |
| $300,000 to $499,999 | 0 (0.0%) | 0 (0.0%) |
| $500,000 to $749,999 | 0 (0.0%) | 0 (0.0%) |
| $750,000 to $999,999 | 0 (0.0%) | 0 (0.0%) |
| $1,000,000 or more | 0 (0.0%) | 0 (0.0%) |
| Total | 144 (100.0%) | 27 (100.0%) |
Household Income by Mortgage Status in Parcelas Viejas Borinquen
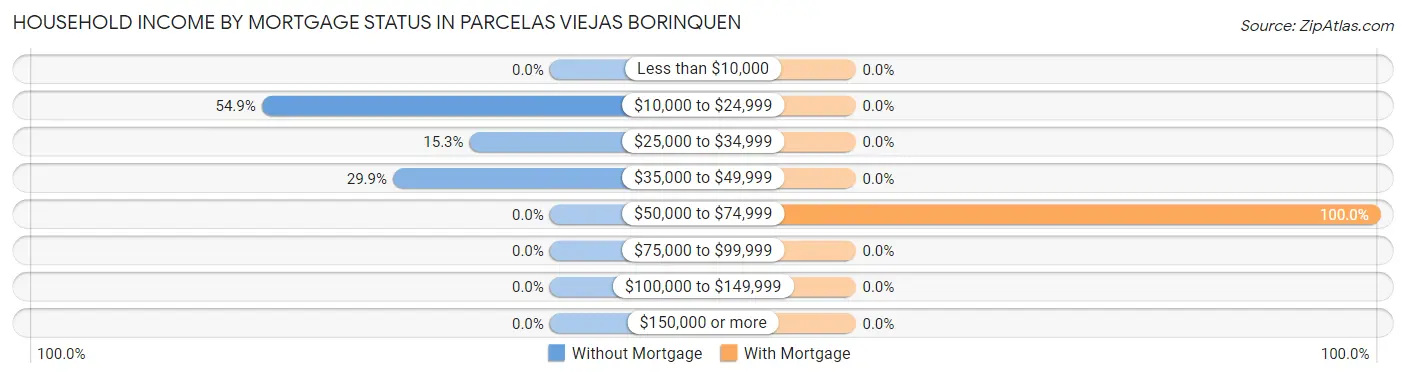
| Household Income | Without Mortgage | With Mortgage |
| Less than $10,000 | 0 (0.0%) | 0 (0.0%) |
| $10,000 to $24,999 | 79 (54.9%) | 0 (0.0%) |
| $25,000 to $34,999 | 22 (15.3%) | 0 (0.0%) |
| $35,000 to $49,999 | 43 (29.9%) | 0 (0.0%) |
| $50,000 to $74,999 | 0 (0.0%) | 27 (100.0%) |
| $75,000 to $99,999 | 0 (0.0%) | 0 (0.0%) |
| $100,000 to $149,999 | 0 (0.0%) | 0 (0.0%) |
| $150,000 or more | 0 (0.0%) | 0 (0.0%) |
| Total | 144 (100.0%) | 27 (100.0%) |
Property Value to Household Income Ratio in Parcelas Viejas Borinquen
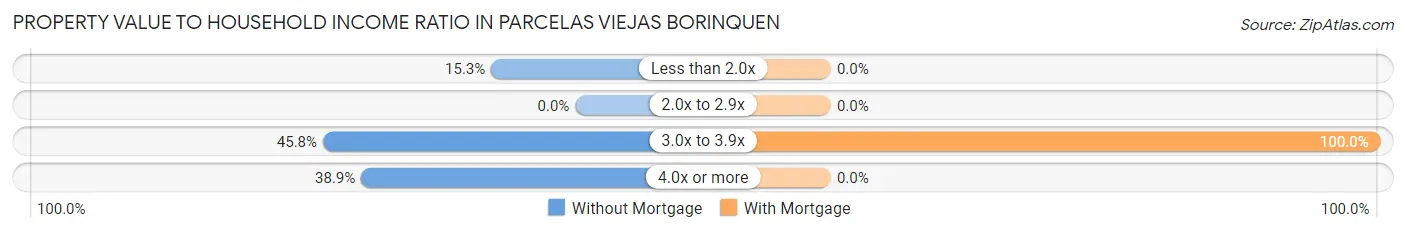
| Value-to-Income Ratio | Without Mortgage | With Mortgage |
| Less than 2.0x | 22 (15.3%) | 0 (0.0%) |
| 2.0x to 2.9x | 0 (0.0%) | 0 (0.0%) |
| 3.0x to 3.9x | 66 (45.8%) | 27 (100.0%) |
| 4.0x or more | 56 (38.9%) | 0 (0.0%) |
| Total | 144 (100.0%) | 27 (100.0%) |
Real Estate Taxes by Mortgage Status in Parcelas Viejas Borinquen
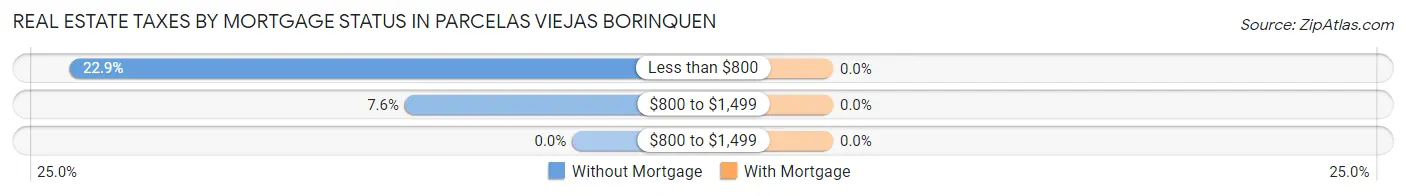
| Property Taxes | Without Mortgage | With Mortgage |
| Less than $800 | 33 (22.9%) | 0 (0.0%) |
| $800 to $1,499 | 11 (7.6%) | 0 (0.0%) |
| $800 to $1,499 | 0 (0.0%) | 0 (0.0%) |
| Total | 144 (100.0%) | 27 (100.0%) |
Health & Disability in Parcelas Viejas Borinquen
Health Insurance Coverage by Age in Parcelas Viejas Borinquen
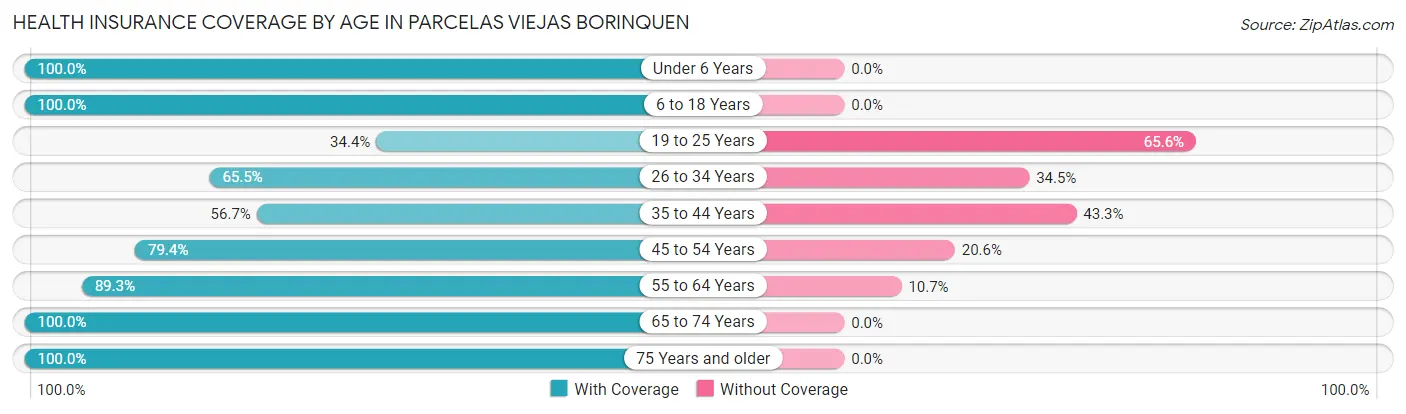
| Age Bracket | With Coverage | Without Coverage |
| Under 6 Years | 32 (100.0%) | 0 (0.0%) |
| 6 to 18 Years | 105 (100.0%) | 0 (0.0%) |
| 19 to 25 Years | 31 (34.4%) | 59 (65.6%) |
| 26 to 34 Years | 114 (65.5%) | 60 (34.5%) |
| 35 to 44 Years | 59 (56.7%) | 45 (43.3%) |
| 45 to 54 Years | 104 (79.4%) | 27 (20.6%) |
| 55 to 64 Years | 218 (89.3%) | 26 (10.7%) |
| 65 to 74 Years | 115 (100.0%) | 0 (0.0%) |
| 75 Years and older | 90 (100.0%) | 0 (0.0%) |
| Total | 868 (80.0%) | 217 (20.0%) |
Health Insurance Coverage by Citizenship Status in Parcelas Viejas Borinquen
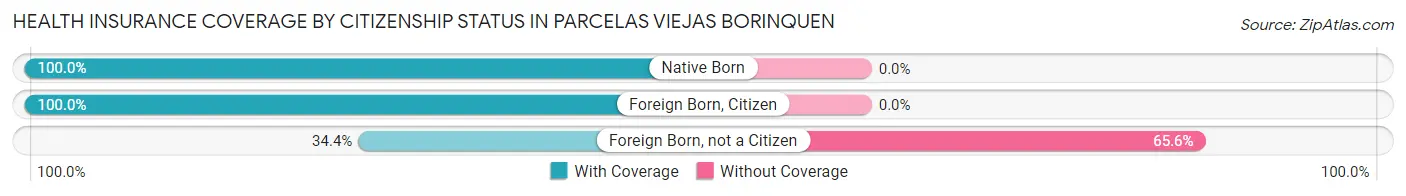
| Citizenship Status | With Coverage | Without Coverage |
| Native Born | 32 (100.0%) | 0 (0.0%) |
| Foreign Born, Citizen | 105 (100.0%) | 0 (0.0%) |
| Foreign Born, not a Citizen | 31 (34.4%) | 59 (65.6%) |
Health Insurance Coverage by Household Income in Parcelas Viejas Borinquen
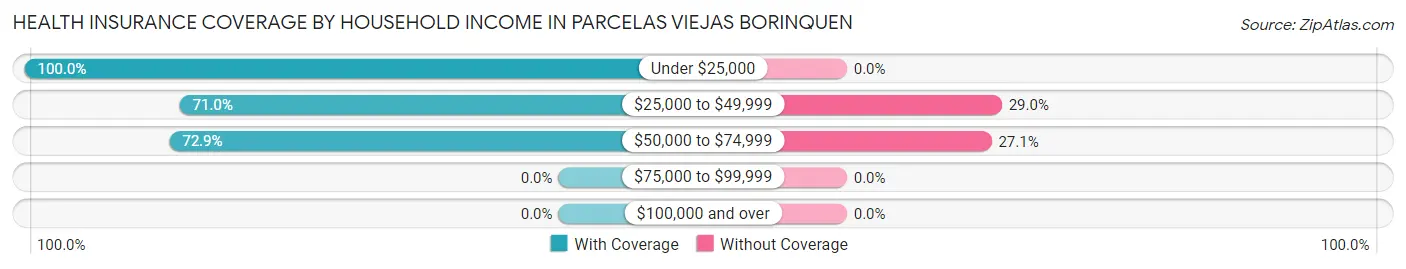
| Household Income | With Coverage | Without Coverage |
| Under $25,000 | 326 (100.0%) | 0 (0.0%) |
| $25,000 to $49,999 | 418 (71.0%) | 171 (29.0%) |
| $50,000 to $74,999 | 121 (72.9%) | 45 (27.1%) |
| $75,000 to $99,999 | 0 (0.0%) | 0 (0.0%) |
| $100,000 and over | 0 (0.0%) | 0 (0.0%) |
Public vs Private Health Insurance Coverage by Age in Parcelas Viejas Borinquen
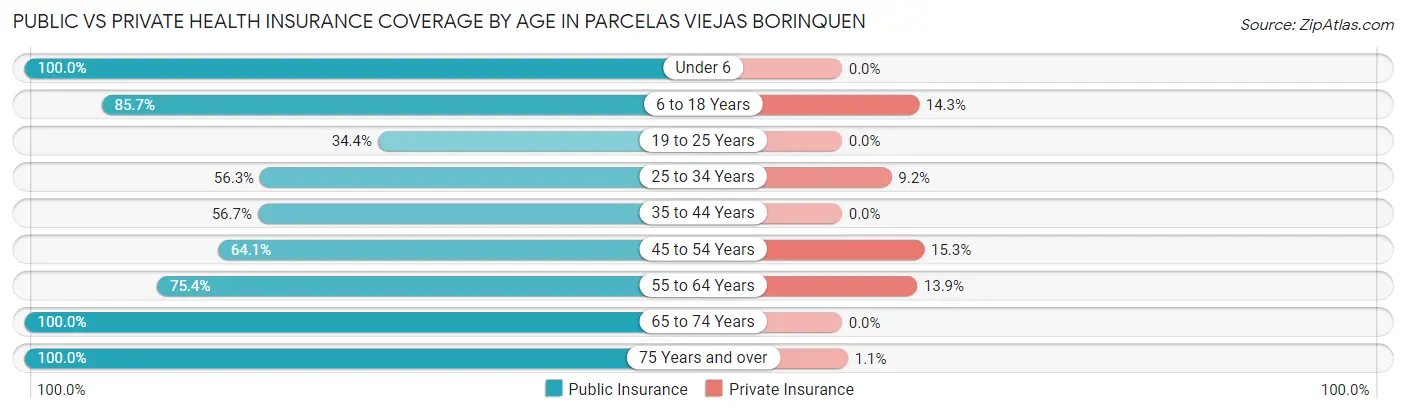
| Age Bracket | Public Insurance | Private Insurance |
| Under 6 | 32 (100.0%) | 0 (0.0%) |
| 6 to 18 Years | 90 (85.7%) | 15 (14.3%) |
| 19 to 25 Years | 31 (34.4%) | 0 (0.0%) |
| 25 to 34 Years | 98 (56.3%) | 16 (9.2%) |
| 35 to 44 Years | 59 (56.7%) | 0 (0.0%) |
| 45 to 54 Years | 84 (64.1%) | 20 (15.3%) |
| 55 to 64 Years | 184 (75.4%) | 34 (13.9%) |
| 65 to 74 Years | 115 (100.0%) | 0 (0.0%) |
| 75 Years and over | 90 (100.0%) | 1 (1.1%) |
| Total | 783 (72.2%) | 86 (7.9%) |
Disability Status by Sex by Age in Parcelas Viejas Borinquen
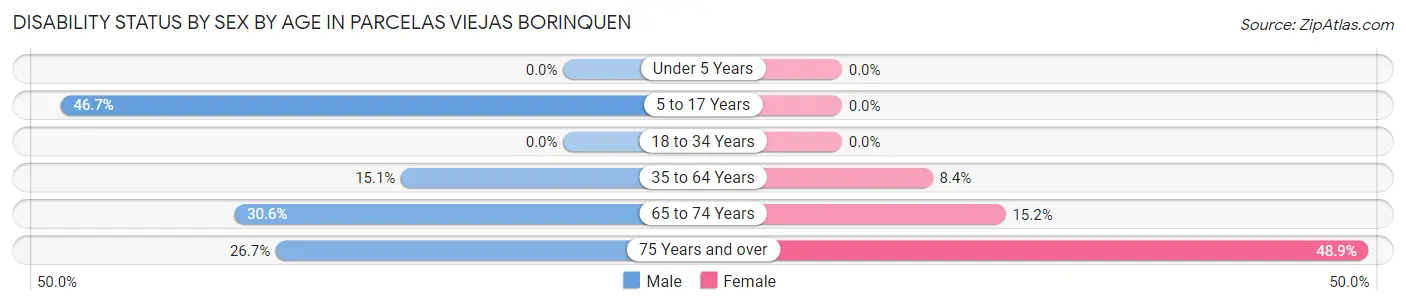
| Age Bracket | Male | Female |
| Under 5 Years | 0 (0.0%) | 0 (0.0%) |
| 5 to 17 Years | 35 (46.7%) | 0 (0.0%) |
| 18 to 34 Years | 0 (0.0%) | 0 (0.0%) |
| 35 to 64 Years | 31 (15.0%) | 23 (8.4%) |
| 65 to 74 Years | 11 (30.6%) | 12 (15.2%) |
| 75 Years and over | 12 (26.7%) | 22 (48.9%) |
Disability Class by Sex by Age in Parcelas Viejas Borinquen
Disability Class: Hearing Difficulty
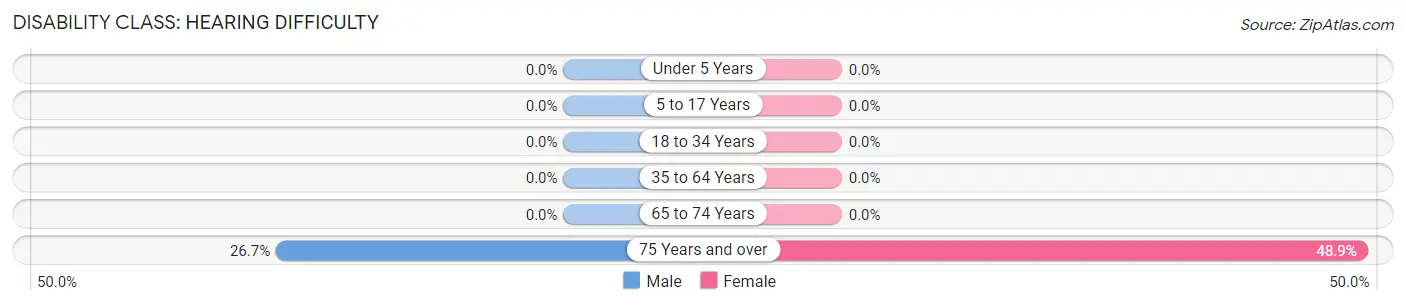
| Age Bracket | Male | Female |
| Under 5 Years | 0 (0.0%) | 0 (0.0%) |
| 5 to 17 Years | 0 (0.0%) | 0 (0.0%) |
| 18 to 34 Years | 0 (0.0%) | 0 (0.0%) |
| 35 to 64 Years | 0 (0.0%) | 0 (0.0%) |
| 65 to 74 Years | 0 (0.0%) | 0 (0.0%) |
| 75 Years and over | 12 (26.7%) | 22 (48.9%) |
Disability Class: Vision Difficulty
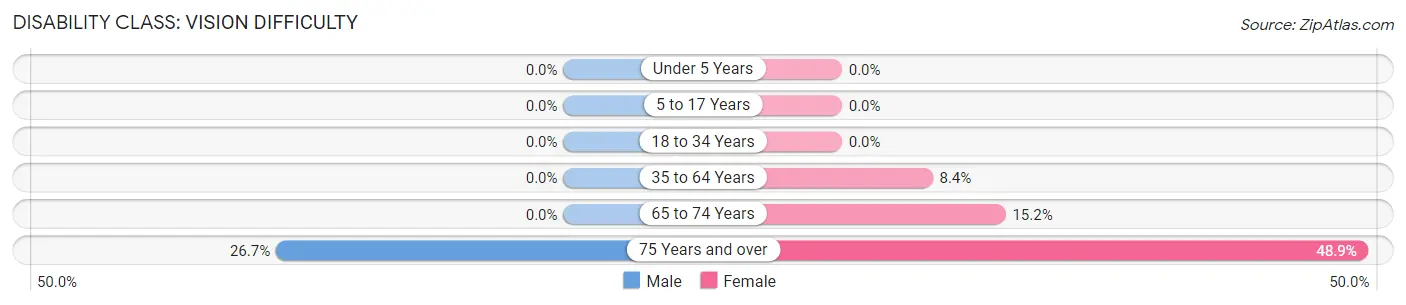
| Age Bracket | Male | Female |
| Under 5 Years | 0 (0.0%) | 0 (0.0%) |
| 5 to 17 Years | 0 (0.0%) | 0 (0.0%) |
| 18 to 34 Years | 0 (0.0%) | 0 (0.0%) |
| 35 to 64 Years | 0 (0.0%) | 23 (8.4%) |
| 65 to 74 Years | 0 (0.0%) | 12 (15.2%) |
| 75 Years and over | 12 (26.7%) | 22 (48.9%) |
Disability Class: Cognitive Difficulty
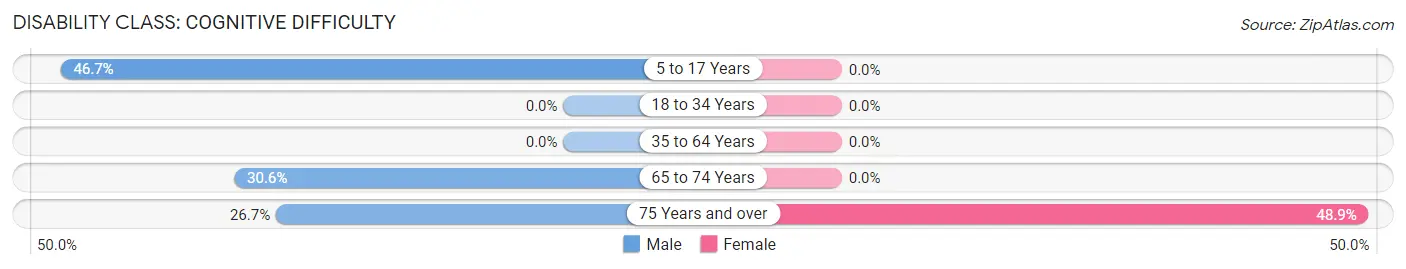
| Age Bracket | Male | Female |
| 5 to 17 Years | 35 (46.7%) | 0 (0.0%) |
| 18 to 34 Years | 0 (0.0%) | 0 (0.0%) |
| 35 to 64 Years | 0 (0.0%) | 0 (0.0%) |
| 65 to 74 Years | 11 (30.6%) | 0 (0.0%) |
| 75 Years and over | 12 (26.7%) | 22 (48.9%) |
Disability Class: Ambulatory Difficulty
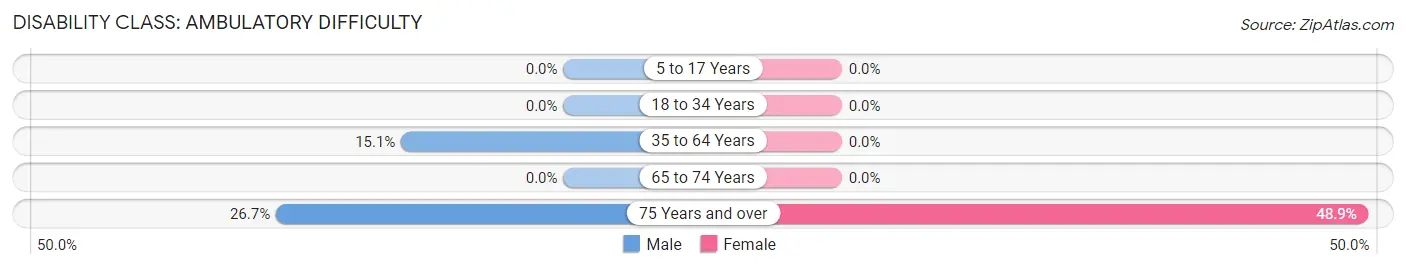
| Age Bracket | Male | Female |
| 5 to 17 Years | 0 (0.0%) | 0 (0.0%) |
| 18 to 34 Years | 0 (0.0%) | 0 (0.0%) |
| 35 to 64 Years | 31 (15.0%) | 0 (0.0%) |
| 65 to 74 Years | 0 (0.0%) | 0 (0.0%) |
| 75 Years and over | 12 (26.7%) | 22 (48.9%) |
Disability Class: Self-Care Difficulty
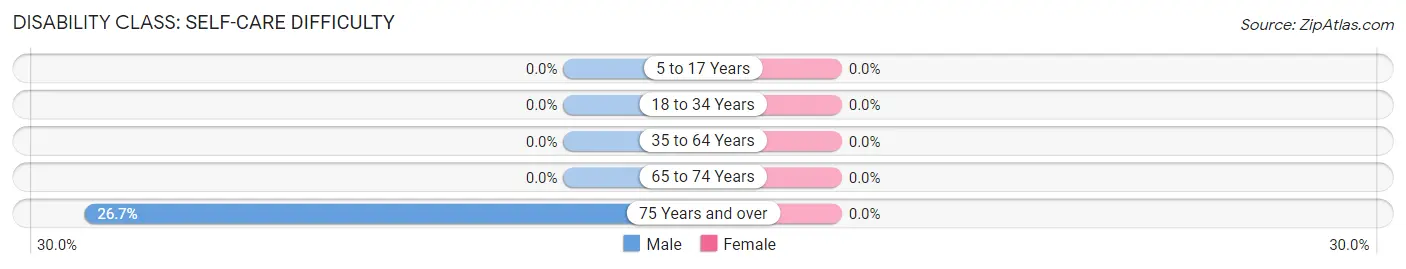
| Age Bracket | Male | Female |
| 5 to 17 Years | 0 (0.0%) | 0 (0.0%) |
| 18 to 34 Years | 0 (0.0%) | 0 (0.0%) |
| 35 to 64 Years | 0 (0.0%) | 0 (0.0%) |
| 65 to 74 Years | 0 (0.0%) | 0 (0.0%) |
| 75 Years and over | 12 (26.7%) | 0 (0.0%) |
Technology Access in Parcelas Viejas Borinquen
Computing Device Access in Parcelas Viejas Borinquen
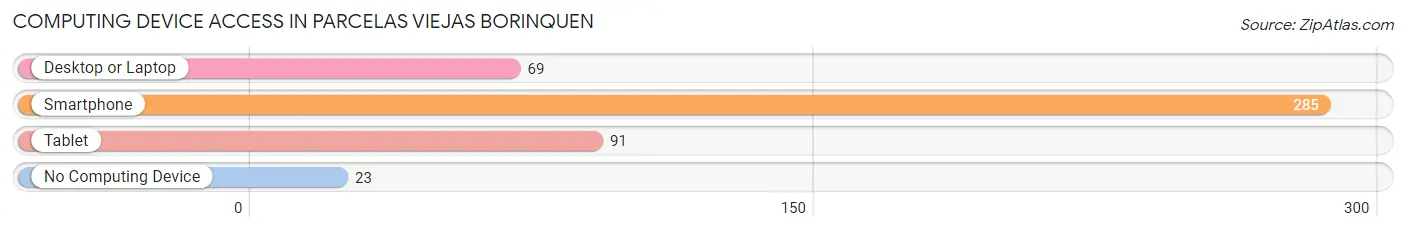
| Device Type | # Households | % Households |
| Desktop or Laptop | 69 | 22.4% |
| Smartphone | 285 | 92.5% |
| Tablet | 91 | 29.5% |
| No Computing Device | 23 | 7.5% |
| Total | 308 | 100.0% |
Internet Access in Parcelas Viejas Borinquen
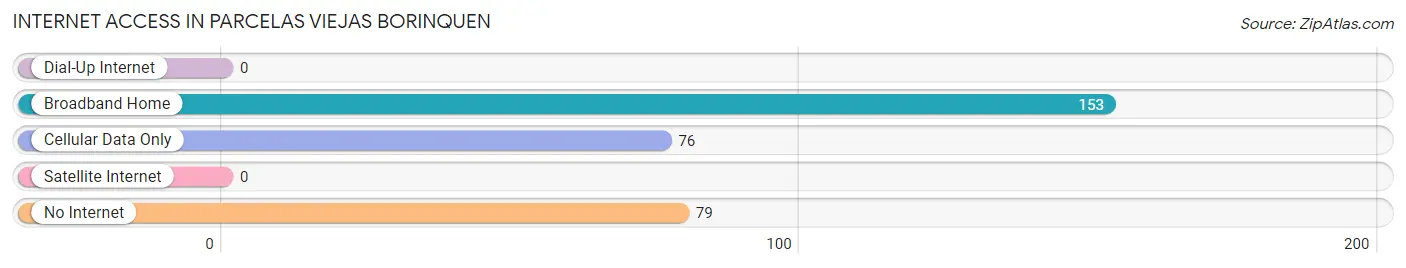
| Internet Type | # Households | % Households |
| Dial-Up Internet | 0 | 0.0% |
| Broadband Home | 153 | 49.7% |
| Cellular Data Only | 76 | 24.7% |
| Satellite Internet | 0 | 0.0% |
| No Internet | 79 | 25.7% |
| Total | 308 | 100.0% |
Parcelas Viejas Borinquen Summary
Parcelas Viejas Borinquen is a small rural community located in the municipality of San Juan, Puerto Rico. It is situated in the northern part of the island, about 20 miles from the capital city of San Juan. The community is home to approximately 1,500 people, most of whom are of Puerto Rican descent.
The history of Parcelas Viejas Borinquen dates back to the early 19th century, when the area was first settled by Spanish colonists. The community was originally known as “Parcelas Viejas”, which translates to “Old Parcels” in English. The name was derived from the fact that the land was divided into parcels for agricultural use. Over the years, the community has grown and developed, and today it is a vibrant and diverse community.
The geography of Parcelas Viejas Borinquen is characterized by rolling hills and lush vegetation. The area is located in the northern part of the island, and is surrounded by the Atlantic Ocean to the north and the Caribbean Sea to the south. The climate is tropical, with temperatures ranging from the mid-70s to the mid-80s throughout the year.
The economy of Parcelas Viejas Borinquen is largely based on agriculture. The main crops grown in the area are coffee, bananas, and sugar cane. In addition, the community is home to several small businesses, including restaurants, grocery stores, and other retail establishments.
The demographics of Parcelas Viejas Borinquen are largely composed of Puerto Ricans. The majority of the population is of African descent, with a small percentage of other ethnicities. The median age of the population is around 35 years old, and the median household income is approximately $20,000 per year.
Parcelas Viejas Borinquen is a vibrant and diverse community that has a rich history and culture. The area is home to a variety of businesses and industries, and the people of the community are proud of their heritage and culture. The community is a great place to live and work, and it is a great example of the beauty and diversity of Puerto Rico.
Common Questions
What is Per Capita Income in Parcelas Viejas Borinquen?
Per Capita income in Parcelas Viejas Borinquen is $9,923.
What is the Median Family Income in Parcelas Viejas Borinquen?
Median Family Income in Parcelas Viejas Borinquen is $35,229.
What is the Median Household income in Parcelas Viejas Borinquen?
Median Household Income in Parcelas Viejas Borinquen is $25,568.
What is Inequality or Gini Index in Parcelas Viejas Borinquen?
Inequality or Gini Index in Parcelas Viejas Borinquen is 0.34.
What is the Total Population of Parcelas Viejas Borinquen?
Total Population of Parcelas Viejas Borinquen is 1,085.
What is the Total Male Population of Parcelas Viejas Borinquen?
Total Male Population of Parcelas Viejas Borinquen is 497.
What is the Total Female Population of Parcelas Viejas Borinquen?
Total Female Population of Parcelas Viejas Borinquen is 588.
What is the Ratio of Males per 100 Females in Parcelas Viejas Borinquen?
There are 84.52 Males per 100 Females in Parcelas Viejas Borinquen.
What is the Ratio of Females per 100 Males in Parcelas Viejas Borinquen?
There are 118.31 Females per 100 Males in Parcelas Viejas Borinquen.
What is the Median Population Age in Parcelas Viejas Borinquen?
Median Population Age in Parcelas Viejas Borinquen is 46.1 Years.
What is the Average Family Size in Parcelas Viejas Borinquen
Average Family Size in Parcelas Viejas Borinquen is 3.9 People.
What is the Average Household Size in Parcelas Viejas Borinquen
Average Household Size in Parcelas Viejas Borinquen is 3.5 People.
How Large is the Labor Force in Parcelas Viejas Borinquen?
There are 294 People in the Labor Forcein in Parcelas Viejas Borinquen.
What is the Percentage of People in the Labor Force in Parcelas Viejas Borinquen?
31.0% of People are in the Labor Force in Parcelas Viejas Borinquen.
What is the Unemployment Rate in Parcelas Viejas Borinquen?
Unemployment Rate in Parcelas Viejas Borinquen is 21.4%.