Monserrate, PR Map & Demographics
Monserrate Map
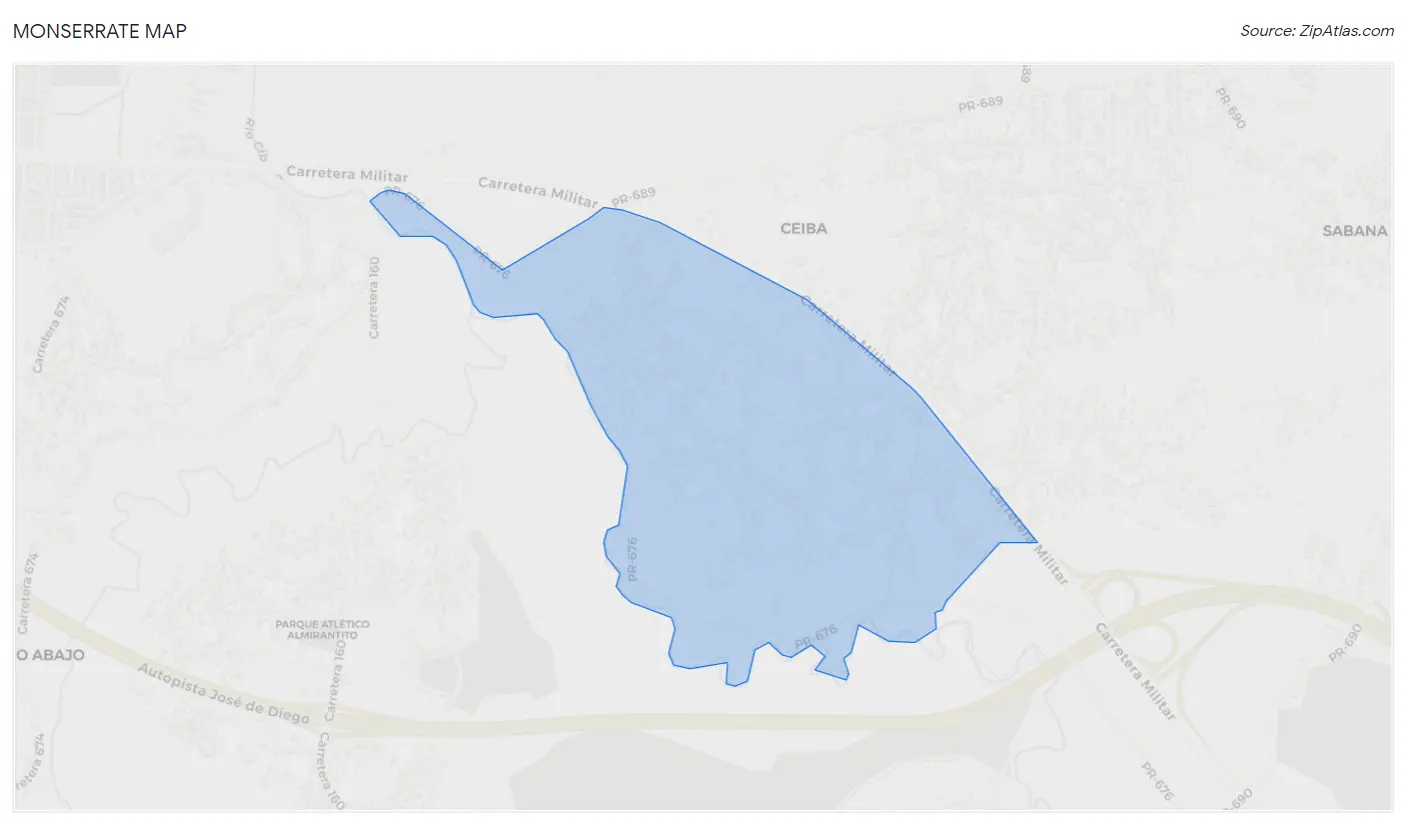
Monserrate Overview
$8,638
PER CAPITA INCOME
$16,010
AVG FAMILY INCOME
$16,690
AVG HOUSEHOLD INCOME
46.9%
WAGE / INCOME GAP [ % ]
53.1¢/ $1
WAGE / INCOME GAP [ $ ]
$15,420
FAMILY INCOME DEFICIT
0.50
INEQUALITY / GINI INDEX
2,266
TOTAL POPULATION
962
MALE POPULATION
1,304
FEMALE POPULATION
73.77
MALES / 100 FEMALES
135.55
FEMALES / 100 MALES
36.3
MEDIAN AGE
3.2
AVG FAMILY SIZE
2.8
AVG HOUSEHOLD SIZE
737
LABOR FORCE [ PEOPLE ]
40.6%
PERCENT IN LABOR FORCE
20.1%
UNEMPLOYMENT RATE
Income in Monserrate
Income Overview in Monserrate
Per Capita Income in Monserrate is $8,638, while median incomes of families and households are $16,010 and $16,690 respectively.
| Characteristic | Number | Measure |
| Per Capita Income | 2,266 | $8,638 |
| Median Family Income | 587 | $16,010 |
| Mean Family Income | 587 | $22,197 |
| Median Household Income | 816 | $16,690 |
| Mean Household Income | 816 | $22,660 |
| Income Deficit | 587 | $15,420 |
| Wage / Income Gap (%) | 2,266 | 46.86% |
| Wage / Income Gap ($) | 2,266 | 53.14¢ per $1 |
| Gini / Inequality Index | 2,266 | 0.50 |
Earnings by Sex in Monserrate
Average Earnings in Monserrate are $15,076, $18,574 for men and $9,870 for women, a difference of 46.9%.
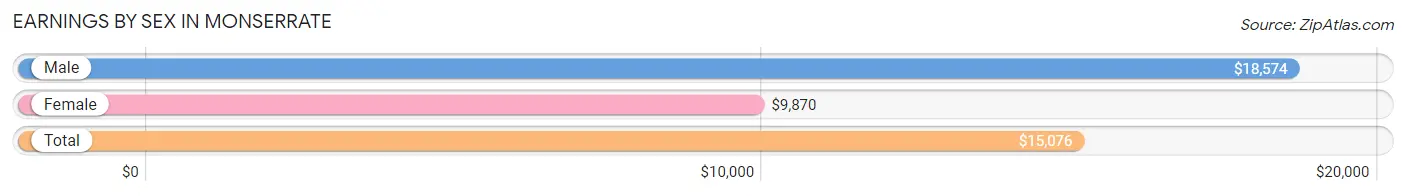
| Sex | Number | Average Earnings |
| Male | 283 (43.7%) | $18,574 |
| Female | 365 (56.3%) | $9,870 |
| Total | 648 (100.0%) | $15,076 |
Earnings by Sex by Income Bracket in Monserrate
The most common earnings brackets in Monserrate are $17,500 to $19,999 for men (64 | 22.6%) and $2,499 or less for women (90 | 24.7%).
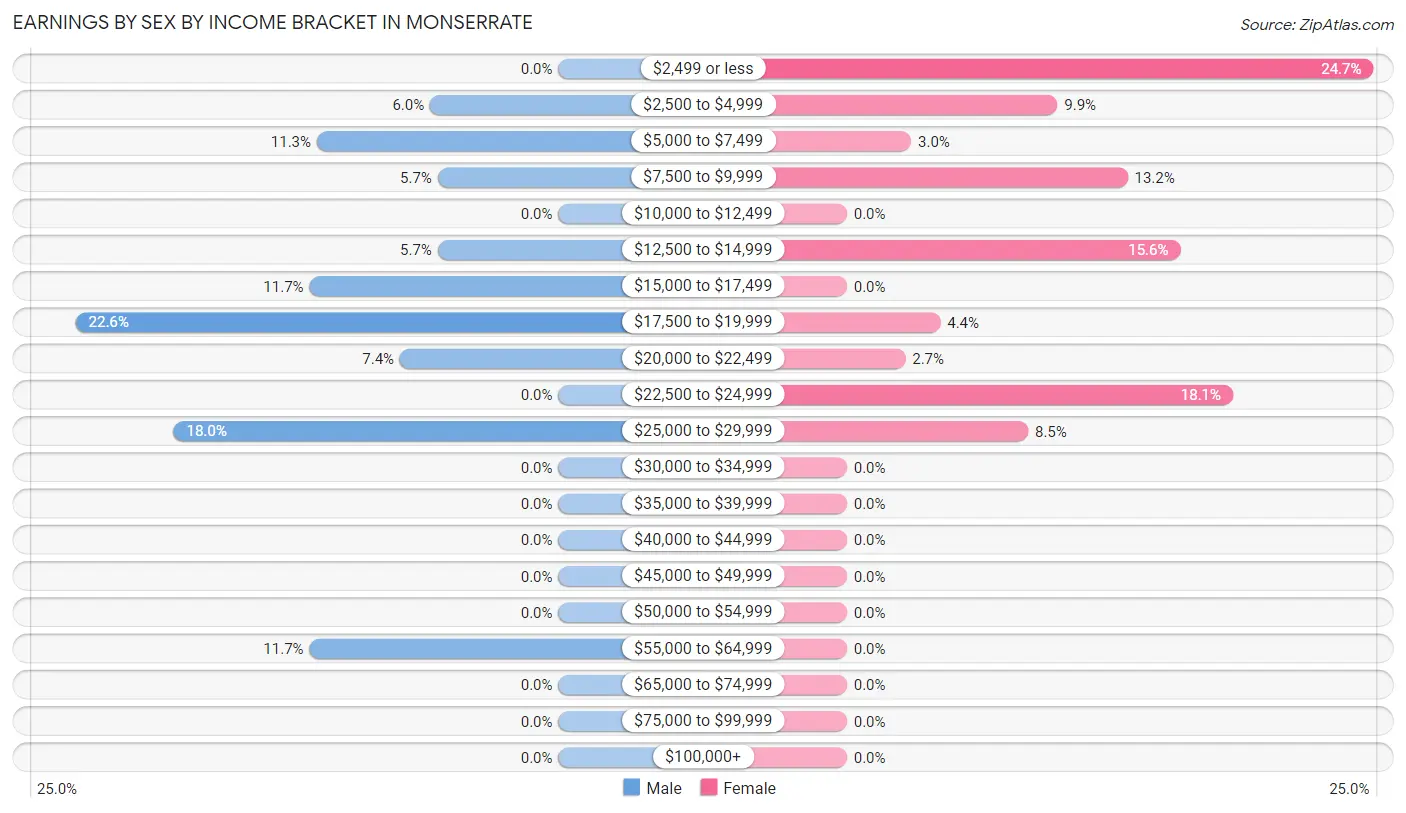
| Income | Male | Female |
| $2,499 or less | 0 (0.0%) | 90 (24.7%) |
| $2,500 to $4,999 | 17 (6.0%) | 36 (9.9%) |
| $5,000 to $7,499 | 32 (11.3%) | 11 (3.0%) |
| $7,500 to $9,999 | 16 (5.7%) | 48 (13.2%) |
| $10,000 to $12,499 | 0 (0.0%) | 0 (0.0%) |
| $12,500 to $14,999 | 16 (5.7%) | 57 (15.6%) |
| $15,000 to $17,499 | 33 (11.7%) | 0 (0.0%) |
| $17,500 to $19,999 | 64 (22.6%) | 16 (4.4%) |
| $20,000 to $22,499 | 21 (7.4%) | 10 (2.7%) |
| $22,500 to $24,999 | 0 (0.0%) | 66 (18.1%) |
| $25,000 to $29,999 | 51 (18.0%) | 31 (8.5%) |
| $30,000 to $34,999 | 0 (0.0%) | 0 (0.0%) |
| $35,000 to $39,999 | 0 (0.0%) | 0 (0.0%) |
| $40,000 to $44,999 | 0 (0.0%) | 0 (0.0%) |
| $45,000 to $49,999 | 0 (0.0%) | 0 (0.0%) |
| $50,000 to $54,999 | 0 (0.0%) | 0 (0.0%) |
| $55,000 to $64,999 | 33 (11.7%) | 0 (0.0%) |
| $65,000 to $74,999 | 0 (0.0%) | 0 (0.0%) |
| $75,000 to $99,999 | 0 (0.0%) | 0 (0.0%) |
| $100,000+ | 0 (0.0%) | 0 (0.0%) |
| Total | 283 (100.0%) | 365 (100.0%) |
Earnings by Sex by Educational Attainment in Monserrate
Average earnings in Monserrate are $18,574 for men and $14,352 for women, a difference of 22.7%. Men with an educational attainment of college or associate's degree enjoy the highest average annual earnings of $18,750, while those with high school diploma education earn the least with $15,909. Women with an educational attainment of college or associate's degree earn the most with the average annual earnings of $14,028, while those with college or associate's degree education have the smallest earnings of $14,028.
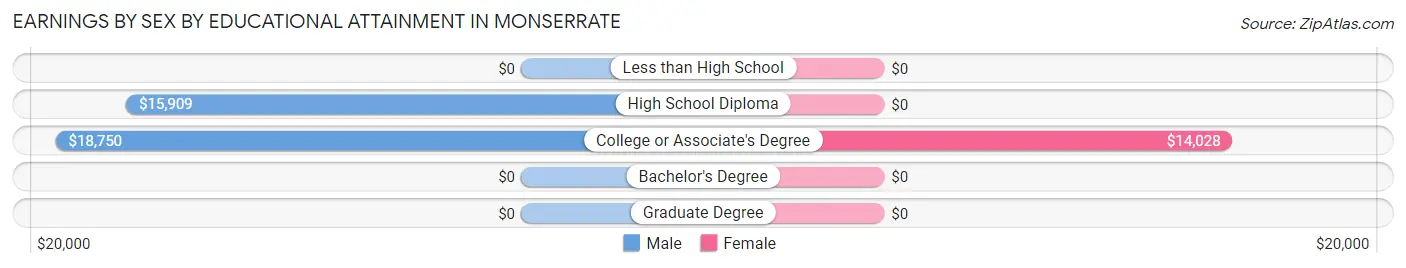
| Educational Attainment | Male Income | Female Income |
| Less than High School | - | - |
| High School Diploma | $15,909 | $0 |
| College or Associate's Degree | $18,750 | $14,028 |
| Bachelor's Degree | - | - |
| Graduate Degree | - | - |
| Total | $18,574 | $14,352 |
Family Income in Monserrate
Family Income Brackets in Monserrate
According to the Monserrate family income data, there are 267 families falling into the less than $10,000 income range, which is the most common income bracket and makes up 45.5% of all families.
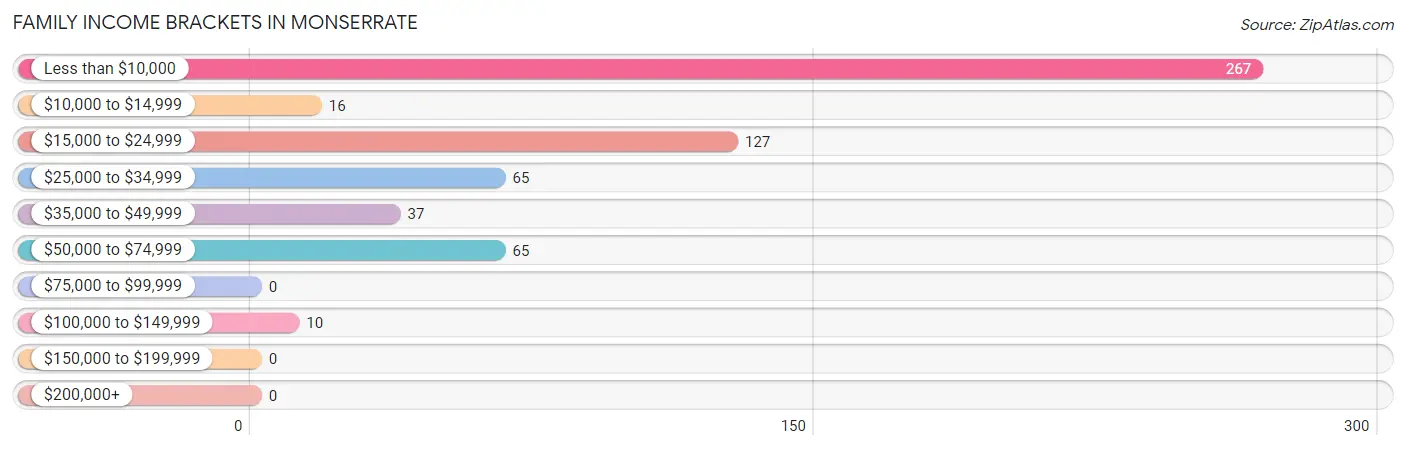
| Income Bracket | # Families | % Families |
| Less than $10,000 | 267 | 45.5% |
| $10,000 to $14,999 | 16 | 2.7% |
| $15,000 to $24,999 | 127 | 21.6% |
| $25,000 to $34,999 | 65 | 11.1% |
| $35,000 to $49,999 | 37 | 6.3% |
| $50,000 to $74,999 | 65 | 11.1% |
| $75,000 to $99,999 | 0 | 0.0% |
| $100,000 to $149,999 | 10 | 1.7% |
| $150,000 to $199,999 | 0 | 0.0% |
| $200,000+ | 0 | 0.0% |
Family Income by Famaliy Size in Monserrate
5-person families (45 | 7.7%) account for the highest median family income in Monserrate with $73,355 per family, while 5-person families (45 | 7.7%) have the highest median income of $14,671 per family member.
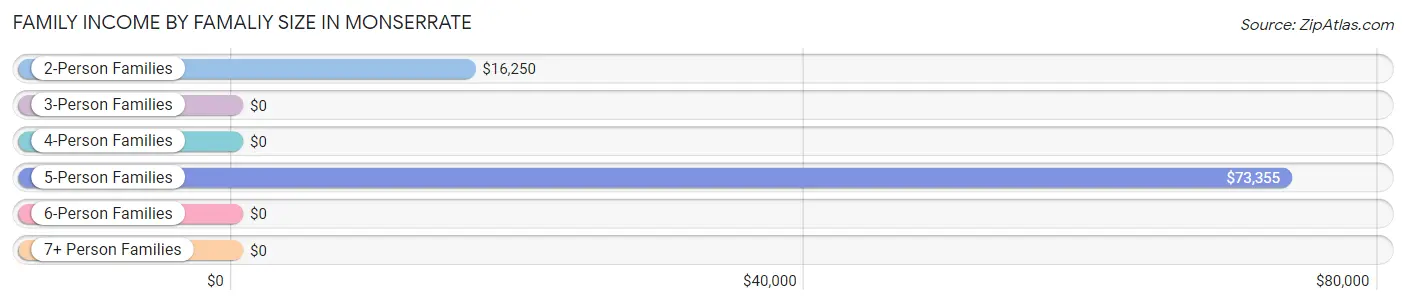
| Income Bracket | # Families | Median Income |
| 2-Person Families | 348 (59.3%) | $16,250 |
| 3-Person Families | 103 (17.5%) | $0 |
| 4-Person Families | 62 (10.6%) | $0 |
| 5-Person Families | 45 (7.7%) | $73,355 |
| 6-Person Families | 10 (1.7%) | $0 |
| 7+ Person Families | 19 (3.2%) | $0 |
| Total | 587 (100.0%) | $16,010 |
Family Income by Number of Earners in Monserrate
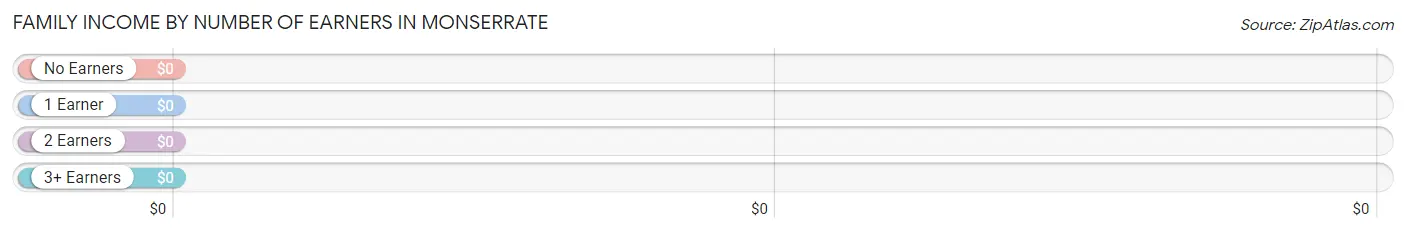
| Number of Earners | # Families | Median Income |
| No Earners | 286 (48.7%) | $0 |
| 1 Earner | 171 (29.1%) | $0 |
| 2 Earners | 101 (17.2%) | $0 |
| 3+ Earners | 29 (4.9%) | $0 |
| Total | 587 (100.0%) | $16,010 |
Household Income in Monserrate
Household Income Brackets in Monserrate
With 291 households falling in the category, the less than $10,000 income range is the most frequent in Monserrate, accounting for 35.7% of all households.
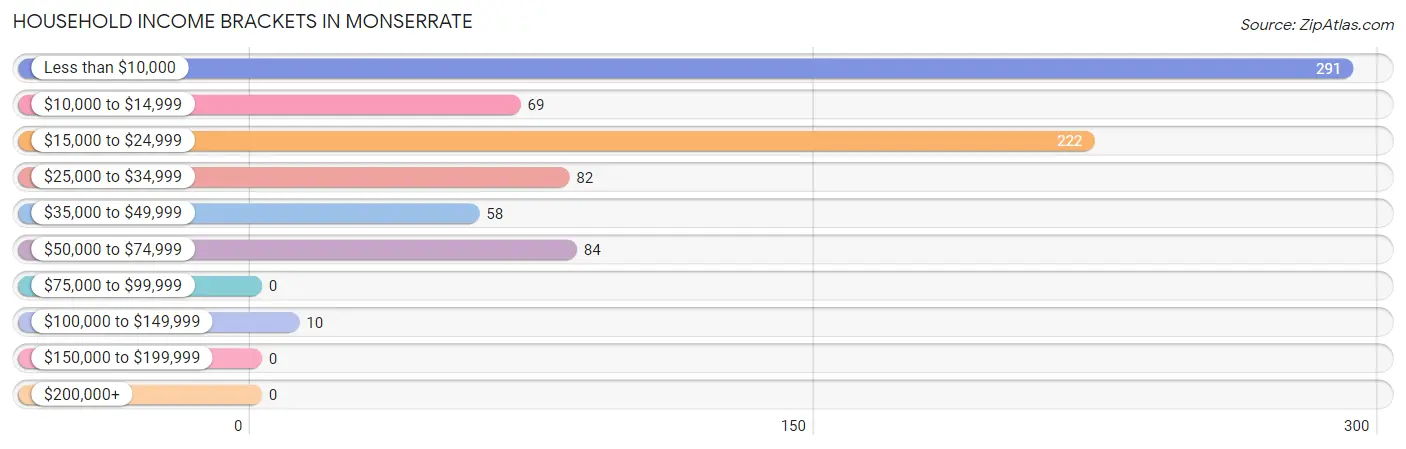
| Income Bracket | # Households | % Households |
| Less than $10,000 | 291 | 35.7% |
| $10,000 to $14,999 | 69 | 8.5% |
| $15,000 to $24,999 | 222 | 27.2% |
| $25,000 to $34,999 | 82 | 10.0% |
| $35,000 to $49,999 | 58 | 7.1% |
| $50,000 to $74,999 | 84 | 10.3% |
| $75,000 to $99,999 | 0 | 0.0% |
| $100,000 to $149,999 | 10 | 1.2% |
| $150,000 to $199,999 | 0 | 0.0% |
| $200,000+ | 0 | 0.0% |
Household Income by Householder Age in Monserrate
The median household income in Monserrate is $16,690, with the highest median household income of $18,709 found in the 65+ years age bracket for the primary householder. A total of 323 households (39.6%) fall into this category. Meanwhile, the 15 to 24 years age bracket for the primary householder has the lowest median household income of $0, with 61 households (7.5%) in this group.
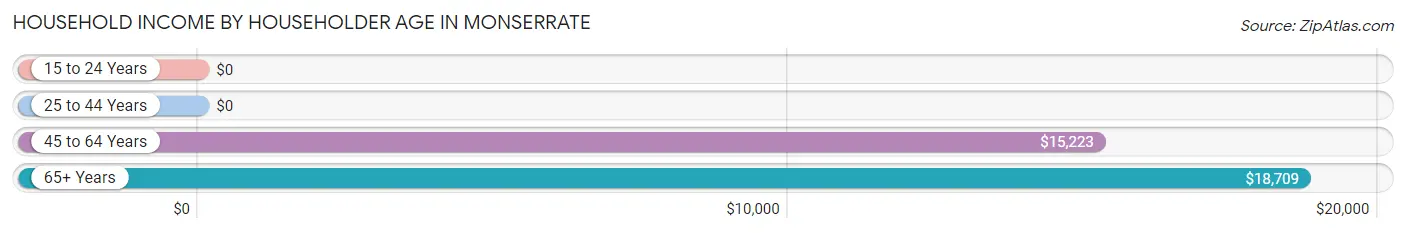
| Income Bracket | # Households | Median Income |
| 15 to 24 Years | 61 (7.5%) | $0 |
| 25 to 44 Years | 207 (25.4%) | $0 |
| 45 to 64 Years | 225 (27.6%) | $15,223 |
| 65+ Years | 323 (39.6%) | $18,709 |
| Total | 816 (100.0%) | $16,690 |
Poverty in Monserrate
Income Below Poverty by Sex and Age in Monserrate
With 49.0% poverty level for males and 64.3% for females among the residents of Monserrate, under 5 year old males and 6 to 11 year old females are the most vulnerable to poverty, with 72 males (100.0%) and 23 females (100.0%) in their respective age groups living below the poverty level.
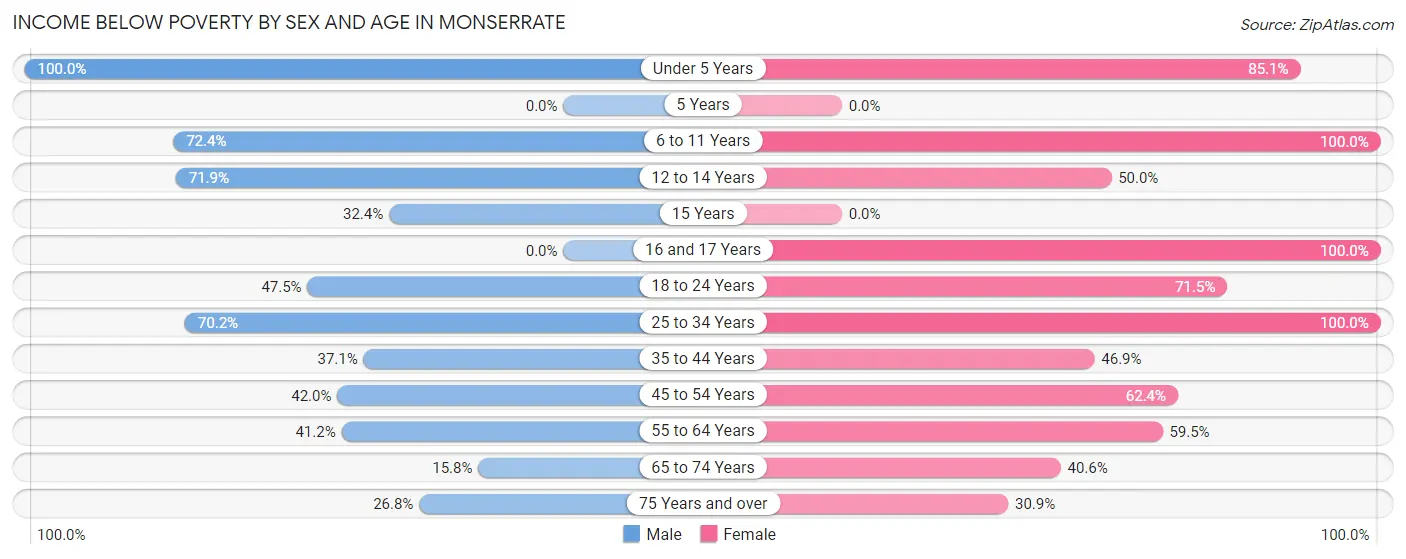
| Age Bracket | Male | Female |
| Under 5 Years | 72 (100.0%) | 120 (85.1%) |
| 5 Years | 0 (0.0%) | 0 (0.0%) |
| 6 to 11 Years | 42 (72.4%) | 23 (100.0%) |
| 12 to 14 Years | 41 (71.9%) | 21 (50.0%) |
| 15 Years | 11 (32.4%) | 0 (0.0%) |
| 16 and 17 Years | 0 (0.0%) | 54 (100.0%) |
| 18 to 24 Years | 19 (47.5%) | 176 (71.5%) |
| 25 to 34 Years | 118 (70.2%) | 143 (100.0%) |
| 35 to 44 Years | 33 (37.1%) | 75 (46.9%) |
| 45 to 54 Years | 60 (42.0%) | 58 (62.4%) |
| 55 to 64 Years | 35 (41.2%) | 50 (59.5%) |
| 65 to 74 Years | 21 (15.8%) | 54 (40.6%) |
| 75 Years and over | 19 (26.8%) | 50 (30.9%) |
| Total | 471 (49.0%) | 824 (64.3%) |
Income Above Poverty by Sex and Age in Monserrate
According to the poverty statistics in Monserrate, males aged 16 and 17 years and females aged 75 years and over are the age groups that are most secure financially, with 100.0% of males and 69.1% of females in these age groups living above the poverty line.
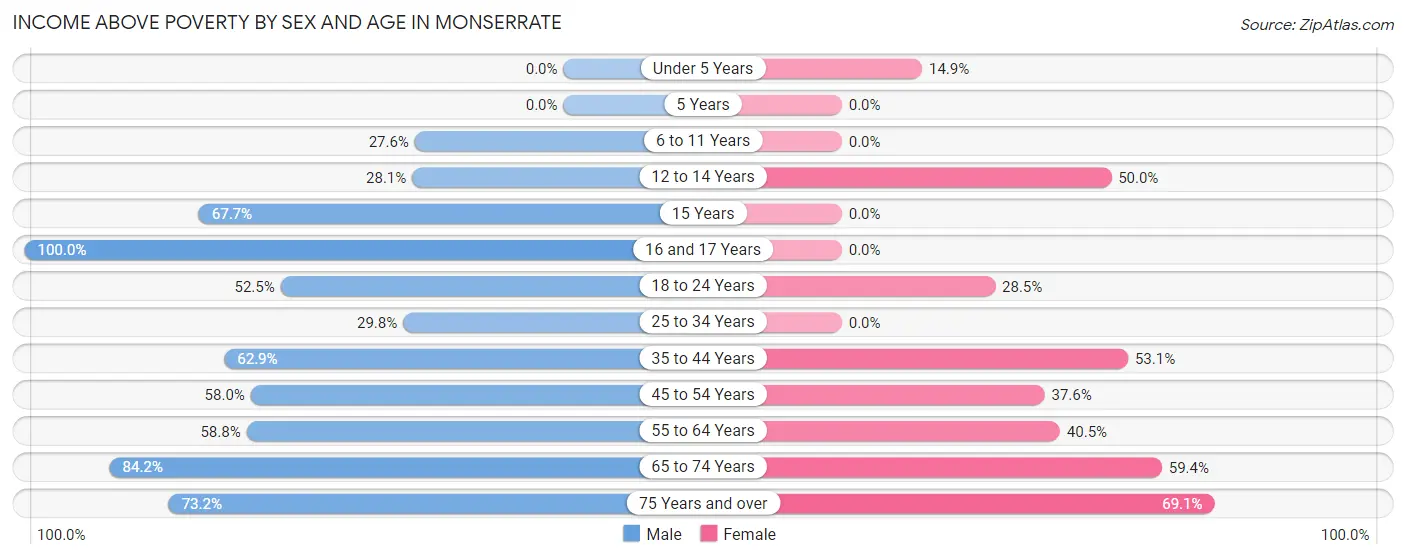
| Age Bracket | Male | Female |
| Under 5 Years | 0 (0.0%) | 21 (14.9%) |
| 5 Years | 0 (0.0%) | 0 (0.0%) |
| 6 to 11 Years | 16 (27.6%) | 0 (0.0%) |
| 12 to 14 Years | 16 (28.1%) | 21 (50.0%) |
| 15 Years | 23 (67.6%) | 0 (0.0%) |
| 16 and 17 Years | 12 (100.0%) | 0 (0.0%) |
| 18 to 24 Years | 21 (52.5%) | 70 (28.5%) |
| 25 to 34 Years | 50 (29.8%) | 0 (0.0%) |
| 35 to 44 Years | 56 (62.9%) | 85 (53.1%) |
| 45 to 54 Years | 83 (58.0%) | 35 (37.6%) |
| 55 to 64 Years | 50 (58.8%) | 34 (40.5%) |
| 65 to 74 Years | 112 (84.2%) | 79 (59.4%) |
| 75 Years and over | 52 (73.2%) | 112 (69.1%) |
| Total | 491 (51.0%) | 457 (35.7%) |
Income Below Poverty Among Married-Couple Families in Monserrate
The poverty statistics for married-couple families in Monserrate show that 31.4% or 87 of the total 277 families live below the poverty line. Families with 1 or 2 children have the highest poverty rate of 40.3%, comprising of 29 families. On the other hand, families with no children have the lowest poverty rate of 28.3%, which includes 58 families.
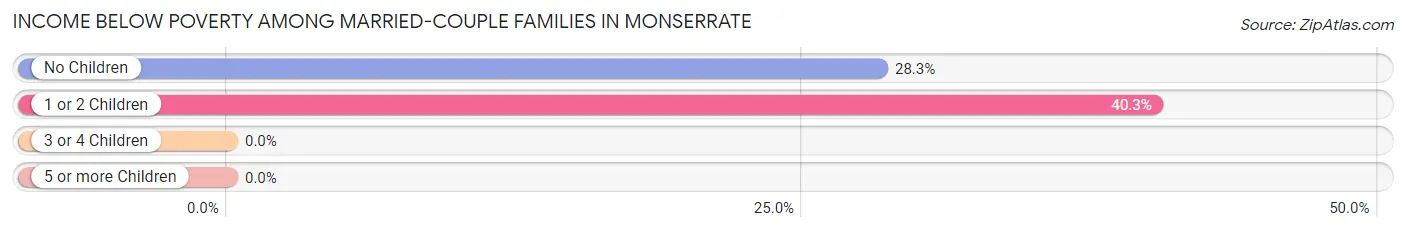
| Children | Above Poverty | Below Poverty |
| No Children | 147 (71.7%) | 58 (28.3%) |
| 1 or 2 Children | 43 (59.7%) | 29 (40.3%) |
| 3 or 4 Children | 0 (0.0%) | 0 (0.0%) |
| 5 or more Children | 0 (0.0%) | 0 (0.0%) |
| Total | 190 (68.6%) | 87 (31.4%) |
Income Below Poverty Among Single-Parent Households in Monserrate
According to the poverty data in Monserrate, 64.0% or 71 single-father households and 89.4% or 178 single-mother households are living below the poverty line. Among single-father households, those with no children have the highest poverty rate, with 26 households (100.0%) experiencing poverty. Likewise, among single-mother households, those with 1 or 2 children have the highest poverty rate, with 134 households (100.0%) falling below the poverty line.
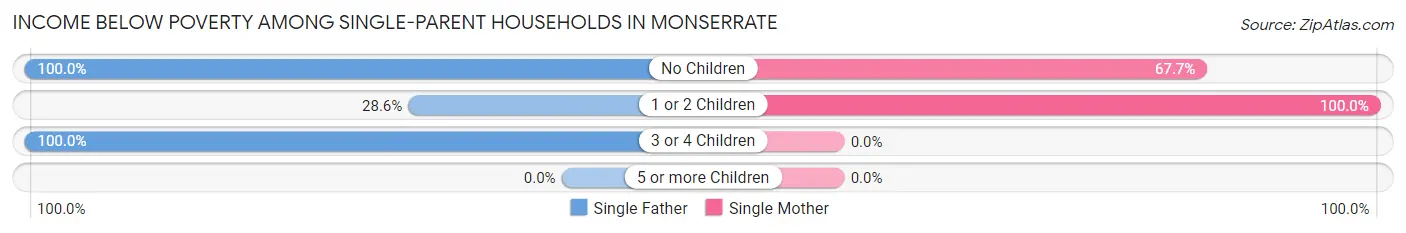
| Children | Single Father | Single Mother |
| No Children | 26 (100.0%) | 44 (67.7%) |
| 1 or 2 Children | 16 (28.6%) | 134 (100.0%) |
| 3 or 4 Children | 29 (100.0%) | 0 (0.0%) |
| 5 or more Children | 0 (0.0%) | 0 (0.0%) |
| Total | 71 (64.0%) | 178 (89.4%) |
Income Below Poverty Among Married-Couple vs Single-Parent Households in Monserrate
The poverty data for Monserrate shows that 87 of the married-couple family households (31.4%) and 249 of the single-parent households (80.3%) are living below the poverty level. Within the married-couple family households, those with 1 or 2 children have the highest poverty rate, with 29 households (40.3%) falling below the poverty line. Among the single-parent households, those with 3 or 4 children have the highest poverty rate, with 29 household (100.0%) living below poverty.
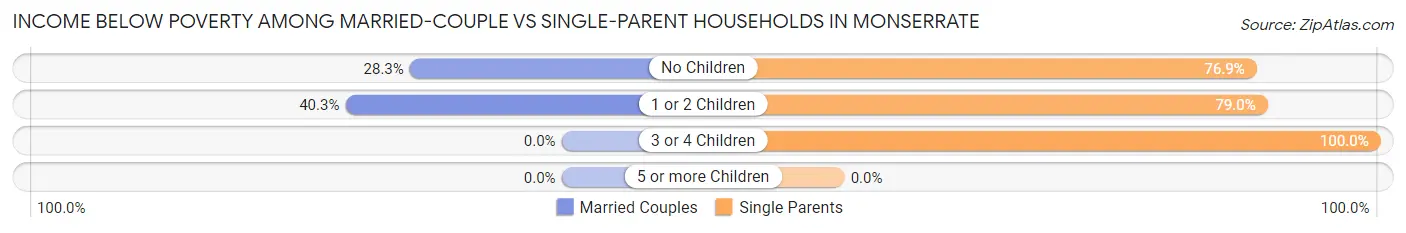
| Children | Married-Couple Families | Single-Parent Households |
| No Children | 58 (28.3%) | 70 (76.9%) |
| 1 or 2 Children | 29 (40.3%) | 150 (78.9%) |
| 3 or 4 Children | 0 (0.0%) | 29 (100.0%) |
| 5 or more Children | 0 (0.0%) | 0 (0.0%) |
| Total | 87 (31.4%) | 249 (80.3%) |
Race in Monserrate
The most populous races in Monserrate are Hispanic or Latino (2,193 | 96.8%), White / Caucasian (914 | 40.3%), and Two or more Races (633 | 27.9%).
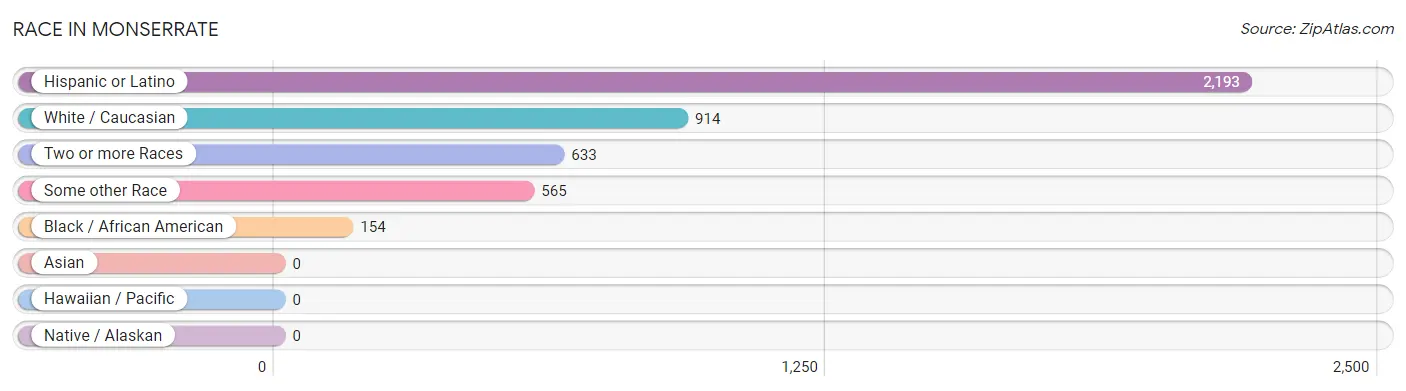
| Race | # Population | % Population |
| Asian | 0 | 0.0% |
| Black / African American | 154 | 6.8% |
| Hawaiian / Pacific | 0 | 0.0% |
| Hispanic or Latino | 2,193 | 96.8% |
| Native / Alaskan | 0 | 0.0% |
| White / Caucasian | 914 | 40.3% |
| Two or more Races | 633 | 27.9% |
| Some other Race | 565 | 24.9% |
| Total | 2,266 | 100.0% |
Ancestry in Monserrate
The most populous ancestries reported in Monserrate are Puerto Rican (2,154 | 95.1%), American (28 | 1.2%), Dominican (20 | 0.9%), Cuban (19 | 0.8%), and Bhutanese (11 | 0.5%), together accounting for 98.5% of all Monserrate residents.
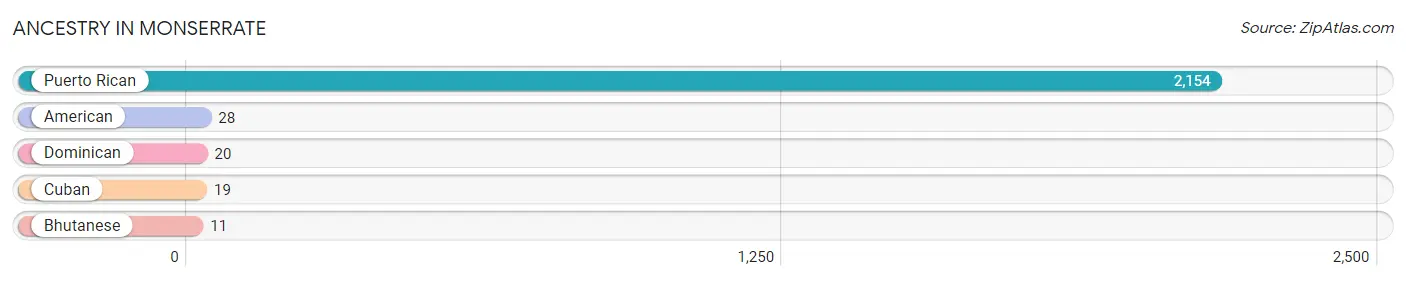
| Ancestry | # Population | % Population |
| American | 28 | 1.2% |
| Bhutanese | 11 | 0.5% |
| Cuban | 19 | 0.8% |
| Dominican | 20 | 0.9% |
| Puerto Rican | 2,154 | 95.1% | View All 5 Rows |
Immigrants in Monserrate

| Immigration Origin | # Population | % Population | View All 0 Rows |
Sex and Age in Monserrate
Sex and Age in Monserrate
The most populous age groups in Monserrate are 10 to 14 Years (93 | 9.7%) for men and 15 to 19 Years (179 | 13.7%) for women.
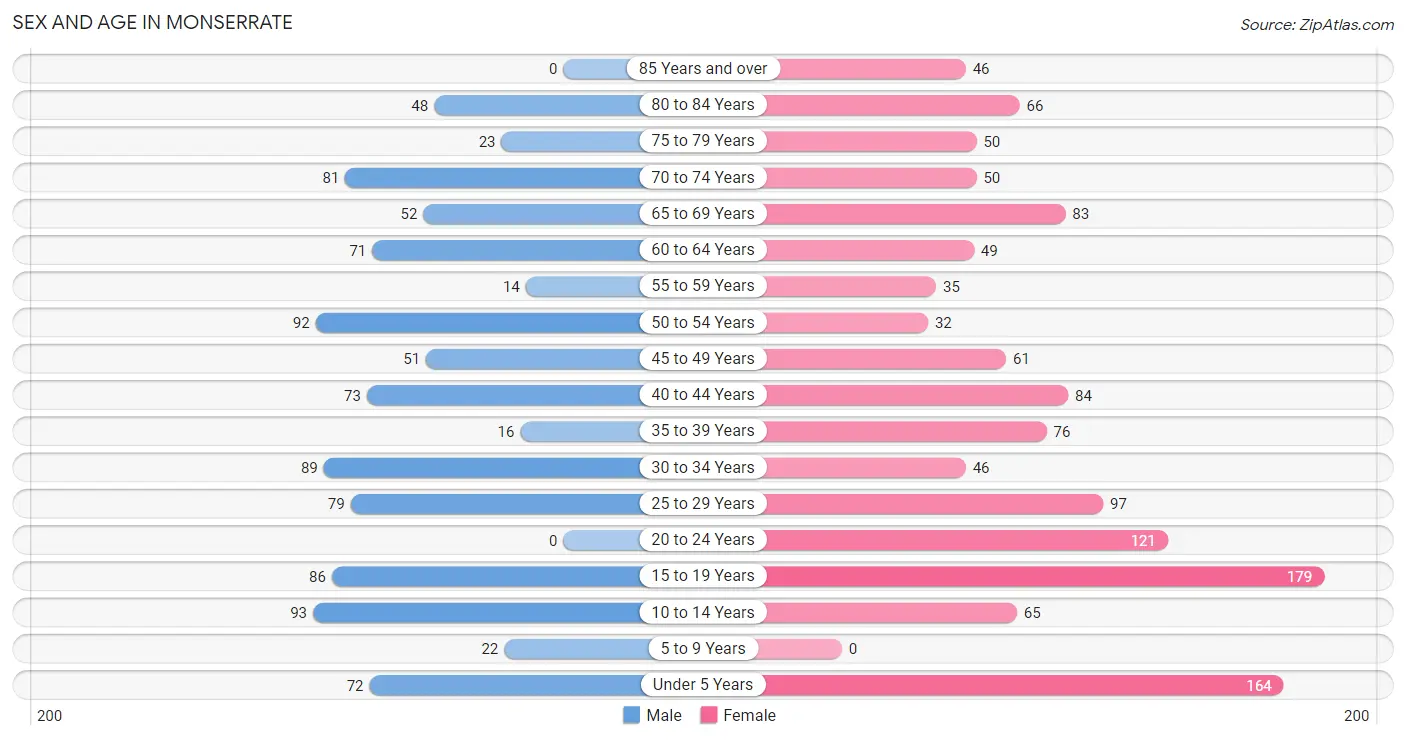
| Age Bracket | Male | Female |
| Under 5 Years | 72 (7.5%) | 164 (12.6%) |
| 5 to 9 Years | 22 (2.3%) | 0 (0.0%) |
| 10 to 14 Years | 93 (9.7%) | 65 (5.0%) |
| 15 to 19 Years | 86 (8.9%) | 179 (13.7%) |
| 20 to 24 Years | 0 (0.0%) | 121 (9.3%) |
| 25 to 29 Years | 79 (8.2%) | 97 (7.4%) |
| 30 to 34 Years | 89 (9.2%) | 46 (3.5%) |
| 35 to 39 Years | 16 (1.7%) | 76 (5.8%) |
| 40 to 44 Years | 73 (7.6%) | 84 (6.4%) |
| 45 to 49 Years | 51 (5.3%) | 61 (4.7%) |
| 50 to 54 Years | 92 (9.6%) | 32 (2.5%) |
| 55 to 59 Years | 14 (1.5%) | 35 (2.7%) |
| 60 to 64 Years | 71 (7.4%) | 49 (3.8%) |
| 65 to 69 Years | 52 (5.4%) | 83 (6.4%) |
| 70 to 74 Years | 81 (8.4%) | 50 (3.8%) |
| 75 to 79 Years | 23 (2.4%) | 50 (3.8%) |
| 80 to 84 Years | 48 (5.0%) | 66 (5.1%) |
| 85 Years and over | 0 (0.0%) | 46 (3.5%) |
| Total | 962 (100.0%) | 1,304 (100.0%) |
Families and Households in Monserrate
Median Family Size in Monserrate
The median family size in Monserrate is 3.23 persons per family, with single male/father families (111 | 18.9%) accounting for the largest median family size of 3.44 persons per family. On the other hand, single female/mother families (199 | 33.9%) represent the smallest median family size with 2.98 persons per family.
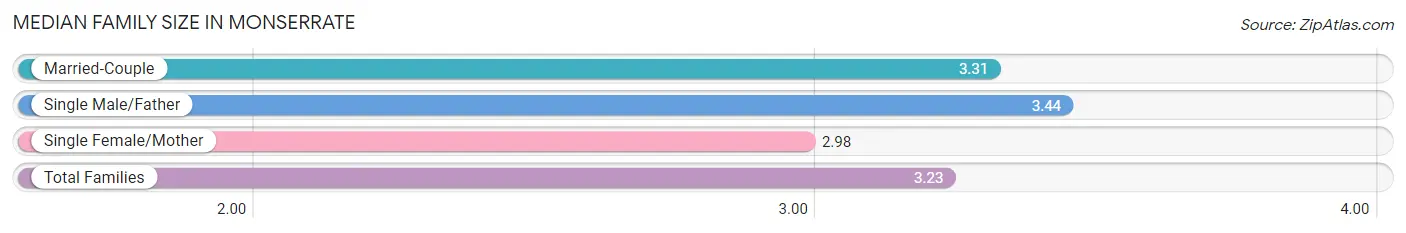
| Family Type | # Families | Family Size |
| Married-Couple | 277 (47.2%) | 3.31 |
| Single Male/Father | 111 (18.9%) | 3.44 |
| Single Female/Mother | 199 (33.9%) | 2.98 |
| Total Families | 587 (100.0%) | 3.23 |
Median Household Size in Monserrate
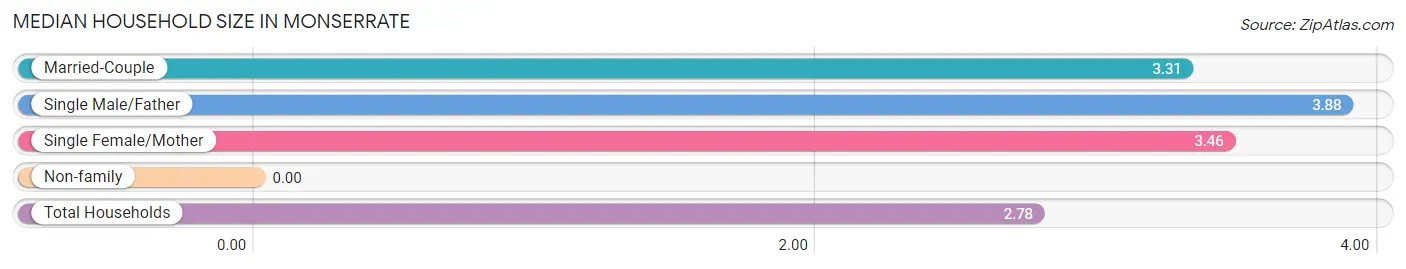
| Household Type | # Households | Household Size |
| Married-Couple | 277 (34.0%) | 3.31 |
| Single Male/Father | 111 (13.6%) | 3.88 |
| Single Female/Mother | 199 (24.4%) | 3.46 |
| Non-family | 229 (28.1%) | - |
| Total Households | 816 (100.0%) | 2.78 |
Household Size by Marriage Status in Monserrate
Out of a total of 816 households in Monserrate, 587 (71.9%) are family households, while 229 (28.1%) are nonfamily households. The most numerous type of family households are 2-person households, comprising 293, and the most common type of nonfamily households are 1-person households, comprising 229.
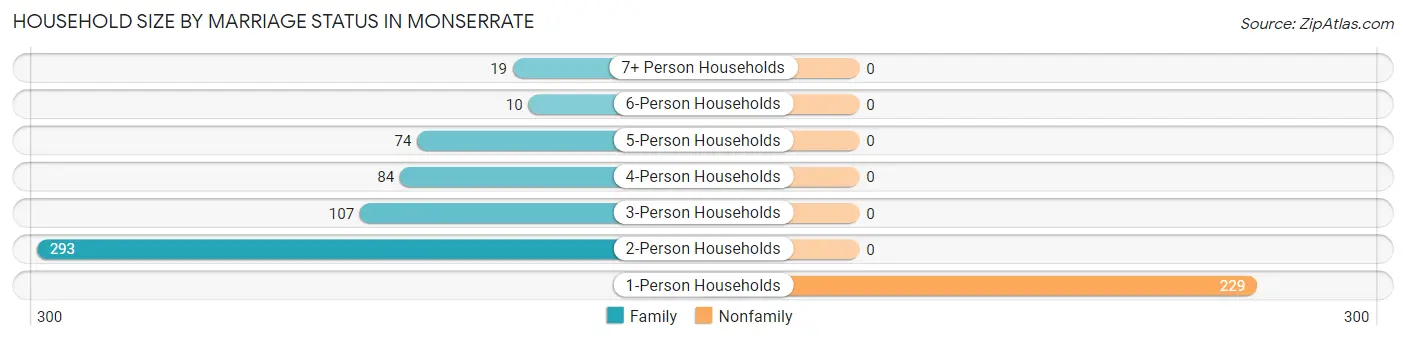
| Household Size | Family Households | Nonfamily Households |
| 1-Person Households | - | 229 (28.1%) |
| 2-Person Households | 293 (35.9%) | 0 (0.0%) |
| 3-Person Households | 107 (13.1%) | 0 (0.0%) |
| 4-Person Households | 84 (10.3%) | 0 (0.0%) |
| 5-Person Households | 74 (9.1%) | 0 (0.0%) |
| 6-Person Households | 10 (1.2%) | 0 (0.0%) |
| 7+ Person Households | 19 (2.3%) | 0 (0.0%) |
| Total | 587 (71.9%) | 229 (28.1%) |
Female Fertility in Monserrate
Fertility by Age in Monserrate
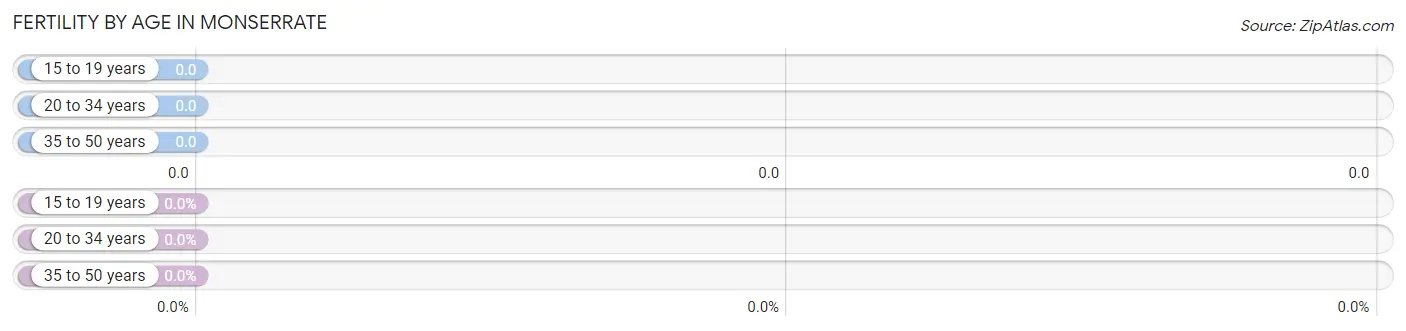
| Age Bracket | Women with Births | Births / 1,000 Women |
| 15 to 19 years | 0 (0.0%) | 0.0 |
| 20 to 34 years | 0 (0.0%) | 0.0 |
| 35 to 50 years | 0 (0.0%) | 0.0 |
| Total | 0 (0.0%) | 0.0 |
Fertility by Age by Marriage Status in Monserrate
| Age Bracket | Married | Unmarried |
| 15 to 19 years | 0 (0.0%) | 0 (0.0%) |
| 20 to 34 years | 0 (0.0%) | 0 (0.0%) |
| 35 to 50 years | 0 (0.0%) | 0 (0.0%) |
| Total | 0 (0.0%) | 0 (0.0%) |
Fertility by Education in Monserrate
| Educational Attainment | Women with Births | Births / 1,000 Women |
| Less than High School | 0 (0.0%) | 0.0 |
| High School Diploma | 0 (0.0%) | 0.0 |
| College or Associate's Degree | 0 (0.0%) | 0.0 |
| Bachelor's Degree | 0 (0.0%) | 0.0 |
| Graduate Degree | 0 (0.0%) | 0.0 |
| Total | 0 (0.0%) | 0.0 |
Fertility by Education by Marriage Status in Monserrate
| Educational Attainment | Married | Unmarried |
| Less than High School | 0 (0.0%) | 0 (0.0%) |
| High School Diploma | 0 (0.0%) | 0 (0.0%) |
| College or Associate's Degree | 0 (0.0%) | 0 (0.0%) |
| Bachelor's Degree | 0 (0.0%) | 0 (0.0%) |
| Graduate Degree | 0 (0.0%) | 0 (0.0%) |
| Total | 0 (0.0%) | 0 (0.0%) |
Employment Characteristics in Monserrate
Employment by Class of Employer in Monserrate
Among the 590 employed individuals in Monserrate, private company employees (486 | 82.4%), self-employed (not incorporated) (52 | 8.8%), and self-employed (incorporated) (20 | 3.4%) make up the most common classes of employment.
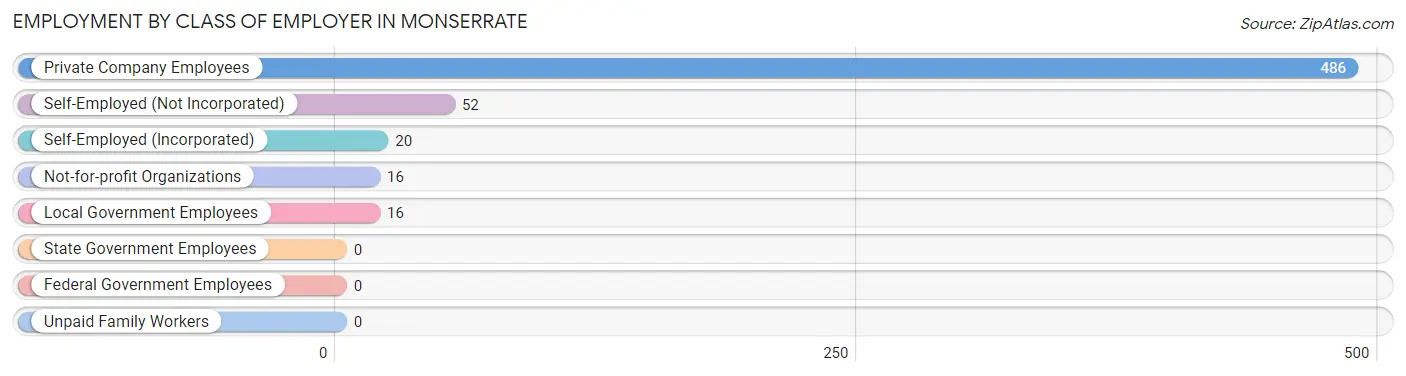
| Employer Class | # Employees | % Employees |
| Private Company Employees | 486 | 82.4% |
| Self-Employed (Incorporated) | 20 | 3.4% |
| Self-Employed (Not Incorporated) | 52 | 8.8% |
| Not-for-profit Organizations | 16 | 2.7% |
| Local Government Employees | 16 | 2.7% |
| State Government Employees | 0 | 0.0% |
| Federal Government Employees | 0 | 0.0% |
| Unpaid Family Workers | 0 | 0.0% |
| Total | 590 | 100.0% |
Employment Status by Age in Monserrate
According to the labor force statistics for Monserrate, out of the total population over 16 years of age (1,816), 40.6% or 737 individuals are in the labor force, with 20.1% or 148 of them unemployed. The age group with the highest labor force participation rate is 20 to 24 years, with 77.7% or 94 individuals in the labor force. Within the labor force, the 30 to 34 years age range has the highest percentage of unemployed individuals, with 64.0% or 57 of them being unemployed.
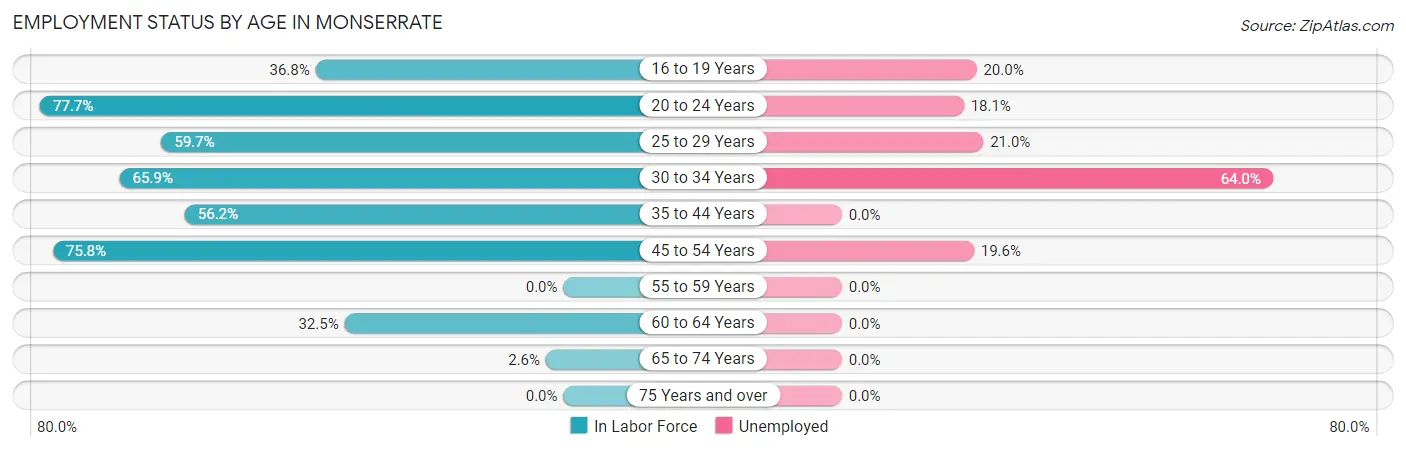
| Age Bracket | In Labor Force | Unemployed |
| 16 to 19 Years | 85 (36.8%) | 17 (20.0%) |
| 20 to 24 Years | 94 (77.7%) | 17 (18.1%) |
| 25 to 29 Years | 105 (59.7%) | 22 (21.0%) |
| 30 to 34 Years | 89 (65.9%) | 57 (64.0%) |
| 35 to 44 Years | 140 (56.2%) | 0 (0.0%) |
| 45 to 54 Years | 179 (75.8%) | 35 (19.6%) |
| 55 to 59 Years | 0 (0.0%) | 0 (0.0%) |
| 60 to 64 Years | 39 (32.5%) | 0 (0.0%) |
| 65 to 74 Years | 7 (2.6%) | 0 (0.0%) |
| 75 Years and over | 0 (0.0%) | 0 (0.0%) |
| Total | 737 (40.6%) | 148 (20.1%) |
Employment Status by Educational Attainment in Monserrate
According to labor force statistics for Monserrate, 57.2% of individuals (552) out of the total population between 25 and 64 years of age (965) are in the labor force, with 20.7% or 114 of them being unemployed. The group with the highest labor force participation rate are those with the educational attainment of bachelor's degree or higher, with 100.0% or 85 individuals in the labor force. Within the labor force, individuals with less than high school education have the highest percentage of unemployment, with 78.4% or 40 of them being unemployed.
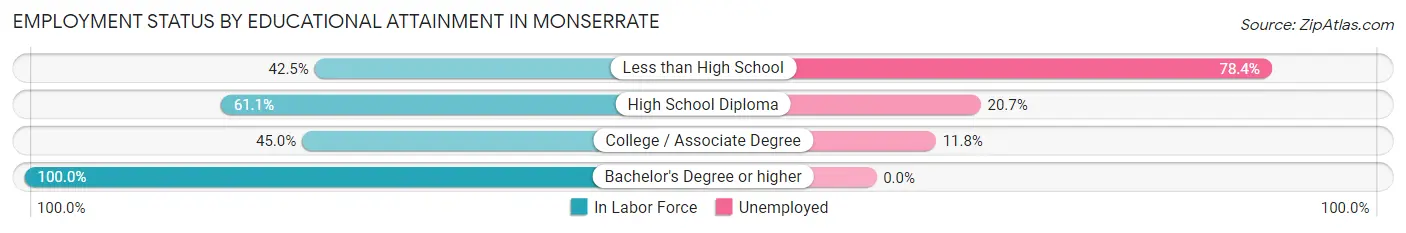
| Educational Attainment | In Labor Force | Unemployed |
| Less than High School | 51 (42.5%) | 94 (78.4%) |
| High School Diploma | 280 (61.1%) | 95 (20.7%) |
| College / Associate Degree | 136 (45.0%) | 36 (11.8%) |
| Bachelor's Degree or higher | 85 (100.0%) | 0 (0.0%) |
| Total | 552 (57.2%) | 200 (20.7%) |
Employment Occupations by Sex in Monserrate
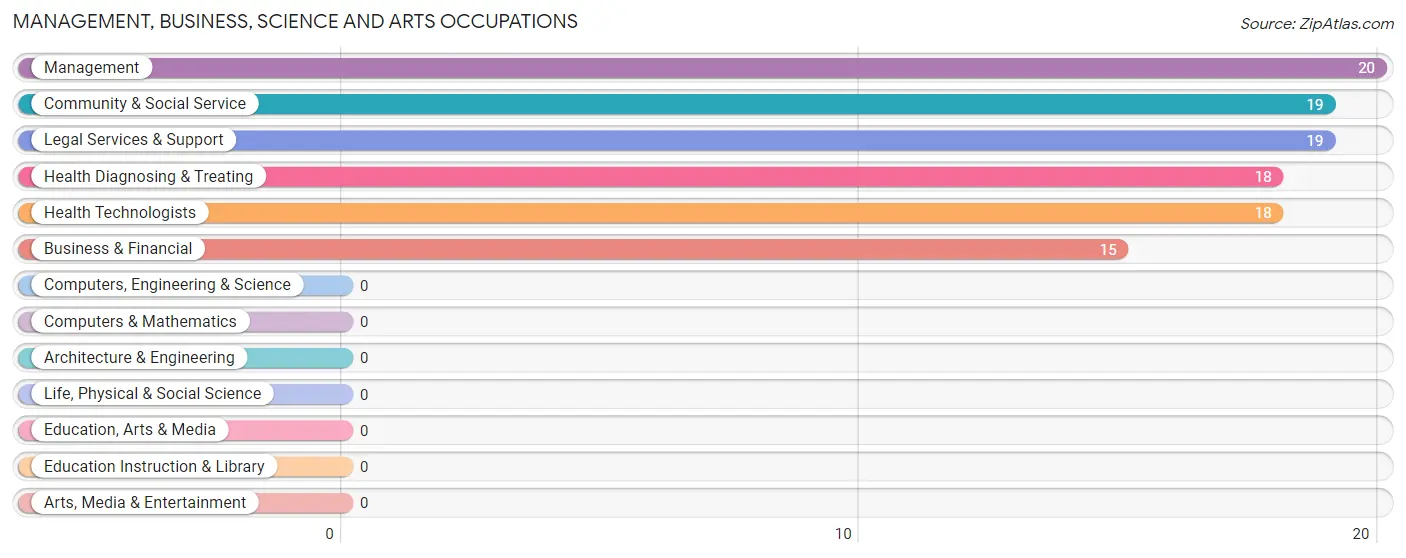
Management, Business, Science and Arts Occupations
The most common Management, Business, Science and Arts occupations in Monserrate are Management (20 | 3.4%), Community & Social Service (19 | 3.2%), Legal Services & Support (19 | 3.2%), Health Diagnosing & Treating (18 | 3.0%), and Health Technologists (18 | 3.0%).
Management, Business, Science and Arts Occupations by Sex
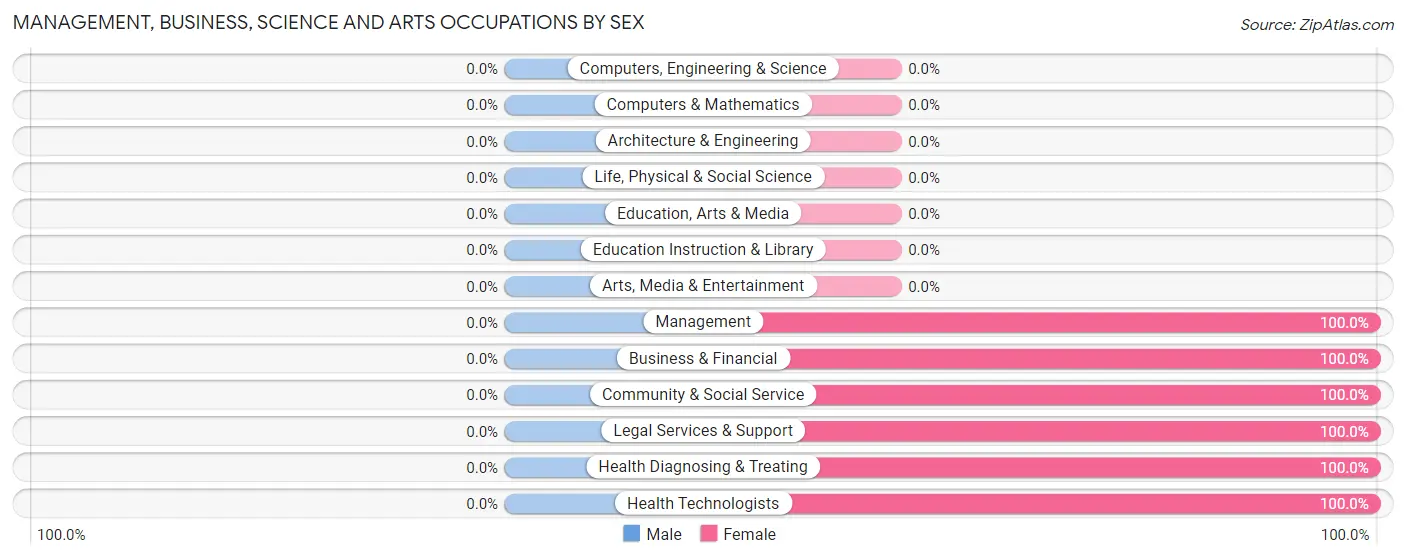
| Occupation | Male | Female |
| Management | 0 (0.0%) | 20 (100.0%) |
| Business & Financial | 0 (0.0%) | 15 (100.0%) |
| Computers, Engineering & Science | 0 (0.0%) | 0 (0.0%) |
| Computers & Mathematics | 0 (0.0%) | 0 (0.0%) |
| Architecture & Engineering | 0 (0.0%) | 0 (0.0%) |
| Life, Physical & Social Science | 0 (0.0%) | 0 (0.0%) |
| Community & Social Service | 0 (0.0%) | 19 (100.0%) |
| Education, Arts & Media | 0 (0.0%) | 0 (0.0%) |
| Legal Services & Support | 0 (0.0%) | 19 (100.0%) |
| Education Instruction & Library | 0 (0.0%) | 0 (0.0%) |
| Arts, Media & Entertainment | 0 (0.0%) | 0 (0.0%) |
| Health Diagnosing & Treating | 0 (0.0%) | 18 (100.0%) |
| Health Technologists | 0 (0.0%) | 18 (100.0%) |
| Total (Category) | 0 (0.0%) | 72 (100.0%) |
| Total (Overall) | 267 (45.3%) | 323 (54.7%) |
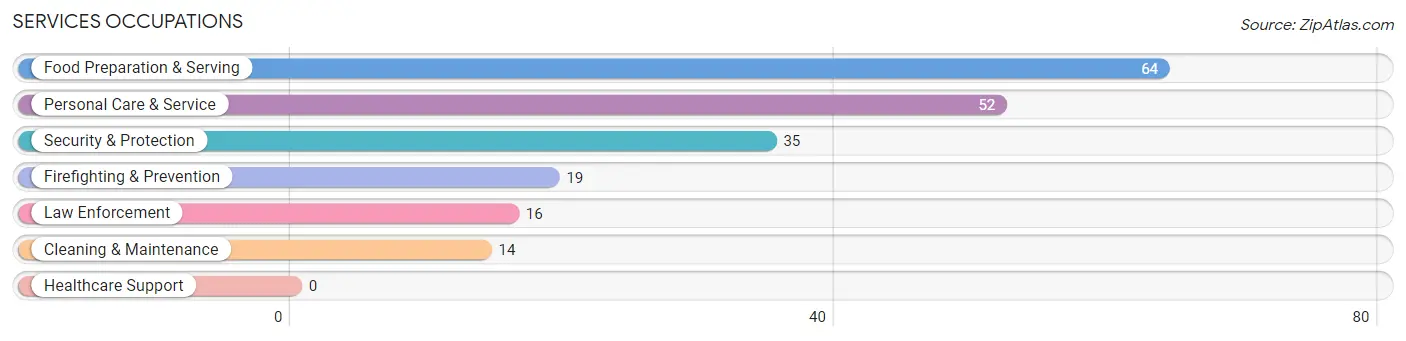
Services Occupations
The most common Services occupations in Monserrate are Food Preparation & Serving (64 | 10.8%), Personal Care & Service (52 | 8.8%), Security & Protection (35 | 5.9%), Firefighting & Prevention (19 | 3.2%), and Law Enforcement (16 | 2.7%).
Services Occupations by Sex
Within the Services occupations in Monserrate, the most male-oriented occupations are Security & Protection (100.0%), Firefighting & Prevention (100.0%), and Law Enforcement (100.0%), while the most female-oriented occupations are Food Preparation & Serving (100.0%), Cleaning & Maintenance (100.0%), and Personal Care & Service (100.0%).
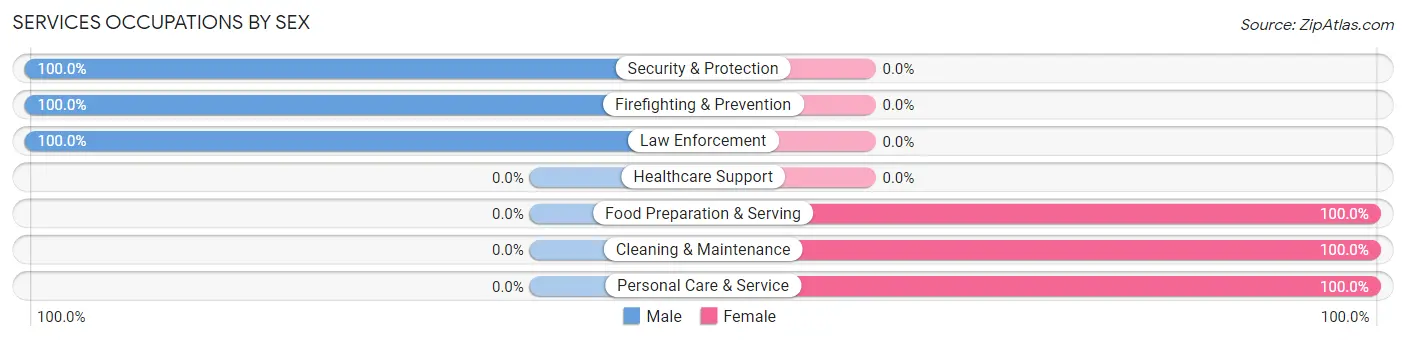
| Occupation | Male | Female |
| Healthcare Support | 0 (0.0%) | 0 (0.0%) |
| Security & Protection | 35 (100.0%) | 0 (0.0%) |
| Firefighting & Prevention | 19 (100.0%) | 0 (0.0%) |
| Law Enforcement | 16 (100.0%) | 0 (0.0%) |
| Food Preparation & Serving | 0 (0.0%) | 64 (100.0%) |
| Cleaning & Maintenance | 0 (0.0%) | 14 (100.0%) |
| Personal Care & Service | 0 (0.0%) | 52 (100.0%) |
| Total (Category) | 35 (21.2%) | 130 (78.8%) |
| Total (Overall) | 267 (45.3%) | 323 (54.7%) |
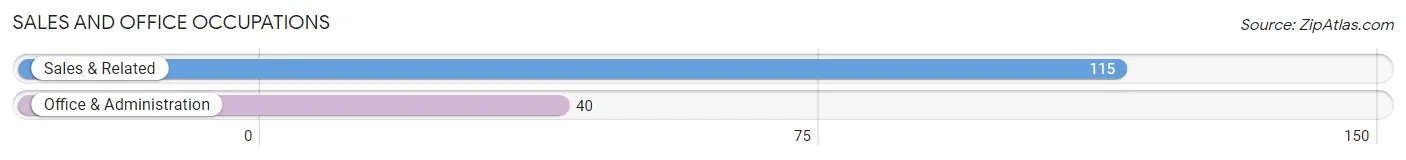
Sales and Office Occupations
The most common Sales and Office occupations in Monserrate are Sales & Related (115 | 19.5%), and Office & Administration (40 | 6.8%).
Sales and Office Occupations by Sex
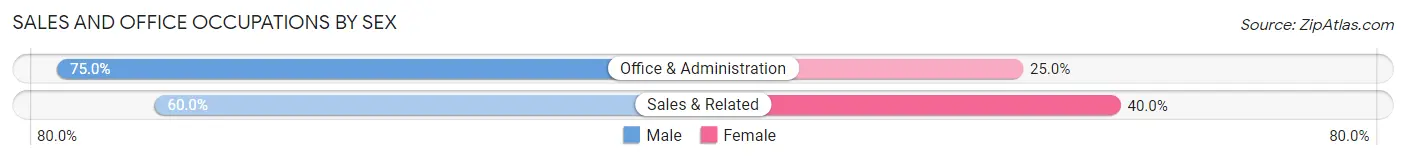
| Occupation | Male | Female |
| Sales & Related | 69 (60.0%) | 46 (40.0%) |
| Office & Administration | 30 (75.0%) | 10 (25.0%) |
| Total (Category) | 99 (63.9%) | 56 (36.1%) |
| Total (Overall) | 267 (45.3%) | 323 (54.7%) |
Natural Resources, Construction and Maintenance Occupations
The most common Natural Resources, Construction and Maintenance occupations in Monserrate are Construction & Extraction (51 | 8.6%), Installation, Maintenance & Repair (51 | 8.6%), and Farming, Fishing & Forestry (14 | 2.4%).
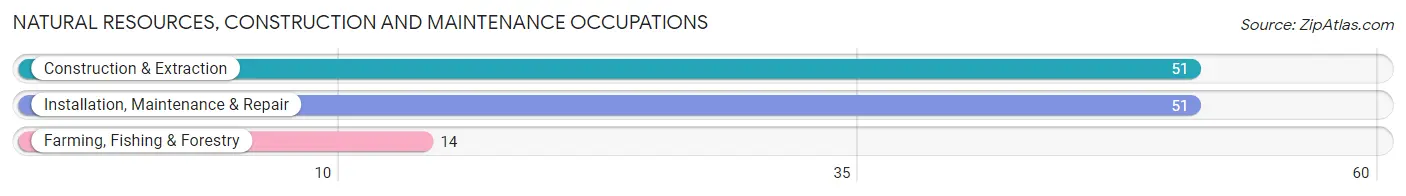
Natural Resources, Construction and Maintenance Occupations by Sex
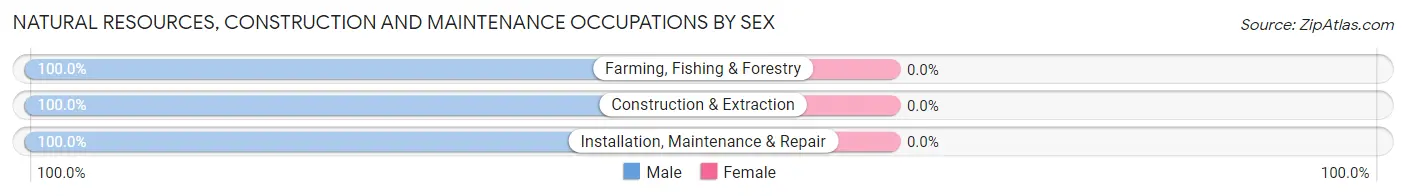
| Occupation | Male | Female |
| Farming, Fishing & Forestry | 14 (100.0%) | 0 (0.0%) |
| Construction & Extraction | 51 (100.0%) | 0 (0.0%) |
| Installation, Maintenance & Repair | 51 (100.0%) | 0 (0.0%) |
| Total (Category) | 116 (100.0%) | 0 (0.0%) |
| Total (Overall) | 267 (45.3%) | 323 (54.7%) |
Production, Transportation and Moving Occupations
The most common Production, Transportation and Moving occupations in Monserrate are Production (54 | 9.1%), and Transportation (28 | 4.8%).
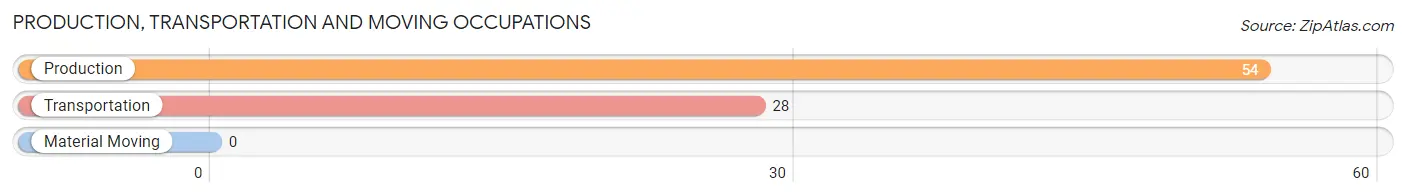
Production, Transportation and Moving Occupations by Sex
| Occupation | Male | Female |
| Production | 0 (0.0%) | 54 (100.0%) |
| Transportation | 17 (60.7%) | 11 (39.3%) |
| Material Moving | 0 (0.0%) | 0 (0.0%) |
| Total (Category) | 17 (20.7%) | 65 (79.3%) |
| Total (Overall) | 267 (45.3%) | 323 (54.7%) |
Employment Industries by Sex in Monserrate
Employment Industries in Monserrate
The major employment industries in Monserrate include Retail Trade (126 | 21.4%), Accommodation & Food Services (75 | 12.7%), Administrative & Support (57 | 9.7%), Health Care & Social Assistance (52 | 8.8%), and Construction (46 | 7.8%).
Employment Industries by Sex in Monserrate
The Monserrate industries that see more men than women are Construction (100.0%), Professional & Scientific (100.0%), and Public Administration (100.0%), whereas the industries that tend to have a higher number of women are Manufacturing (100.0%), Finance & Insurance (100.0%), and Accommodation & Food Services (100.0%).
| Industry | Male | Female |
| Agriculture, Fishing & Hunting | 0 (0.0%) | 0 (0.0%) |
| Mining, Quarrying, & Extraction | 0 (0.0%) | 0 (0.0%) |
| Construction | 46 (100.0%) | 0 (0.0%) |
| Manufacturing | 0 (0.0%) | 34 (100.0%) |
| Wholesale Trade | 29 (64.4%) | 16 (35.6%) |
| Retail Trade | 57 (45.2%) | 69 (54.8%) |
| Transportation & Warehousing | 0 (0.0%) | 0 (0.0%) |
| Utilities | 0 (0.0%) | 0 (0.0%) |
| Information | 0 (0.0%) | 0 (0.0%) |
| Finance & Insurance | 0 (0.0%) | 15 (100.0%) |
| Real Estate, Rental & Leasing | 0 (0.0%) | 0 (0.0%) |
| Professional & Scientific | 16 (100.0%) | 0 (0.0%) |
| Enterprise Management | 0 (0.0%) | 0 (0.0%) |
| Administrative & Support | 33 (57.9%) | 24 (42.1%) |
| Educational Services | 0 (0.0%) | 0 (0.0%) |
| Health Care & Social Assistance | 14 (26.9%) | 38 (73.1%) |
| Arts, Entertainment & Recreation | 0 (0.0%) | 0 (0.0%) |
| Accommodation & Food Services | 0 (0.0%) | 75 (100.0%) |
| Public Administration | 16 (100.0%) | 0 (0.0%) |
| Total | 267 (45.3%) | 323 (54.7%) |
Education in Monserrate
School Enrollment in Monserrate
The most common levels of schooling among the 449 students in Monserrate are high school (171 | 38.1%), middle school (131 | 29.2%), and college / undergraduate (90 | 20.0%).
| School Level | # Students | % Students |
| Nursery / Preschool | 25 | 5.6% |
| Kindergarten | 0 | 0.0% |
| Elementary School | 22 | 4.9% |
| Middle School | 131 | 29.2% |
| High School | 171 | 38.1% |
| College / Undergraduate | 90 | 20.0% |
| Graduate / Professional | 10 | 2.2% |
| Total | 449 | 100.0% |
School Enrollment by Age by Funding Source in Monserrate
Out of a total of 449 students who are enrolled in schools in Monserrate, 140 (31.2%) attend a private institution, while the remaining 309 (68.8%) are enrolled in public schools. The age group of 20 to 24 year olds has the highest likelihood of being enrolled in private schools, with 20 (58.8% in the age bracket) enrolled. Conversely, the age group of 3 to 4 year olds has the lowest likelihood of being enrolled in a private school, with 25 (100.0% in the age bracket) attending a public institution.
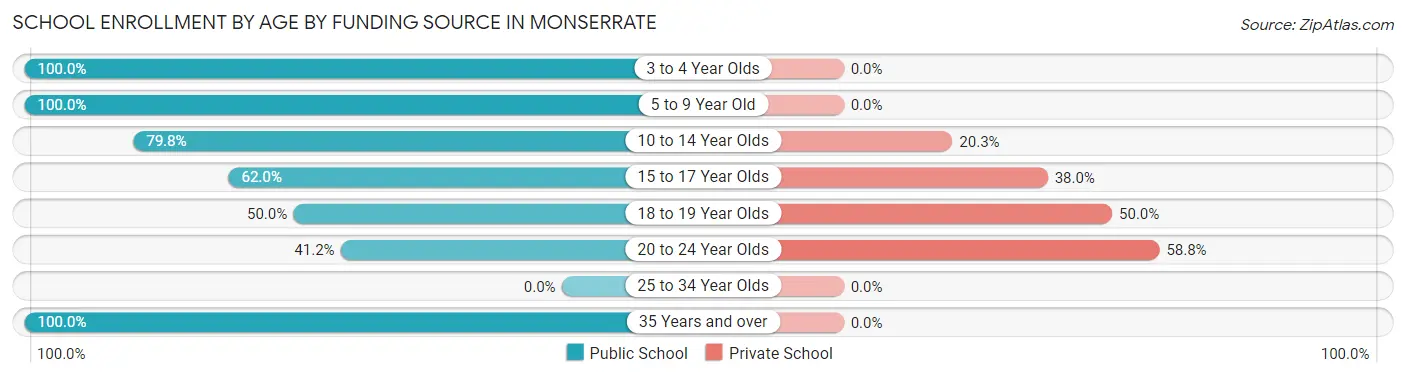
| Age Bracket | Public School | Private School |
| 3 to 4 Year Olds | 25 (100.0%) | 0 (0.0%) |
| 5 to 9 Year Old | 22 (100.0%) | 0 (0.0%) |
| 10 to 14 Year Olds | 126 (79.7%) | 32 (20.3%) |
| 15 to 17 Year Olds | 62 (62.0%) | 38 (38.0%) |
| 18 to 19 Year Olds | 50 (50.0%) | 50 (50.0%) |
| 20 to 24 Year Olds | 14 (41.2%) | 20 (58.8%) |
| 25 to 34 Year Olds | 0 (0.0%) | 0 (0.0%) |
| 35 Years and over | 10 (100.0%) | 0 (0.0%) |
| Total | 309 (68.8%) | 140 (31.2%) |
Educational Attainment by Field of Study in Monserrate
Arts & humanities (38 | 23.7%), education (34 | 21.2%), business (30 | 18.8%), science & technology (22 | 13.8%), and social sciences (19 | 11.9%) are the most common fields of study among 160 individuals in Monserrate who have obtained a bachelor's degree or higher.
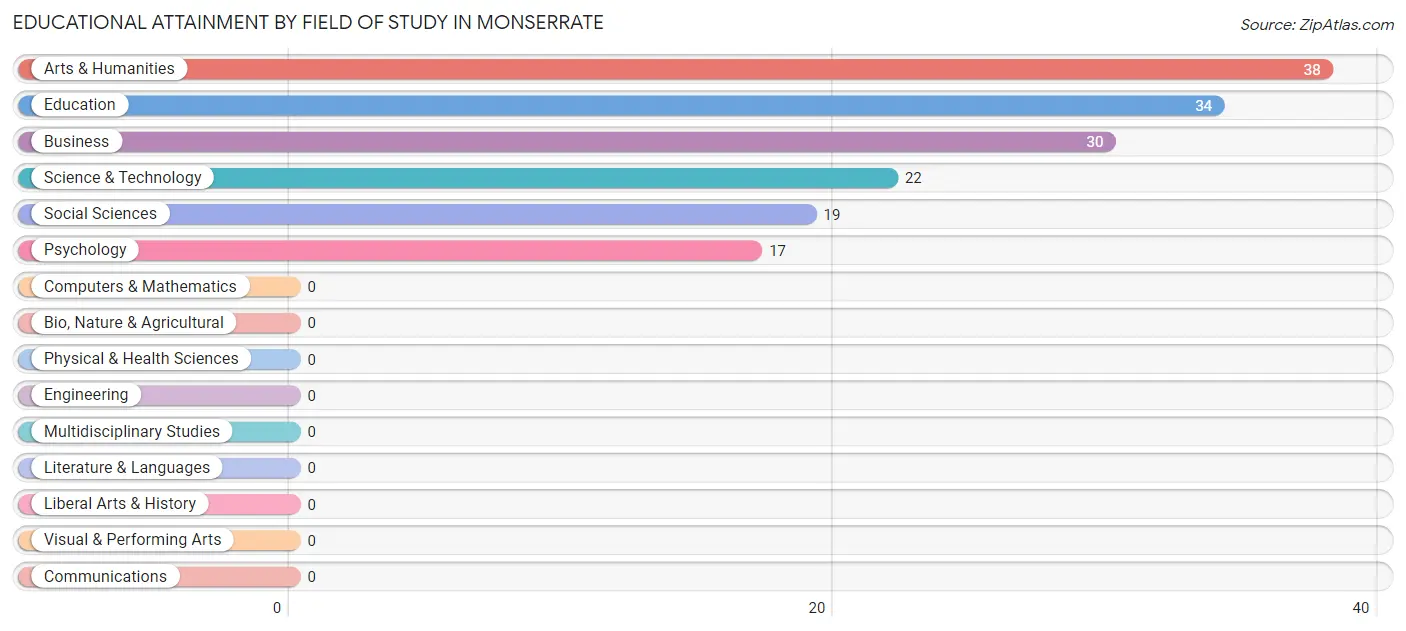
| Field of Study | # Graduates | % Graduates |
| Computers & Mathematics | 0 | 0.0% |
| Bio, Nature & Agricultural | 0 | 0.0% |
| Physical & Health Sciences | 0 | 0.0% |
| Psychology | 17 | 10.6% |
| Social Sciences | 19 | 11.9% |
| Engineering | 0 | 0.0% |
| Multidisciplinary Studies | 0 | 0.0% |
| Science & Technology | 22 | 13.8% |
| Business | 30 | 18.8% |
| Education | 34 | 21.2% |
| Literature & Languages | 0 | 0.0% |
| Liberal Arts & History | 0 | 0.0% |
| Visual & Performing Arts | 0 | 0.0% |
| Communications | 0 | 0.0% |
| Arts & Humanities | 38 | 23.7% |
| Total | 160 | 100.0% |
Transportation & Commute in Monserrate
Vehicle Availability by Sex in Monserrate
The most prevalent vehicle ownership categories in Monserrate are males with 2 vehicles (137, accounting for 51.3%) and females with 2 vehicles (73, making up 42.4%).
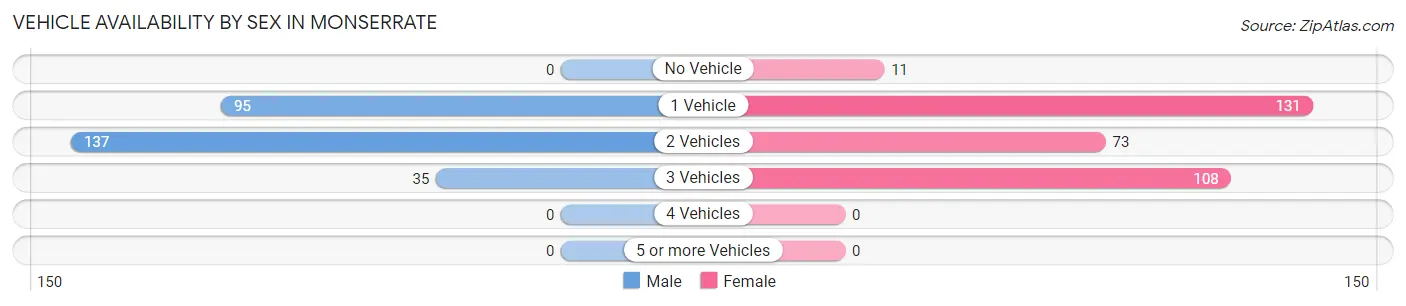
| Vehicles Available | Male | Female |
| No Vehicle | 0 (0.0%) | 11 (3.4%) |
| 1 Vehicle | 95 (35.6%) | 131 (40.6%) |
| 2 Vehicles | 137 (51.3%) | 73 (22.6%) |
| 3 Vehicles | 35 (13.1%) | 108 (33.4%) |
| 4 Vehicles | 0 (0.0%) | 0 (0.0%) |
| 5 or more Vehicles | 0 (0.0%) | 0 (0.0%) |
| Total | 267 (100.0%) | 323 (100.0%) |
Commute Time in Monserrate
The most frequently occuring commute durations in Monserrate are 15 to 19 minutes (129 commuters, 23.0%), 20 to 24 minutes (94 commuters, 16.8%), and 30 to 34 minutes (91 commuters, 16.2%).
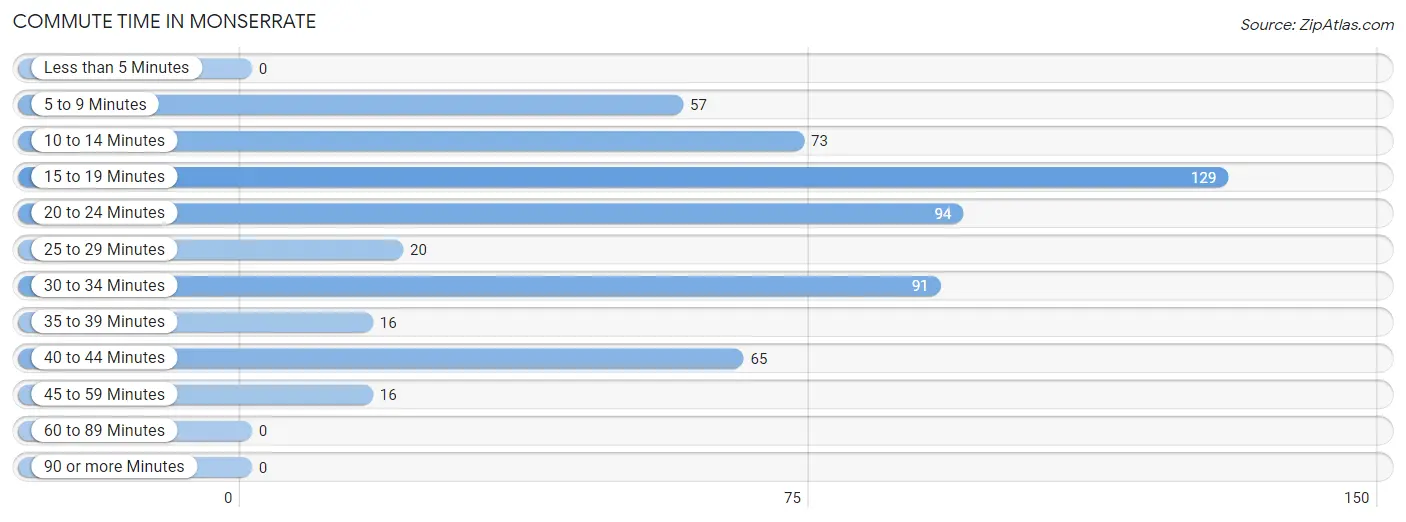
| Commute Time | # Commuters | % Commuters |
| Less than 5 Minutes | 0 | 0.0% |
| 5 to 9 Minutes | 57 | 10.2% |
| 10 to 14 Minutes | 73 | 13.0% |
| 15 to 19 Minutes | 129 | 23.0% |
| 20 to 24 Minutes | 94 | 16.8% |
| 25 to 29 Minutes | 20 | 3.6% |
| 30 to 34 Minutes | 91 | 16.2% |
| 35 to 39 Minutes | 16 | 2.9% |
| 40 to 44 Minutes | 65 | 11.6% |
| 45 to 59 Minutes | 16 | 2.9% |
| 60 to 89 Minutes | 0 | 0.0% |
| 90 or more Minutes | 0 | 0.0% |
Commute Time by Sex in Monserrate
The most common commute times in Monserrate are 20 to 24 minutes (80 commuters, 30.0%) for males and 15 to 19 minutes (97 commuters, 33.0%) for females.
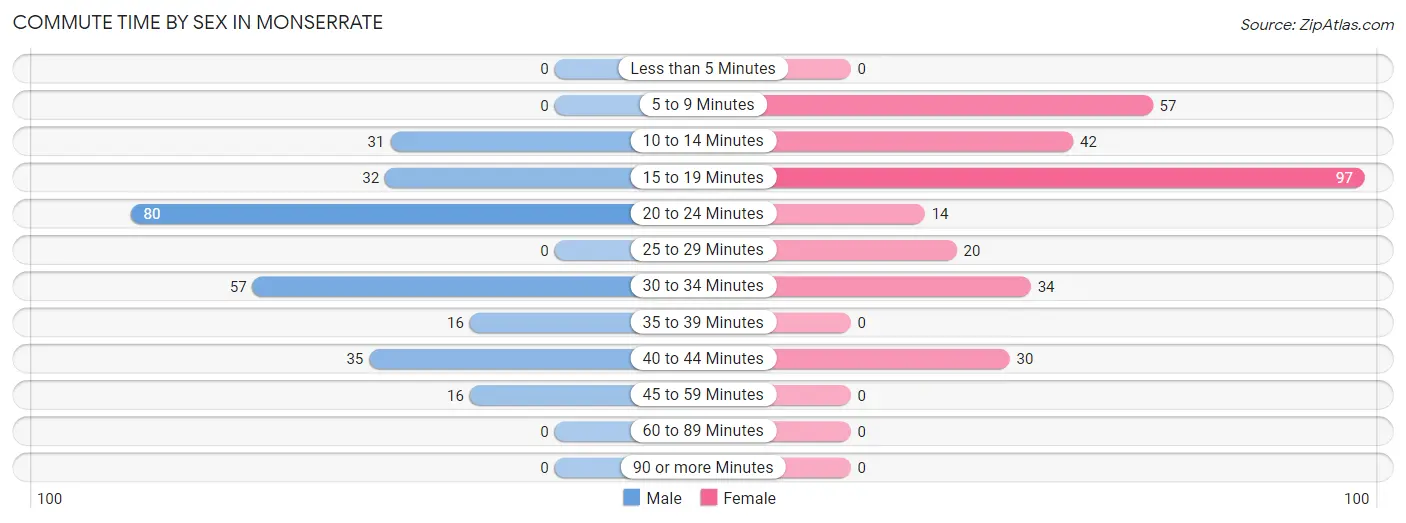
| Commute Time | Male | Female |
| Less than 5 Minutes | 0 (0.0%) | 0 (0.0%) |
| 5 to 9 Minutes | 0 (0.0%) | 57 (19.4%) |
| 10 to 14 Minutes | 31 (11.6%) | 42 (14.3%) |
| 15 to 19 Minutes | 32 (12.0%) | 97 (33.0%) |
| 20 to 24 Minutes | 80 (30.0%) | 14 (4.8%) |
| 25 to 29 Minutes | 0 (0.0%) | 20 (6.8%) |
| 30 to 34 Minutes | 57 (21.3%) | 34 (11.6%) |
| 35 to 39 Minutes | 16 (6.0%) | 0 (0.0%) |
| 40 to 44 Minutes | 35 (13.1%) | 30 (10.2%) |
| 45 to 59 Minutes | 16 (6.0%) | 0 (0.0%) |
| 60 to 89 Minutes | 0 (0.0%) | 0 (0.0%) |
| 90 or more Minutes | 0 (0.0%) | 0 (0.0%) |
Time of Departure to Work by Sex in Monserrate
The most frequent times of departure to work in Monserrate are 6:30 AM to 6:59 AM (72, 27.0%) for males and 12:00 PM to 3:59 PM (67, 22.8%) for females.
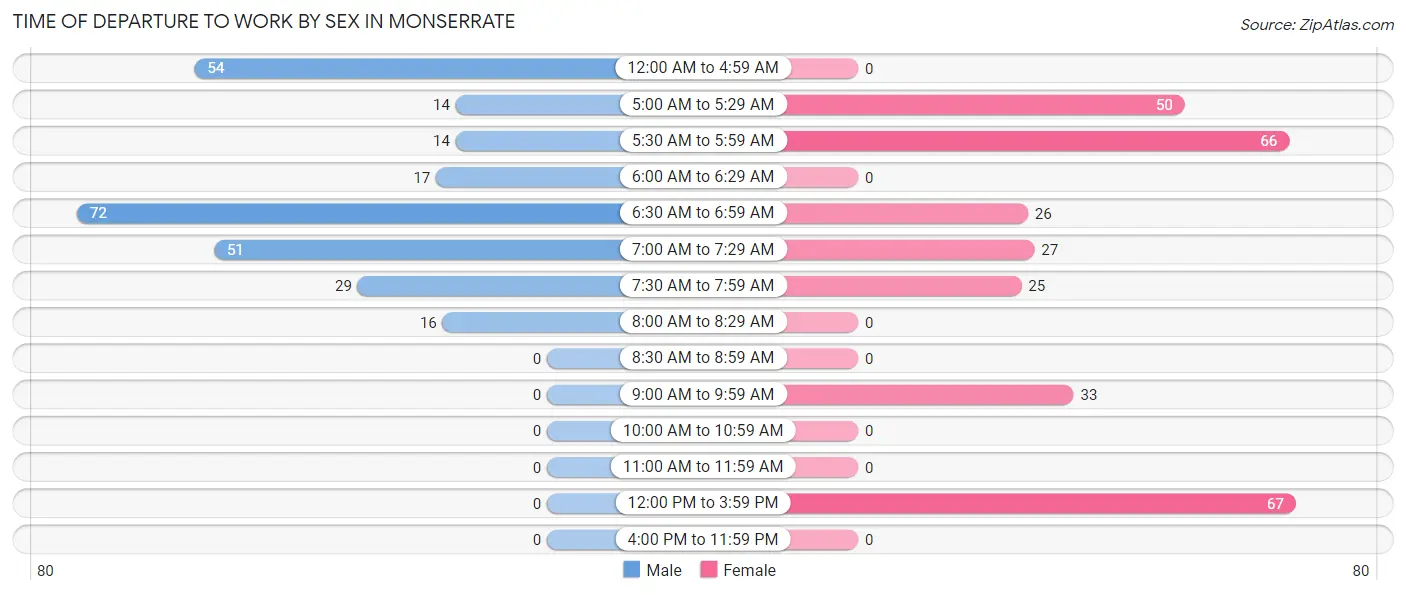
| Time of Departure | Male | Female |
| 12:00 AM to 4:59 AM | 54 (20.2%) | 0 (0.0%) |
| 5:00 AM to 5:29 AM | 14 (5.2%) | 50 (17.0%) |
| 5:30 AM to 5:59 AM | 14 (5.2%) | 66 (22.5%) |
| 6:00 AM to 6:29 AM | 17 (6.4%) | 0 (0.0%) |
| 6:30 AM to 6:59 AM | 72 (27.0%) | 26 (8.8%) |
| 7:00 AM to 7:29 AM | 51 (19.1%) | 27 (9.2%) |
| 7:30 AM to 7:59 AM | 29 (10.9%) | 25 (8.5%) |
| 8:00 AM to 8:29 AM | 16 (6.0%) | 0 (0.0%) |
| 8:30 AM to 8:59 AM | 0 (0.0%) | 0 (0.0%) |
| 9:00 AM to 9:59 AM | 0 (0.0%) | 33 (11.2%) |
| 10:00 AM to 10:59 AM | 0 (0.0%) | 0 (0.0%) |
| 11:00 AM to 11:59 AM | 0 (0.0%) | 0 (0.0%) |
| 12:00 PM to 3:59 PM | 0 (0.0%) | 67 (22.8%) |
| 4:00 PM to 11:59 PM | 0 (0.0%) | 0 (0.0%) |
| Total | 267 (100.0%) | 294 (100.0%) |
Housing Occupancy in Monserrate
Occupancy by Ownership in Monserrate
Of the total 816 dwellings in Monserrate, owner-occupied units account for 527 (64.6%), while renter-occupied units make up 289 (35.4%).
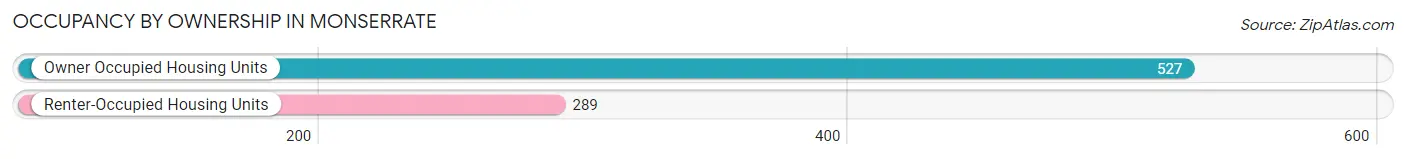
| Occupancy | # Housing Units | % Housing Units |
| Owner Occupied Housing Units | 527 | 64.6% |
| Renter-Occupied Housing Units | 289 | 35.4% |
| Total Occupied Housing Units | 816 | 100.0% |
Occupancy by Household Size in Monserrate
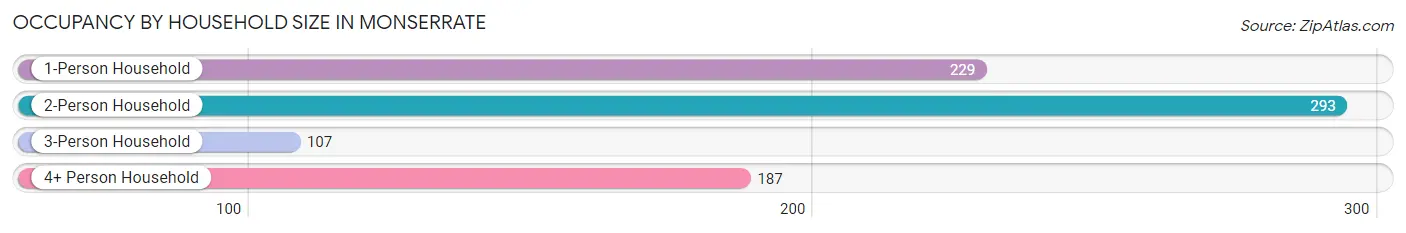
| Household Size | # Housing Units | % Housing Units |
| 1-Person Household | 229 | 28.1% |
| 2-Person Household | 293 | 35.9% |
| 3-Person Household | 107 | 13.1% |
| 4+ Person Household | 187 | 22.9% |
| Total Housing Units | 816 | 100.0% |
Occupancy by Ownership by Household Size in Monserrate
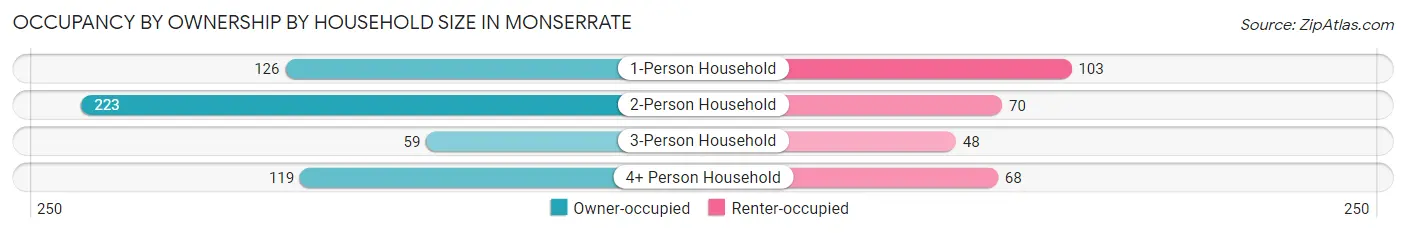
| Household Size | Owner-occupied | Renter-occupied |
| 1-Person Household | 126 (55.0%) | 103 (45.0%) |
| 2-Person Household | 223 (76.1%) | 70 (23.9%) |
| 3-Person Household | 59 (55.1%) | 48 (44.9%) |
| 4+ Person Household | 119 (63.6%) | 68 (36.4%) |
| Total Housing Units | 527 (64.6%) | 289 (35.4%) |
Occupancy by Educational Attainment in Monserrate
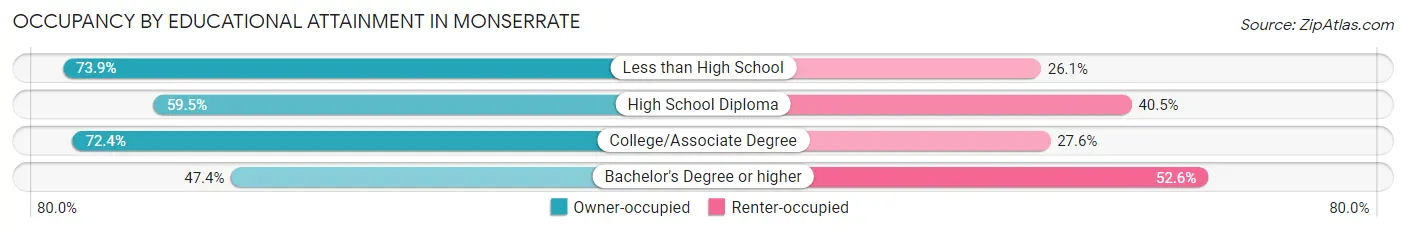
| Household Size | Owner-occupied | Renter-occupied |
| Less than High School | 133 (73.9%) | 47 (26.1%) |
| High School Diploma | 219 (59.5%) | 149 (40.5%) |
| College/Associate Degree | 139 (72.4%) | 53 (27.6%) |
| Bachelor's Degree or higher | 36 (47.4%) | 40 (52.6%) |
Occupancy by Age of Householder in Monserrate
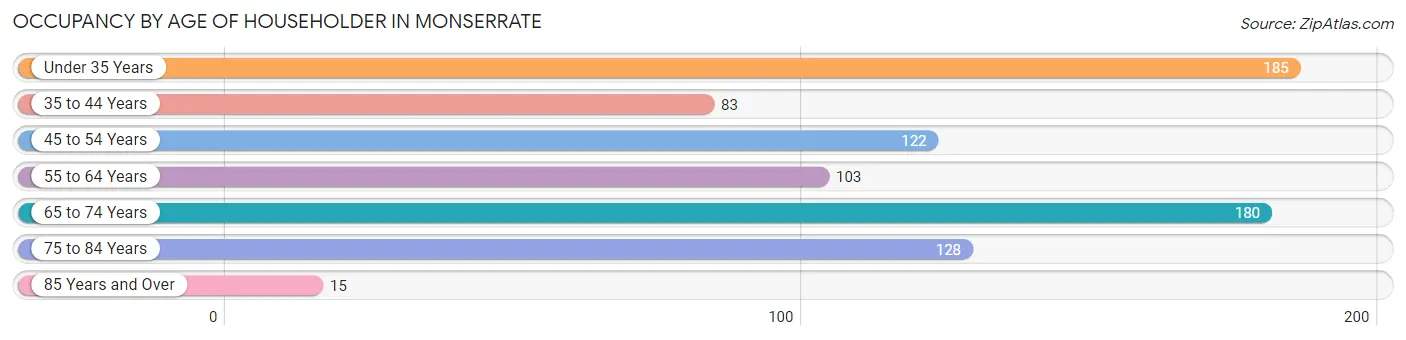
| Age Bracket | # Households | % Households |
| Under 35 Years | 185 | 22.7% |
| 35 to 44 Years | 83 | 10.2% |
| 45 to 54 Years | 122 | 14.9% |
| 55 to 64 Years | 103 | 12.6% |
| 65 to 74 Years | 180 | 22.1% |
| 75 to 84 Years | 128 | 15.7% |
| 85 Years and Over | 15 | 1.8% |
| Total | 816 | 100.0% |
Housing Finances in Monserrate
Median Income by Occupancy in Monserrate
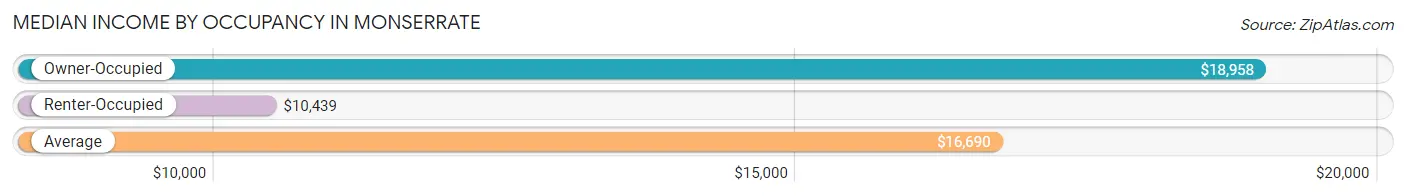
| Occupancy Type | # Households | Median Income |
| Owner-Occupied | 527 (64.6%) | $18,958 |
| Renter-Occupied | 289 (35.4%) | $10,439 |
| Average | 816 (100.0%) | $16,690 |
Occupancy by Householder Income Bracket in Monserrate
| Income Bracket | Owner-occupied | Renter-occupied |
| Less than $5,000 | 85 (16.1%) | 50 (17.3%) |
| $5,000 to $9,999 | 68 (12.9%) | 88 (30.4%) |
| $10,000 to $14,999 | 32 (6.1%) | 37 (12.8%) |
| $15,000 to $19,999 | 96 (18.2%) | 66 (22.8%) |
| $20,000 to $24,999 | 60 (11.4%) | 0 (0.0%) |
| $25,000 to $34,999 | 82 (15.6%) | 0 (0.0%) |
| $35,000 to $49,999 | 29 (5.5%) | 29 (10.0%) |
| $50,000 to $74,999 | 65 (12.3%) | 19 (6.6%) |
| $75,000 to $99,999 | 0 (0.0%) | 0 (0.0%) |
| $100,000 to $149,999 | 10 (1.9%) | 0 (0.0%) |
| $150,000 or more | 0 (0.0%) | 0 (0.0%) |
| Total | 527 (100.0%) | 289 (100.0%) |
Monthly Housing Cost Tiers in Monserrate
| Monthly Cost | Owner-occupied | Renter-occupied |
| Less than $300 | 409 (77.6%) | 13 (4.5%) |
| $300 to $499 | 29 (5.5%) | 48 (16.6%) |
| $500 to $799 | 52 (9.9%) | 56 (19.4%) |
| $800 to $999 | 27 (5.1%) | 19 (6.6%) |
| $1,000 to $1,499 | 10 (1.9%) | 0 (0.0%) |
| $1,500 to $1,999 | 0 (0.0%) | 0 (0.0%) |
| $2,000 to $2,499 | 0 (0.0%) | 0 (0.0%) |
| $2,500 to $2,999 | 0 (0.0%) | 0 (0.0%) |
| $3,000 or more | 0 (0.0%) | 0 (0.0%) |
| Total | 527 (100.0%) | 289 (100.0%) |
Physical Housing Characteristics in Monserrate
Housing Structures in Monserrate
| Structure Type | # Housing Units | % Housing Units |
| Single Unit, Detached | 728 | 89.2% |
| Single Unit, Attached | 88 | 10.8% |
| 2 Unit Apartments | 0 | 0.0% |
| 3 or 4 Unit Apartments | 0 | 0.0% |
| 5 to 9 Unit Apartments | 0 | 0.0% |
| 10 or more Apartments | 0 | 0.0% |
| Mobile Home / Other | 0 | 0.0% |
| Total | 816 | 100.0% |
Housing Structures by Occupancy in Monserrate
| Structure Type | Owner-occupied | Renter-occupied |
| Single Unit, Detached | 512 (70.3%) | 216 (29.7%) |
| Single Unit, Attached | 15 (17.1%) | 73 (83.0%) |
| 2 Unit Apartments | 0 (0.0%) | 0 (0.0%) |
| 3 or 4 Unit Apartments | 0 (0.0%) | 0 (0.0%) |
| 5 to 9 Unit Apartments | 0 (0.0%) | 0 (0.0%) |
| 10 or more Apartments | 0 (0.0%) | 0 (0.0%) |
| Mobile Home / Other | 0 (0.0%) | 0 (0.0%) |
| Total | 527 (64.6%) | 289 (35.4%) |
Housing Structures by Number of Rooms in Monserrate
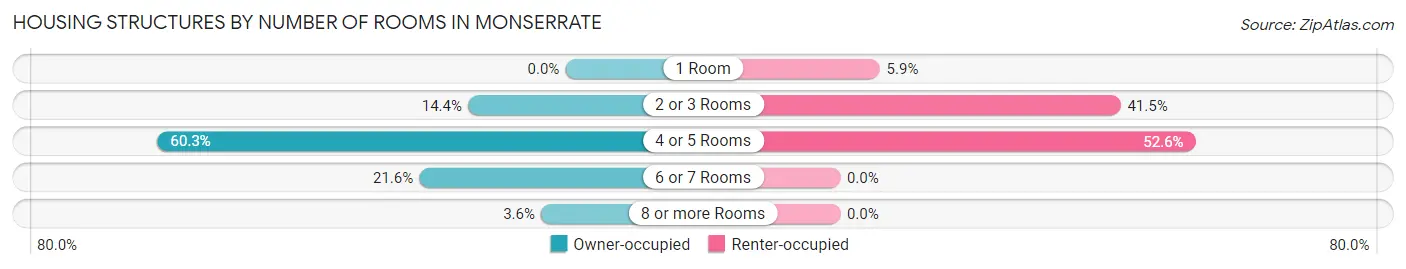
| Number of Rooms | Owner-occupied | Renter-occupied |
| 1 Room | 0 (0.0%) | 17 (5.9%) |
| 2 or 3 Rooms | 76 (14.4%) | 120 (41.5%) |
| 4 or 5 Rooms | 318 (60.3%) | 152 (52.6%) |
| 6 or 7 Rooms | 114 (21.6%) | 0 (0.0%) |
| 8 or more Rooms | 19 (3.6%) | 0 (0.0%) |
| Total | 527 (100.0%) | 289 (100.0%) |
Housing Structure by Heating Type in Monserrate
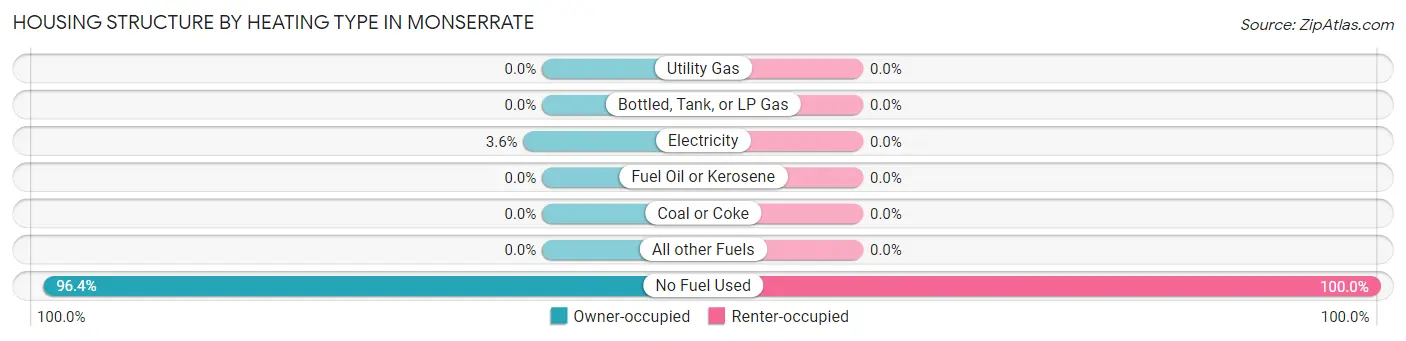
| Heating Type | Owner-occupied | Renter-occupied |
| Utility Gas | 0 (0.0%) | 0 (0.0%) |
| Bottled, Tank, or LP Gas | 0 (0.0%) | 0 (0.0%) |
| Electricity | 19 (3.6%) | 0 (0.0%) |
| Fuel Oil or Kerosene | 0 (0.0%) | 0 (0.0%) |
| Coal or Coke | 0 (0.0%) | 0 (0.0%) |
| All other Fuels | 0 (0.0%) | 0 (0.0%) |
| No Fuel Used | 508 (96.4%) | 289 (100.0%) |
| Total | 527 (100.0%) | 289 (100.0%) |
Household Vehicle Usage in Monserrate
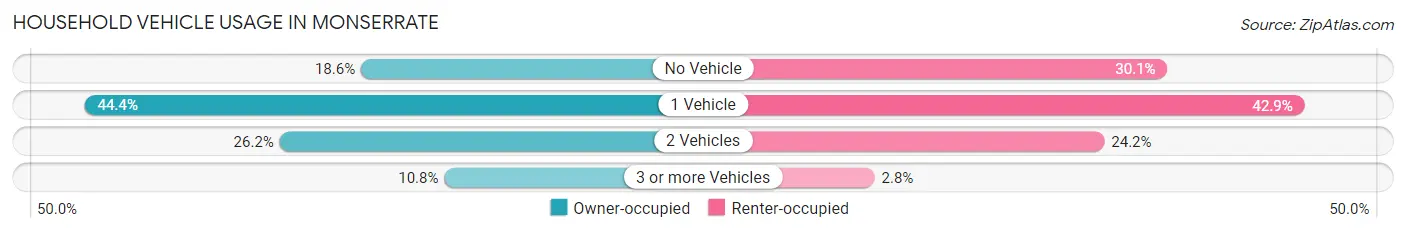
| Vehicles per Household | Owner-occupied | Renter-occupied |
| No Vehicle | 98 (18.6%) | 87 (30.1%) |
| 1 Vehicle | 234 (44.4%) | 124 (42.9%) |
| 2 Vehicles | 138 (26.2%) | 70 (24.2%) |
| 3 or more Vehicles | 57 (10.8%) | 8 (2.8%) |
| Total | 527 (100.0%) | 289 (100.0%) |
Real Estate & Mortgages in Monserrate
Real Estate and Mortgage Overview in Monserrate
| Characteristic | Without Mortgage | With Mortgage |
| Housing Units | 438 | 89 |
| Median Property Value | $92,900 | $126,300 |
| Median Household Income | $17,857 | $0 |
| Monthly Housing Costs | $165 | $0 |
| Real Estate Taxes | - | - |
Property Value by Mortgage Status in Monserrate
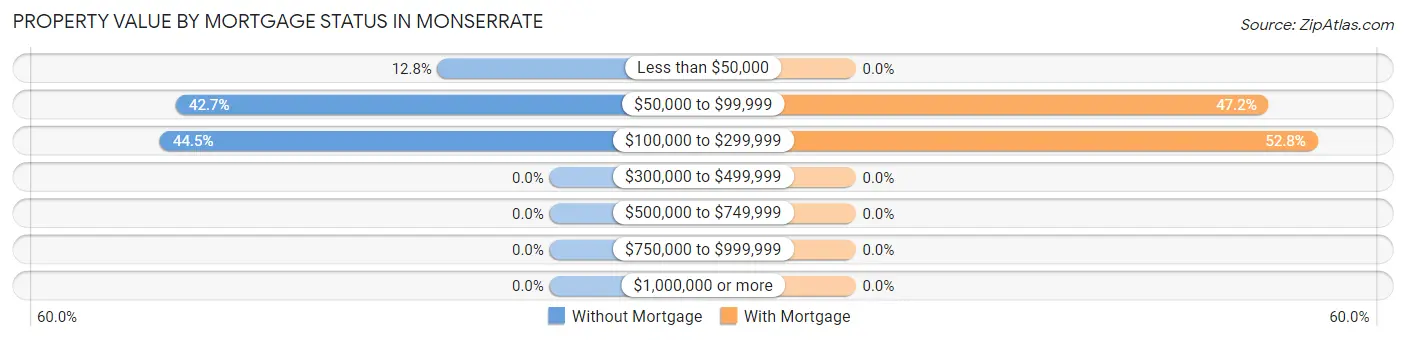
| Property Value | Without Mortgage | With Mortgage |
| Less than $50,000 | 56 (12.8%) | 0 (0.0%) |
| $50,000 to $99,999 | 187 (42.7%) | 42 (47.2%) |
| $100,000 to $299,999 | 195 (44.5%) | 47 (52.8%) |
| $300,000 to $499,999 | 0 (0.0%) | 0 (0.0%) |
| $500,000 to $749,999 | 0 (0.0%) | 0 (0.0%) |
| $750,000 to $999,999 | 0 (0.0%) | 0 (0.0%) |
| $1,000,000 or more | 0 (0.0%) | 0 (0.0%) |
| Total | 438 (100.0%) | 89 (100.0%) |
Household Income by Mortgage Status in Monserrate
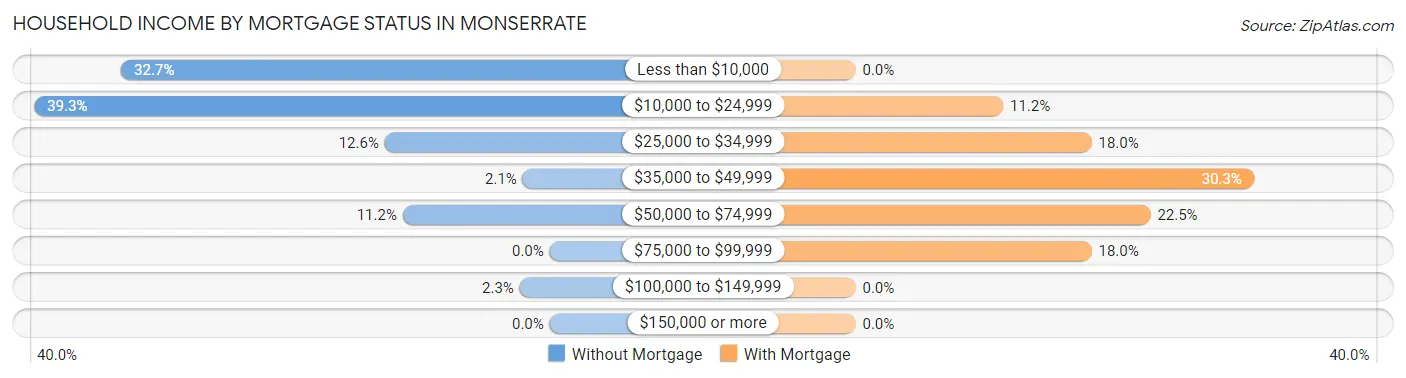
| Household Income | Without Mortgage | With Mortgage |
| Less than $10,000 | 143 (32.7%) | 0 (0.0%) |
| $10,000 to $24,999 | 172 (39.3%) | 10 (11.2%) |
| $25,000 to $34,999 | 55 (12.6%) | 16 (18.0%) |
| $35,000 to $49,999 | 9 (2.1%) | 27 (30.3%) |
| $50,000 to $74,999 | 49 (11.2%) | 20 (22.5%) |
| $75,000 to $99,999 | 0 (0.0%) | 16 (18.0%) |
| $100,000 to $149,999 | 10 (2.3%) | 0 (0.0%) |
| $150,000 or more | 0 (0.0%) | 0 (0.0%) |
| Total | 438 (100.0%) | 89 (100.0%) |
Property Value to Household Income Ratio in Monserrate
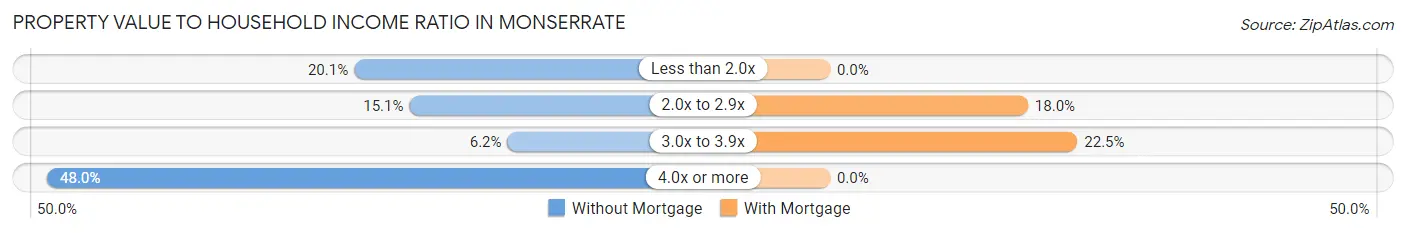
| Value-to-Income Ratio | Without Mortgage | With Mortgage |
| Less than 2.0x | 88 (20.1%) | 0 (0.0%) |
| 2.0x to 2.9x | 66 (15.1%) | 16 (18.0%) |
| 3.0x to 3.9x | 27 (6.2%) | 20 (22.5%) |
| 4.0x or more | 210 (47.9%) | 0 (0.0%) |
| Total | 438 (100.0%) | 89 (100.0%) |
Real Estate Taxes by Mortgage Status in Monserrate
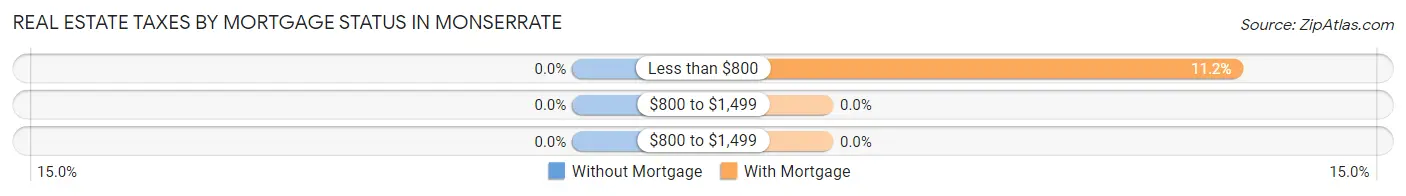
| Property Taxes | Without Mortgage | With Mortgage |
| Less than $800 | 0 (0.0%) | 10 (11.2%) |
| $800 to $1,499 | 0 (0.0%) | 0 (0.0%) |
| $800 to $1,499 | 0 (0.0%) | 0 (0.0%) |
| Total | 438 (100.0%) | 89 (100.0%) |
Health & Disability in Monserrate
Health Insurance Coverage by Age in Monserrate
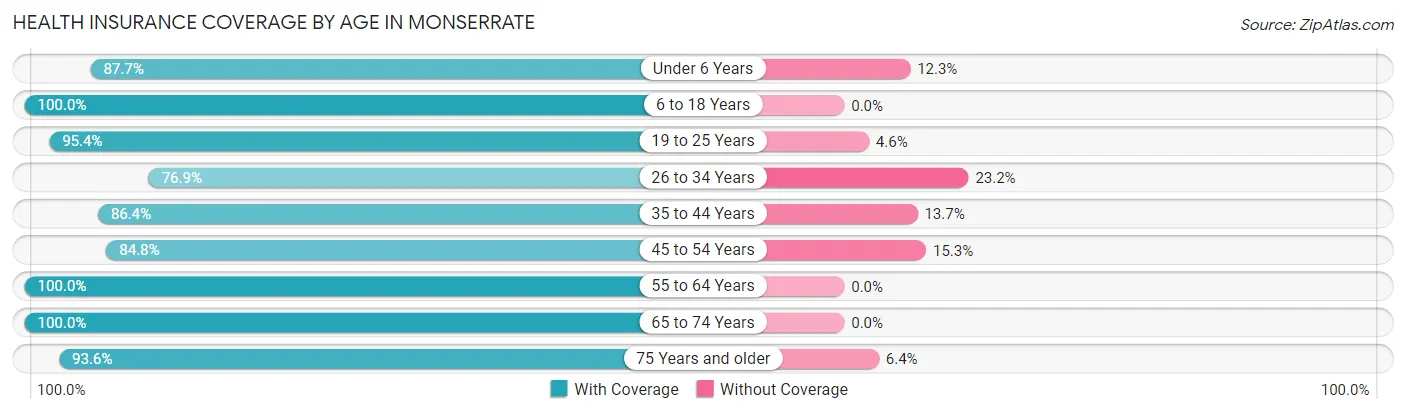
| Age Bracket | With Coverage | Without Coverage |
| Under 6 Years | 207 (87.7%) | 29 (12.3%) |
| 6 to 18 Years | 348 (100.0%) | 0 (0.0%) |
| 19 to 25 Years | 208 (95.4%) | 10 (4.6%) |
| 26 to 34 Years | 239 (76.8%) | 72 (23.2%) |
| 35 to 44 Years | 215 (86.4%) | 34 (13.7%) |
| 45 to 54 Years | 200 (84.8%) | 36 (15.2%) |
| 55 to 64 Years | 169 (100.0%) | 0 (0.0%) |
| 65 to 74 Years | 266 (100.0%) | 0 (0.0%) |
| 75 Years and older | 218 (93.6%) | 15 (6.4%) |
| Total | 2,070 (91.3%) | 196 (8.6%) |
Health Insurance Coverage by Citizenship Status in Monserrate
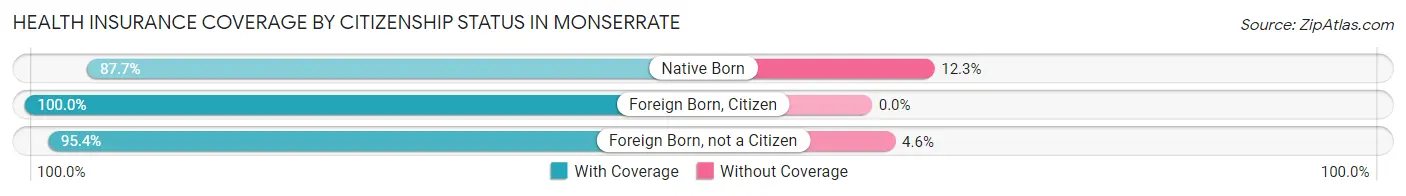
| Citizenship Status | With Coverage | Without Coverage |
| Native Born | 207 (87.7%) | 29 (12.3%) |
| Foreign Born, Citizen | 348 (100.0%) | 0 (0.0%) |
| Foreign Born, not a Citizen | 208 (95.4%) | 10 (4.6%) |
Health Insurance Coverage by Household Income in Monserrate
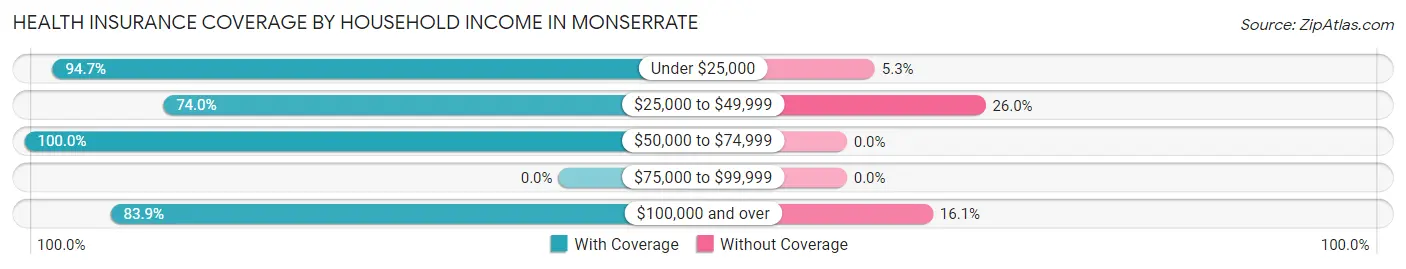
| Household Income | With Coverage | Without Coverage |
| Under $25,000 | 1,442 (94.7%) | 80 (5.3%) |
| $25,000 to $49,999 | 302 (74.0%) | 106 (26.0%) |
| $50,000 to $74,999 | 274 (100.0%) | 0 (0.0%) |
| $75,000 to $99,999 | 0 (0.0%) | 0 (0.0%) |
| $100,000 and over | 52 (83.9%) | 10 (16.1%) |
Public vs Private Health Insurance Coverage by Age in Monserrate
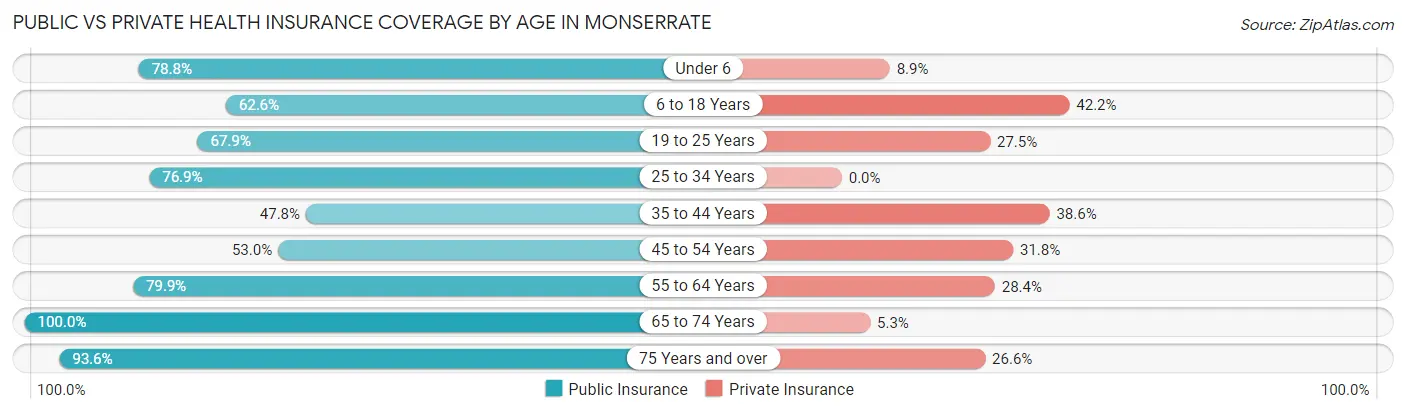
| Age Bracket | Public Insurance | Private Insurance |
| Under 6 | 186 (78.8%) | 21 (8.9%) |
| 6 to 18 Years | 218 (62.6%) | 147 (42.2%) |
| 19 to 25 Years | 148 (67.9%) | 60 (27.5%) |
| 25 to 34 Years | 239 (76.8%) | 0 (0.0%) |
| 35 to 44 Years | 119 (47.8%) | 96 (38.6%) |
| 45 to 54 Years | 125 (53.0%) | 75 (31.8%) |
| 55 to 64 Years | 135 (79.9%) | 48 (28.4%) |
| 65 to 74 Years | 266 (100.0%) | 14 (5.3%) |
| 75 Years and over | 218 (93.6%) | 62 (26.6%) |
| Total | 1,654 (73.0%) | 523 (23.1%) |
Disability Status by Sex by Age in Monserrate
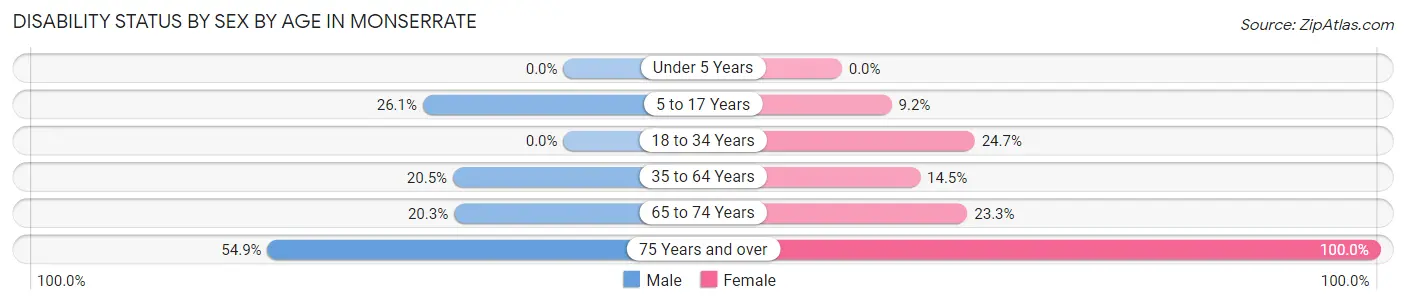
| Age Bracket | Male | Female |
| Under 5 Years | 0 (0.0%) | 0 (0.0%) |
| 5 to 17 Years | 42 (26.1%) | 11 (9.2%) |
| 18 to 34 Years | 0 (0.0%) | 96 (24.7%) |
| 35 to 64 Years | 65 (20.5%) | 49 (14.5%) |
| 65 to 74 Years | 27 (20.3%) | 31 (23.3%) |
| 75 Years and over | 39 (54.9%) | 162 (100.0%) |
Disability Class by Sex by Age in Monserrate
Disability Class: Hearing Difficulty
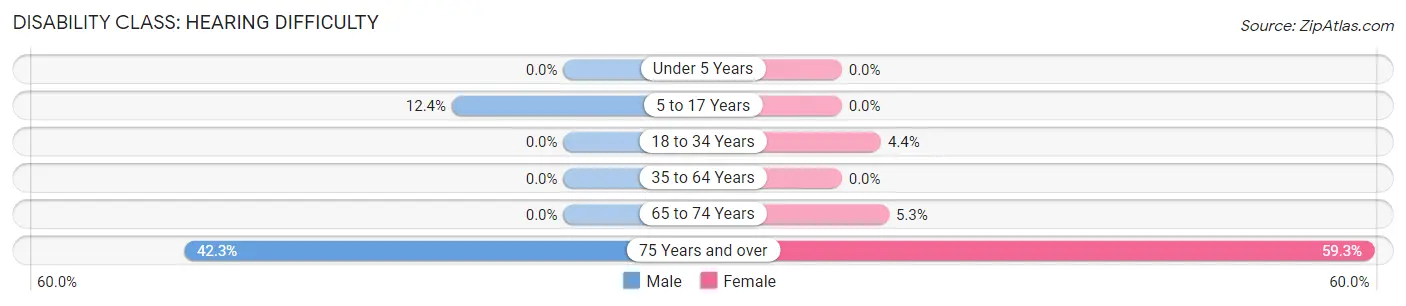
| Age Bracket | Male | Female |
| Under 5 Years | 0 (0.0%) | 0 (0.0%) |
| 5 to 17 Years | 20 (12.4%) | 0 (0.0%) |
| 18 to 34 Years | 0 (0.0%) | 17 (4.4%) |
| 35 to 64 Years | 0 (0.0%) | 0 (0.0%) |
| 65 to 74 Years | 0 (0.0%) | 7 (5.3%) |
| 75 Years and over | 30 (42.2%) | 96 (59.3%) |
Disability Class: Vision Difficulty
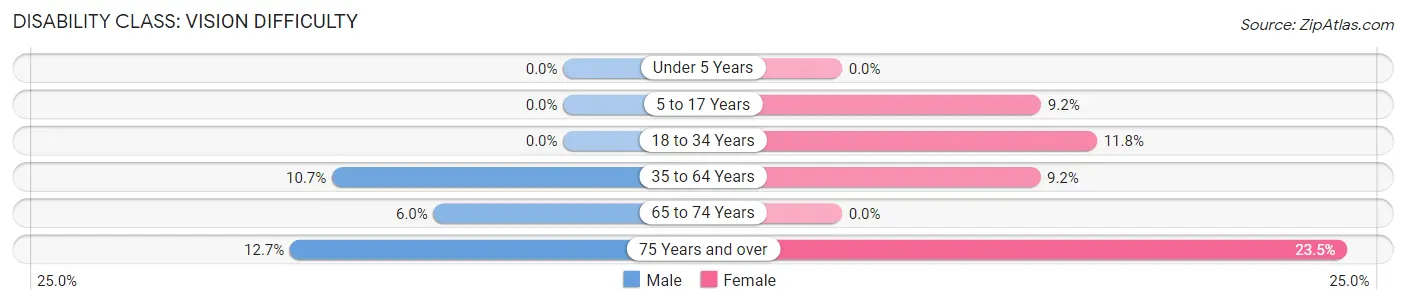
| Age Bracket | Male | Female |
| Under 5 Years | 0 (0.0%) | 0 (0.0%) |
| 5 to 17 Years | 0 (0.0%) | 11 (9.2%) |
| 18 to 34 Years | 0 (0.0%) | 46 (11.8%) |
| 35 to 64 Years | 34 (10.7%) | 31 (9.2%) |
| 65 to 74 Years | 8 (6.0%) | 0 (0.0%) |
| 75 Years and over | 9 (12.7%) | 38 (23.5%) |
Disability Class: Cognitive Difficulty
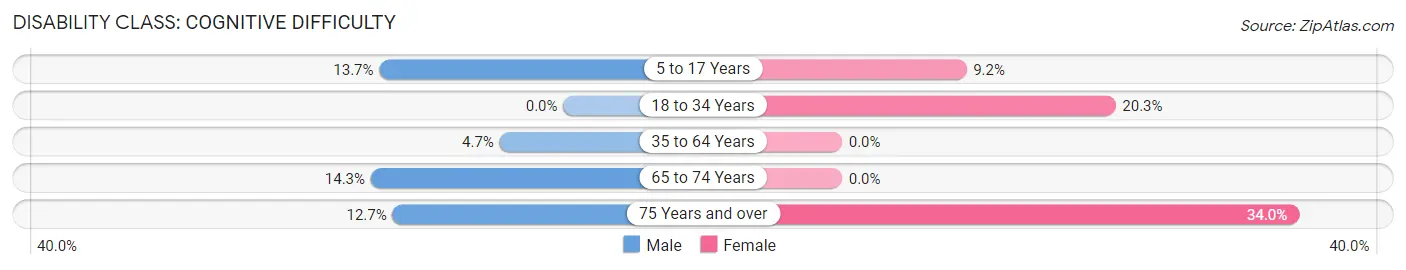
| Age Bracket | Male | Female |
| 5 to 17 Years | 22 (13.7%) | 11 (9.2%) |
| 18 to 34 Years | 0 (0.0%) | 79 (20.3%) |
| 35 to 64 Years | 15 (4.7%) | 0 (0.0%) |
| 65 to 74 Years | 19 (14.3%) | 0 (0.0%) |
| 75 Years and over | 9 (12.7%) | 55 (34.0%) |
Disability Class: Ambulatory Difficulty
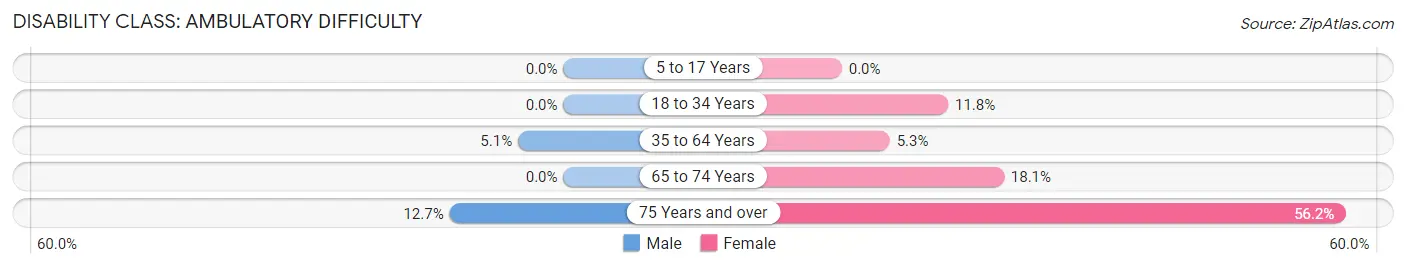
| Age Bracket | Male | Female |
| 5 to 17 Years | 0 (0.0%) | 0 (0.0%) |
| 18 to 34 Years | 0 (0.0%) | 46 (11.8%) |
| 35 to 64 Years | 16 (5.1%) | 18 (5.3%) |
| 65 to 74 Years | 0 (0.0%) | 24 (18.0%) |
| 75 Years and over | 9 (12.7%) | 91 (56.2%) |
Disability Class: Self-Care Difficulty
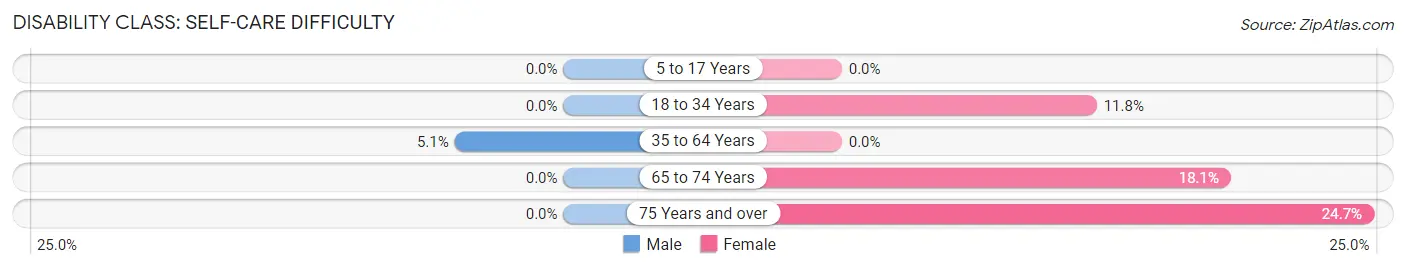
| Age Bracket | Male | Female |
| 5 to 17 Years | 0 (0.0%) | 0 (0.0%) |
| 18 to 34 Years | 0 (0.0%) | 46 (11.8%) |
| 35 to 64 Years | 16 (5.1%) | 0 (0.0%) |
| 65 to 74 Years | 0 (0.0%) | 24 (18.0%) |
| 75 Years and over | 0 (0.0%) | 40 (24.7%) |
Technology Access in Monserrate
Computing Device Access in Monserrate
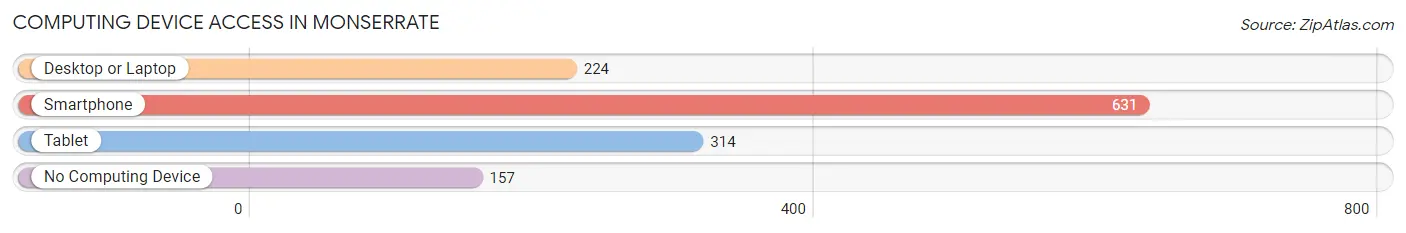
| Device Type | # Households | % Households |
| Desktop or Laptop | 224 | 27.5% |
| Smartphone | 631 | 77.3% |
| Tablet | 314 | 38.5% |
| No Computing Device | 157 | 19.2% |
| Total | 816 | 100.0% |
Internet Access in Monserrate
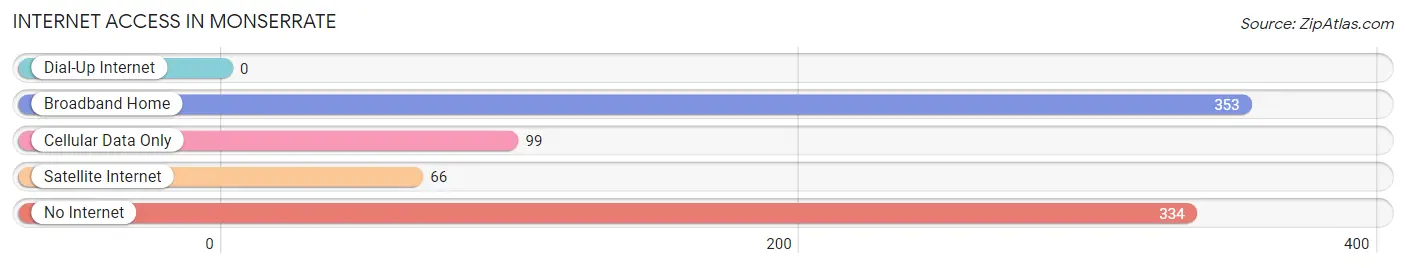
| Internet Type | # Households | % Households |
| Dial-Up Internet | 0 | 0.0% |
| Broadband Home | 353 | 43.3% |
| Cellular Data Only | 99 | 12.1% |
| Satellite Internet | 66 | 8.1% |
| No Internet | 334 | 40.9% |
| Total | 816 | 100.0% |
Monserrate Summary
Monserrate is a municipality located in the northern coast of Puerto Rico, in the northern region of the island, bordering the Atlantic Ocean, north of San Juan and Bayamón; east of Toa Baja and Dorado; and west of Cataño. The town is spread over 5 wards and Monserrate Pueblo (the downtown area and the administrative center of the city). It has a land area of 8.2 square miles and a population of 33,845 as of the 2010 U.S. Census.
History
Monserrate was founded in 1736 by Don Francisco de Monserrate, a Spanish military officer. The town was originally part of the municipality of Bayamón, but was later established as an independent municipality in 1841.
Monserrate has a rich history of agriculture and fishing. The town was known for its production of sugar cane, tobacco, and coffee. In the 19th century, Monserrate was also a major port for the export of these products.
Geography
Monserrate is located in the northern coast of Puerto Rico, in the northern region of the island, bordering the Atlantic Ocean, north of San Juan and Bayamón; east of Toa Baja and Dorado; and west of Cataño. The town is spread over 5 wards and Monserrate Pueblo (the downtown area and the administrative center of the city). It has a land area of 8.2 square miles and a population of 33,845 as of the 2010 U.S. Census.
The terrain of Monserrate is mostly flat, with some hills in the northern part of the municipality. The highest point is Cerro de Monserrate, which is located in the northern part of the municipality and has an elevation of 1,067 feet.
Economy
Monserrate’s economy is largely based on agriculture and fishing. The town is known for its production of sugar cane, tobacco, and coffee. In the 19th century, Monserrate was also a major port for the export of these products.
Today, the town’s economy is still largely based on agriculture and fishing, but it has also diversified to include light manufacturing, tourism, and services. The town is home to several small businesses, including restaurants, bars, and shops.
Demographics
As of the 2010 U.S. Census, Monserrate had a population of 33,845. The racial makeup of the town was 79.2% White, 0.7% African American, 0.2% Native American, 0.3% Asian, 0.1% Pacific Islander, 17.3% from other races, and 2.4% from two or more races. Hispanic or Latino of any race were 97.2% of the population.
The median household income in Monserrate was $17,845 in 2010, and the median family income was $20,945. The per capita income was $9,845. About 28.2% of the population was below the poverty line.
Common Questions
What is Per Capita Income in Monserrate?
Per Capita income in Monserrate is $8,638.
What is the Median Family Income in Monserrate?
Median Family Income in Monserrate is $16,010.
What is the Median Household income in Monserrate?
Median Household Income in Monserrate is $16,690.
What is Income or Wage Gap in Monserrate?
Income or Wage Gap in Monserrate is 46.9%.
Women in Monserrate earn 53.1 cents for every dollar earned by a man.
What is Family Income Deficit in Monserrate?
Family Income Deficit in Monserrate is $15,420.
Families that are below poverty line in Monserrate earn $15,420 less on average than the poverty threshold level.
What is Inequality or Gini Index in Monserrate?
Inequality or Gini Index in Monserrate is 0.50.
What is the Total Population of Monserrate?
Total Population of Monserrate is 2,266.
What is the Total Male Population of Monserrate?
Total Male Population of Monserrate is 962.
What is the Total Female Population of Monserrate?
Total Female Population of Monserrate is 1,304.
What is the Ratio of Males per 100 Females in Monserrate?
There are 73.77 Males per 100 Females in Monserrate.
What is the Ratio of Females per 100 Males in Monserrate?
There are 135.55 Females per 100 Males in Monserrate.
What is the Median Population Age in Monserrate?
Median Population Age in Monserrate is 36.3 Years.
What is the Average Family Size in Monserrate
Average Family Size in Monserrate is 3.2 People.
What is the Average Household Size in Monserrate
Average Household Size in Monserrate is 2.8 People.
How Large is the Labor Force in Monserrate?
There are 737 People in the Labor Forcein in Monserrate.
What is the Percentage of People in the Labor Force in Monserrate?
40.6% of People are in the Labor Force in Monserrate.
What is the Unemployment Rate in Monserrate?
Unemployment Rate in Monserrate is 20.1%.