Los Panes, PR Map & Demographics
Los Panes Map
Los Panes Overview
$11,549
PER CAPITA INCOME
$38,068
AVG FAMILY INCOME
$29,352
AVG HOUSEHOLD INCOME
0.10
INEQUALITY / GINI INDEX
266
TOTAL POPULATION
102
MALE POPULATION
164
FEMALE POPULATION
62.20
MALES / 100 FEMALES
160.78
FEMALES / 100 MALES
61.7
MEDIAN AGE
3.4
AVG FAMILY SIZE
3.0
AVG HOUSEHOLD SIZE
80
LABOR FORCE [ PEOPLE ]
30.1%
PERCENT IN LABOR FORCE
Income in Los Panes
Income Overview in Los Panes
Per Capita Income in Los Panes is $11,549, while median incomes of families and households are $38,068 and $29,352 respectively.
| Characteristic | Number | Measure |
| Per Capita Income | 266 | $11,549 |
| Median Family Income | 64 | $38,068 |
| Mean Family Income | 64 | $34,613 |
| Median Household Income | 88 | $29,352 |
| Mean Household Income | 88 | $32,217 |
| Income Deficit | 64 | $0 |
| Wage / Income Gap (%) | 266 | 0.00% |
| Wage / Income Gap ($) | 266 | 100.00¢ per $1 |
| Gini / Inequality Index | 266 | 0.10 |
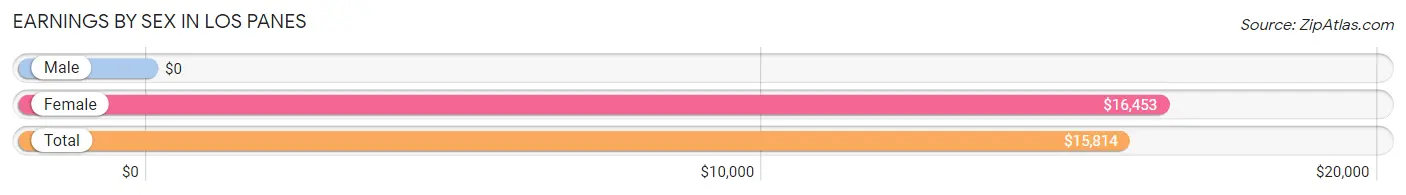
Earnings by Sex in Los Panes
| Sex | Number | Average Earnings |
| Male | 22 (21.6%) | $0 |
| Female | 80 (78.4%) | $16,453 |
| Total | 102 (100.0%) | $15,814 |
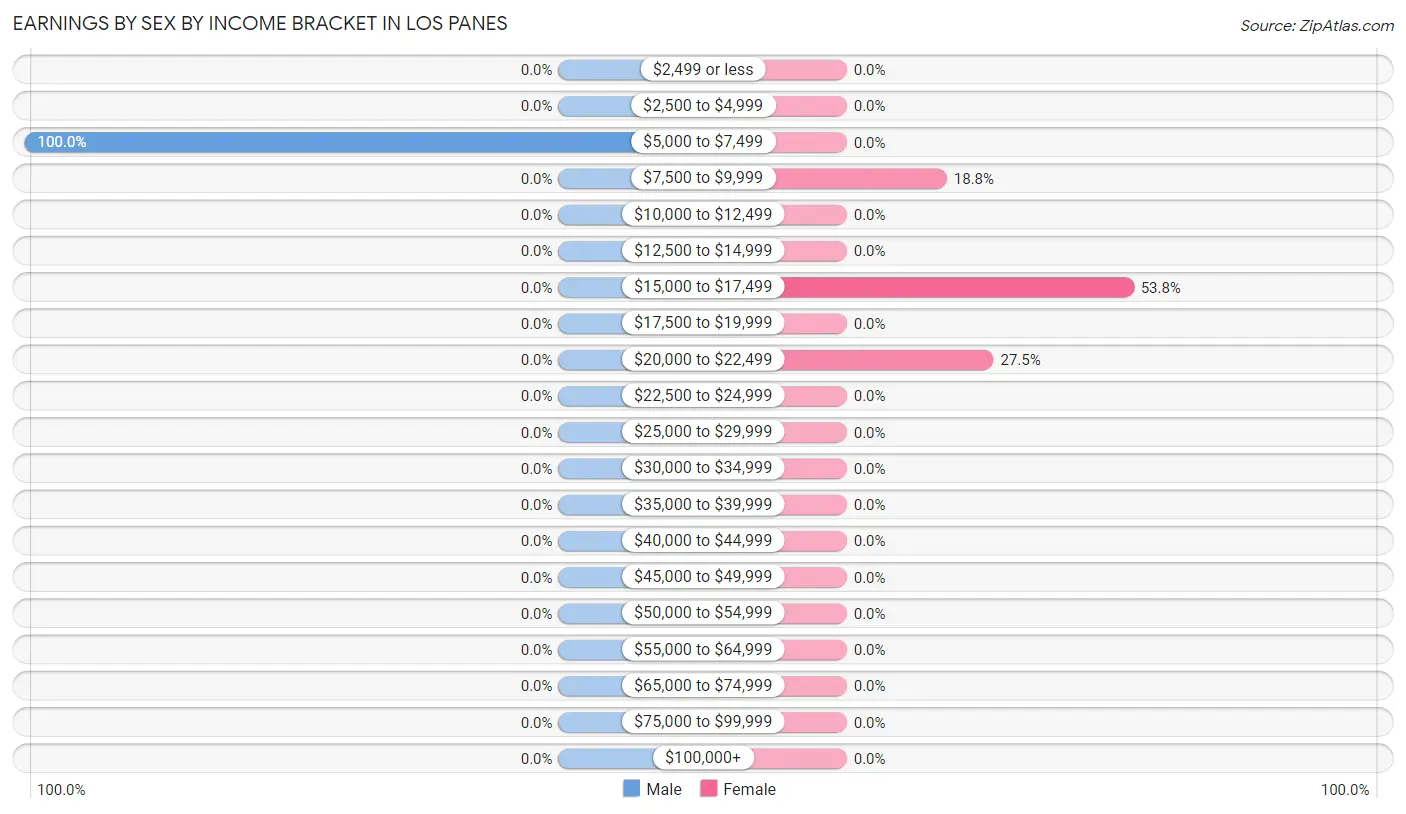
Earnings by Sex by Income Bracket in Los Panes
The most common earnings brackets in Los Panes are $5,000 to $7,499 for men (22 | 100.0%) and $15,000 to $17,499 for women (43 | 53.7%).
| Income | Male | Female |
| $2,499 or less | 0 (0.0%) | 0 (0.0%) |
| $2,500 to $4,999 | 0 (0.0%) | 0 (0.0%) |
| $5,000 to $7,499 | 22 (100.0%) | 0 (0.0%) |
| $7,500 to $9,999 | 0 (0.0%) | 15 (18.8%) |
| $10,000 to $12,499 | 0 (0.0%) | 0 (0.0%) |
| $12,500 to $14,999 | 0 (0.0%) | 0 (0.0%) |
| $15,000 to $17,499 | 0 (0.0%) | 43 (53.7%) |
| $17,500 to $19,999 | 0 (0.0%) | 0 (0.0%) |
| $20,000 to $22,499 | 0 (0.0%) | 22 (27.5%) |
| $22,500 to $24,999 | 0 (0.0%) | 0 (0.0%) |
| $25,000 to $29,999 | 0 (0.0%) | 0 (0.0%) |
| $30,000 to $34,999 | 0 (0.0%) | 0 (0.0%) |
| $35,000 to $39,999 | 0 (0.0%) | 0 (0.0%) |
| $40,000 to $44,999 | 0 (0.0%) | 0 (0.0%) |
| $45,000 to $49,999 | 0 (0.0%) | 0 (0.0%) |
| $50,000 to $54,999 | 0 (0.0%) | 0 (0.0%) |
| $55,000 to $64,999 | 0 (0.0%) | 0 (0.0%) |
| $65,000 to $74,999 | 0 (0.0%) | 0 (0.0%) |
| $75,000 to $99,999 | 0 (0.0%) | 0 (0.0%) |
| $100,000+ | 0 (0.0%) | 0 (0.0%) |
| Total | 22 (100.0%) | 80 (100.0%) |
Earnings by Sex by Educational Attainment in Los Panes
| Educational Attainment | Male Income | Female Income |
| Less than High School | - | - |
| High School Diploma | - | - |
| College or Associate's Degree | - | - |
| Bachelor's Degree | - | - |
| Graduate Degree | - | - |
| Total | - | - |
Family Income in Los Panes
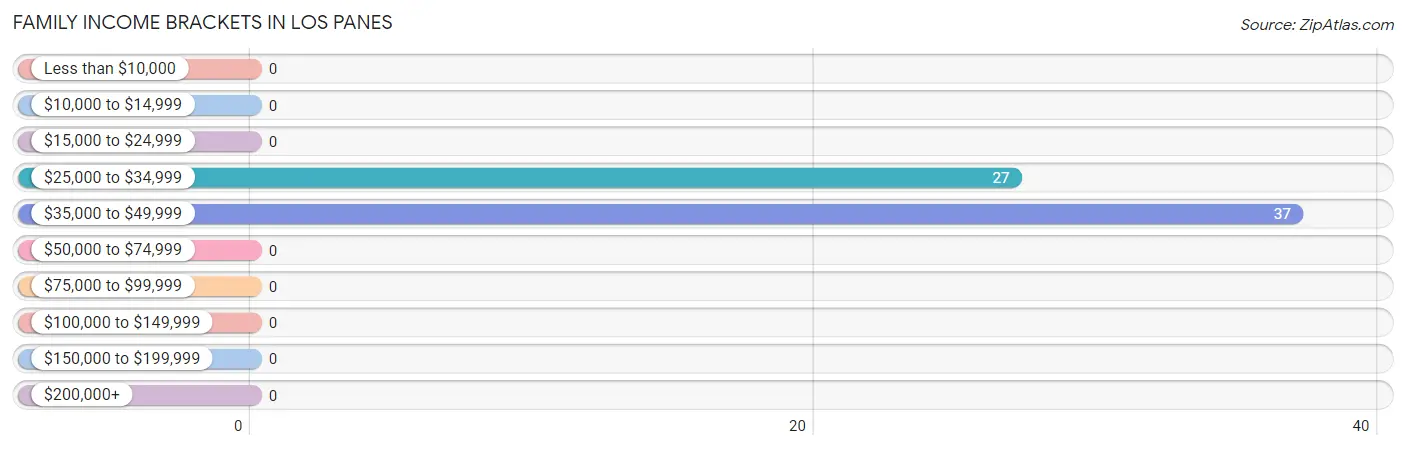
Family Income Brackets in Los Panes
According to the Los Panes family income data, there are 37 families falling into the $35,000 to $49,999 income range, which is the most common income bracket and makes up 57.8% of all families.
| Income Bracket | # Families | % Families |
| Less than $10,000 | 0 | 0.0% |
| $10,000 to $14,999 | 0 | 0.0% |
| $15,000 to $24,999 | 0 | 0.0% |
| $25,000 to $34,999 | 27 | 42.2% |
| $35,000 to $49,999 | 37 | 57.8% |
| $50,000 to $74,999 | 0 | 0.0% |
| $75,000 to $99,999 | 0 | 0.0% |
| $100,000 to $149,999 | 0 | 0.0% |
| $150,000 to $199,999 | 0 | 0.0% |
| $200,000+ | 0 | 0.0% |
Family Income by Famaliy Size in Los Panes
| Income Bracket | # Families | Median Income |
| 2-Person Families | 37 (57.8%) | $0 |
| 3-Person Families | 0 (0.0%) | $0 |
| 4-Person Families | 27 (42.2%) | $0 |
| 5-Person Families | 0 (0.0%) | $0 |
| 6-Person Families | 0 (0.0%) | $0 |
| 7+ Person Families | 0 (0.0%) | $0 |
| Total | 64 (100.0%) | $38,068 |
Family Income by Number of Earners in Los Panes
| Number of Earners | # Families | Median Income |
| No Earners | 0 (0.0%) | $0 |
| 1 Earner | 42 (65.6%) | $0 |
| 2 Earners | 22 (34.4%) | $0 |
| 3+ Earners | 0 (0.0%) | $0 |
| Total | 64 (100.0%) | $38,068 |
Household Income in Los Panes
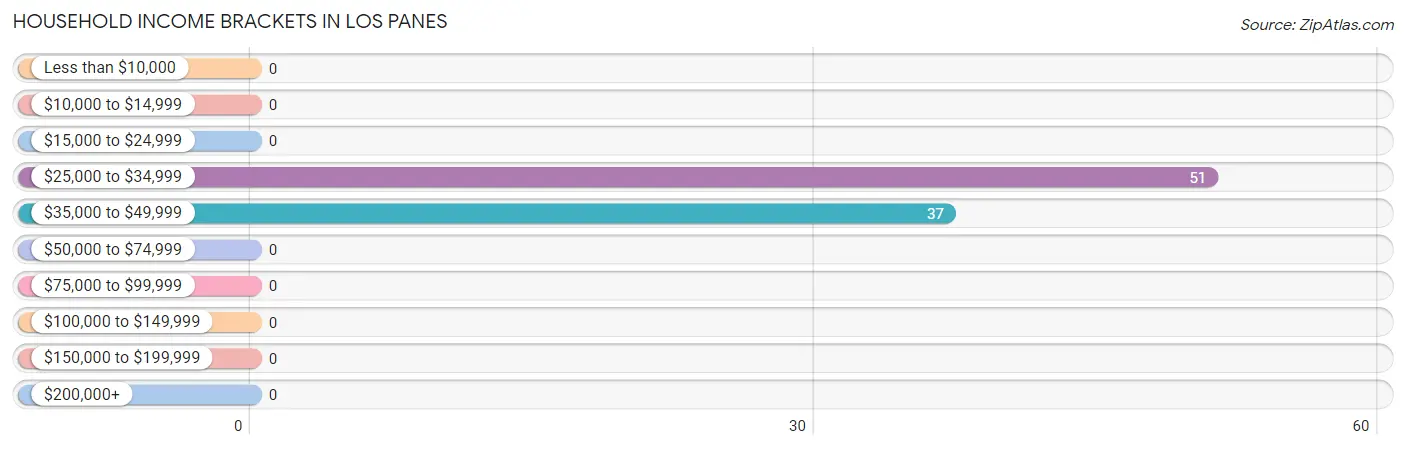
Household Income Brackets in Los Panes
With 51 households falling in the category, the $25,000 to $34,999 income range is the most frequent in Los Panes, accounting for 58.0% of all households.
| Income Bracket | # Households | % Households |
| Less than $10,000 | 0 | 0.0% |
| $10,000 to $14,999 | 0 | 0.0% |
| $15,000 to $24,999 | 0 | 0.0% |
| $25,000 to $34,999 | 51 | 58.0% |
| $35,000 to $49,999 | 37 | 42.0% |
| $50,000 to $74,999 | 0 | 0.0% |
| $75,000 to $99,999 | 0 | 0.0% |
| $100,000 to $149,999 | 0 | 0.0% |
| $150,000 to $199,999 | 0 | 0.0% |
| $200,000+ | 0 | 0.0% |
Household Income by Householder Age in Los Panes
The median household income in Los Panes is $29,352, with the highest median household income of $28,333 found in the 65+ years age bracket for the primary householder. A total of 66 households (75.0%) fall into this category.
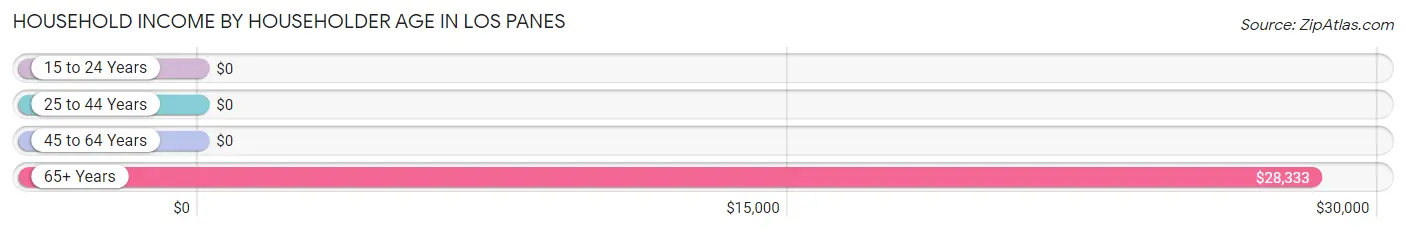
| Income Bracket | # Households | Median Income |
| 15 to 24 Years | 0 (0.0%) | $0 |
| 25 to 44 Years | 0 (0.0%) | $0 |
| 45 to 64 Years | 22 (25.0%) | $0 |
| 65+ Years | 66 (75.0%) | $28,333 |
| Total | 88 (100.0%) | $29,352 |
Poverty in Los Panes
Income Below Poverty by Sex and Age in Los Panes
With 63.7% poverty level for males and 62.8% for females among the residents of Los Panes, 16 and 17 year old males and 18 to 24 year old females are the most vulnerable to poverty, with 42 males (100.0%) and 33 females (100.0%) in their respective age groups living below the poverty level.
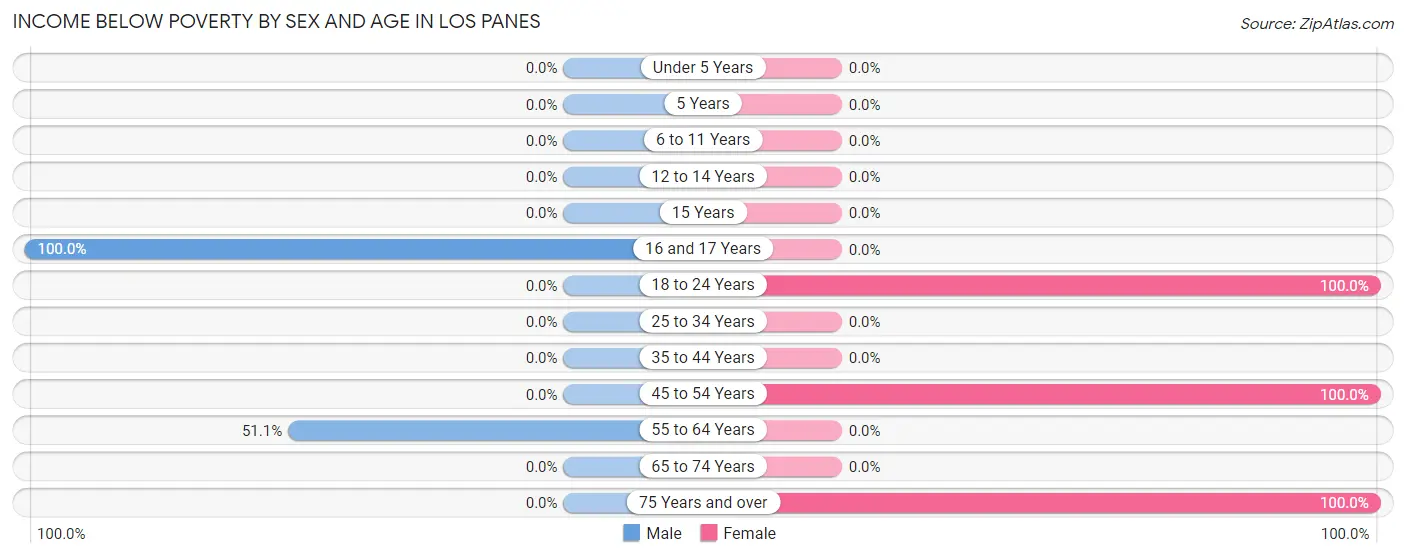
| Age Bracket | Male | Female |
| Under 5 Years | 0 (0.0%) | 0 (0.0%) |
| 5 Years | 0 (0.0%) | 0 (0.0%) |
| 6 to 11 Years | 0 (0.0%) | 0 (0.0%) |
| 12 to 14 Years | 0 (0.0%) | 0 (0.0%) |
| 15 Years | 0 (0.0%) | 0 (0.0%) |
| 16 and 17 Years | 42 (100.0%) | 0 (0.0%) |
| 18 to 24 Years | 0 (0.0%) | 33 (100.0%) |
| 25 to 34 Years | 0 (0.0%) | 0 (0.0%) |
| 35 to 44 Years | 0 (0.0%) | 0 (0.0%) |
| 45 to 54 Years | 0 (0.0%) | 43 (100.0%) |
| 55 to 64 Years | 23 (51.1%) | 0 (0.0%) |
| 65 to 74 Years | 0 (0.0%) | 0 (0.0%) |
| 75 Years and over | 0 (0.0%) | 27 (100.0%) |
| Total | 65 (63.7%) | 103 (62.8%) |
Income Above Poverty by Sex and Age in Los Panes
According to the poverty statistics in Los Panes, males aged 65 to 74 years and females aged 55 to 64 years are the age groups that are most secure financially, with 100.0% of males and 100.0% of females in these age groups living above the poverty line.
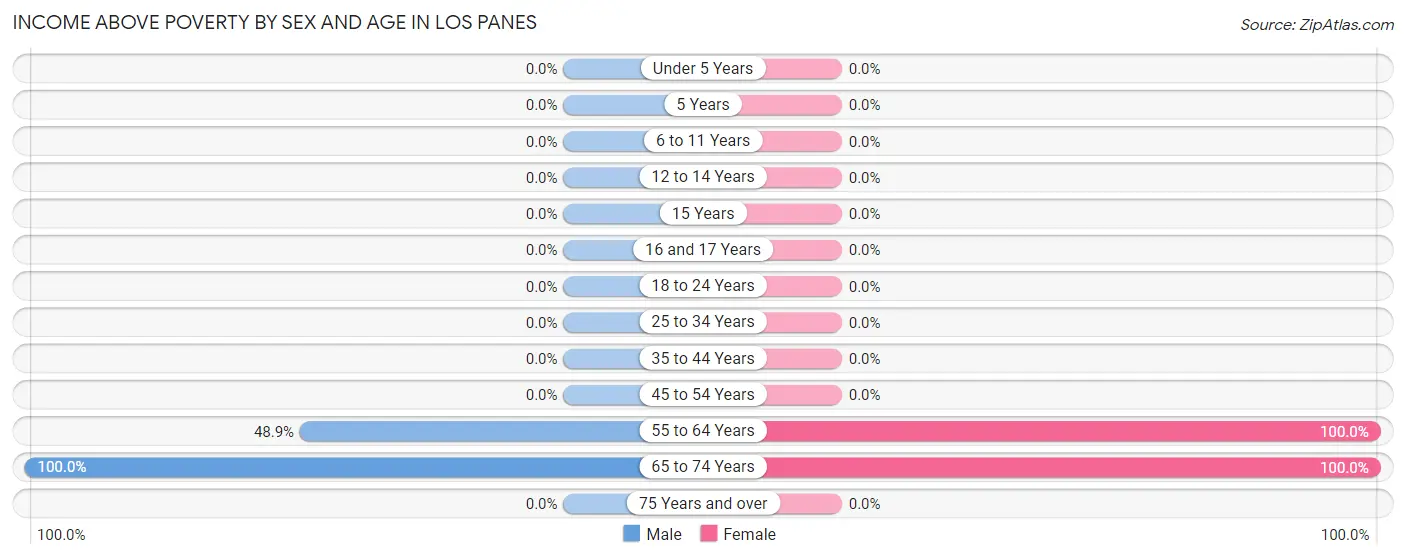
| Age Bracket | Male | Female |
| Under 5 Years | 0 (0.0%) | 0 (0.0%) |
| 5 Years | 0 (0.0%) | 0 (0.0%) |
| 6 to 11 Years | 0 (0.0%) | 0 (0.0%) |
| 12 to 14 Years | 0 (0.0%) | 0 (0.0%) |
| 15 Years | 0 (0.0%) | 0 (0.0%) |
| 16 and 17 Years | 0 (0.0%) | 0 (0.0%) |
| 18 to 24 Years | 0 (0.0%) | 0 (0.0%) |
| 25 to 34 Years | 0 (0.0%) | 0 (0.0%) |
| 35 to 44 Years | 0 (0.0%) | 0 (0.0%) |
| 45 to 54 Years | 0 (0.0%) | 0 (0.0%) |
| 55 to 64 Years | 22 (48.9%) | 22 (100.0%) |
| 65 to 74 Years | 15 (100.0%) | 39 (100.0%) |
| 75 Years and over | 0 (0.0%) | 0 (0.0%) |
| Total | 37 (36.3%) | 61 (37.2%) |
Income Below Poverty Among Married-Couple Families in Los Panes
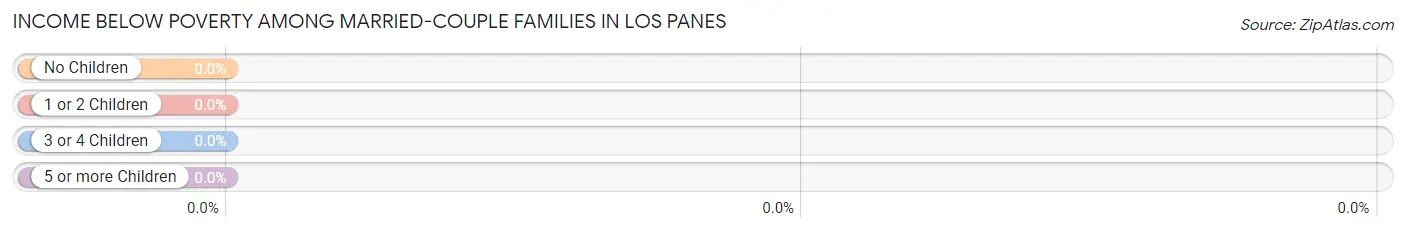
| Children | Above Poverty | Below Poverty |
| No Children | 37 (100.0%) | 0 (0.0%) |
| 1 or 2 Children | 0 (0.0%) | 0 (0.0%) |
| 3 or 4 Children | 0 (0.0%) | 0 (0.0%) |
| 5 or more Children | 0 (0.0%) | 0 (0.0%) |
| Total | 37 (100.0%) | 0 (0.0%) |
Income Below Poverty Among Single-Parent Households in Los Panes
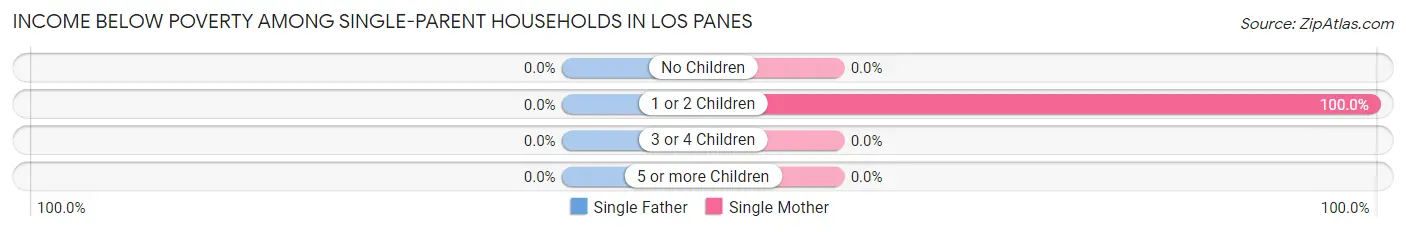
| Children | Single Father | Single Mother |
| No Children | 0 (0.0%) | 0 (0.0%) |
| 1 or 2 Children | 0 (0.0%) | 27 (100.0%) |
| 3 or 4 Children | 0 (0.0%) | 0 (0.0%) |
| 5 or more Children | 0 (0.0%) | 0 (0.0%) |
| Total | 0 (0.0%) | 27 (100.0%) |
Income Below Poverty Among Married-Couple vs Single-Parent Households in Los Panes
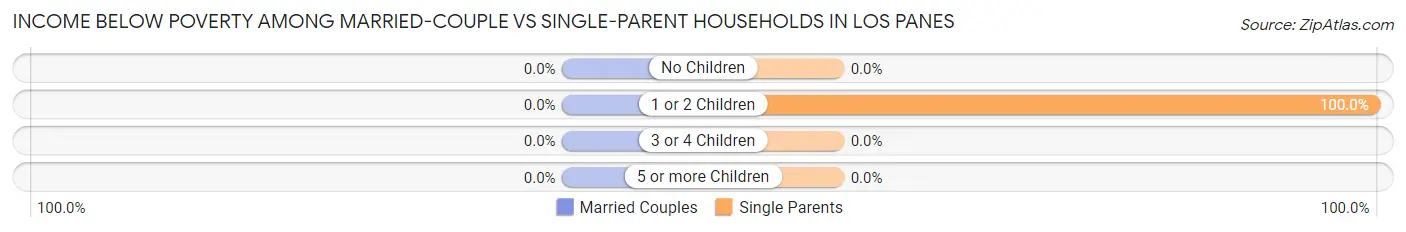
| Children | Married-Couple Families | Single-Parent Households |
| No Children | 0 (0.0%) | 0 (0.0%) |
| 1 or 2 Children | 0 (0.0%) | 27 (100.0%) |
| 3 or 4 Children | 0 (0.0%) | 0 (0.0%) |
| 5 or more Children | 0 (0.0%) | 0 (0.0%) |
| Total | 0 (0.0%) | 27 (100.0%) |
Race in Los Panes
The most populous races in Los Panes are Hispanic or Latino (266 | 100.0%), White / Caucasian (199 | 74.8%), and Two or more Races (44 | 16.5%).
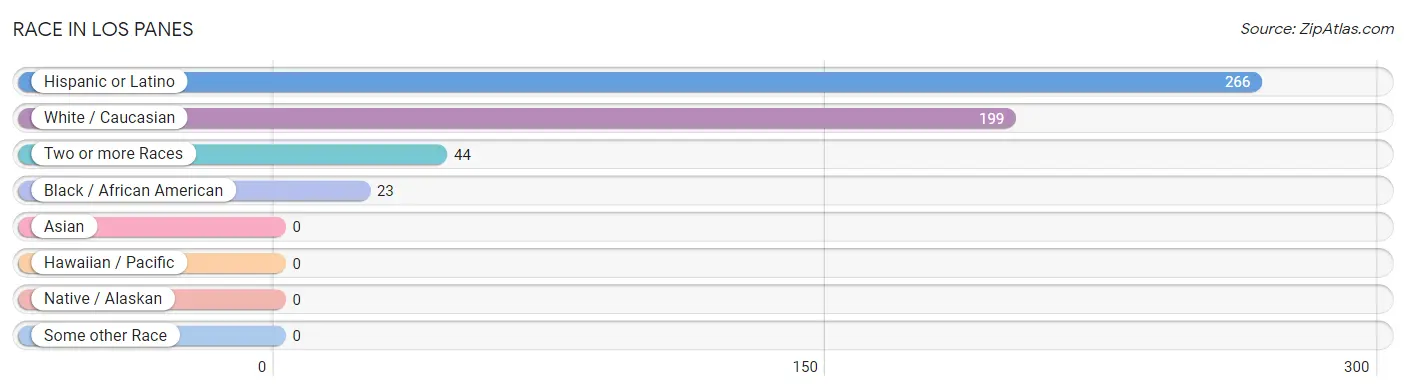
| Race | # Population | % Population |
| Asian | 0 | 0.0% |
| Black / African American | 23 | 8.6% |
| Hawaiian / Pacific | 0 | 0.0% |
| Hispanic or Latino | 266 | 100.0% |
| Native / Alaskan | 0 | 0.0% |
| White / Caucasian | 199 | 74.8% |
| Two or more Races | 44 | 16.5% |
| Some other Race | 0 | 0.0% |
| Total | 266 | 100.0% |
Ancestry in Los Panes
The most populous ancestries reported in Los Panes are , and Puerto Rican (266 | 100.0%), together accounting for 100.0% of all Los Panes residents.

| Ancestry | # Population | % Population |
| Puerto Rican | 266 | 100.0% | View All 1 Rows |
Immigrants in Los Panes

| Immigration Origin | # Population | % Population | View All 0 Rows |
Sex and Age in Los Panes
Sex and Age in Los Panes
The most populous age groups in Los Panes are 60 to 64 Years (45 | 44.1%) for men and 45 to 49 Years (43 | 26.2%) for women.
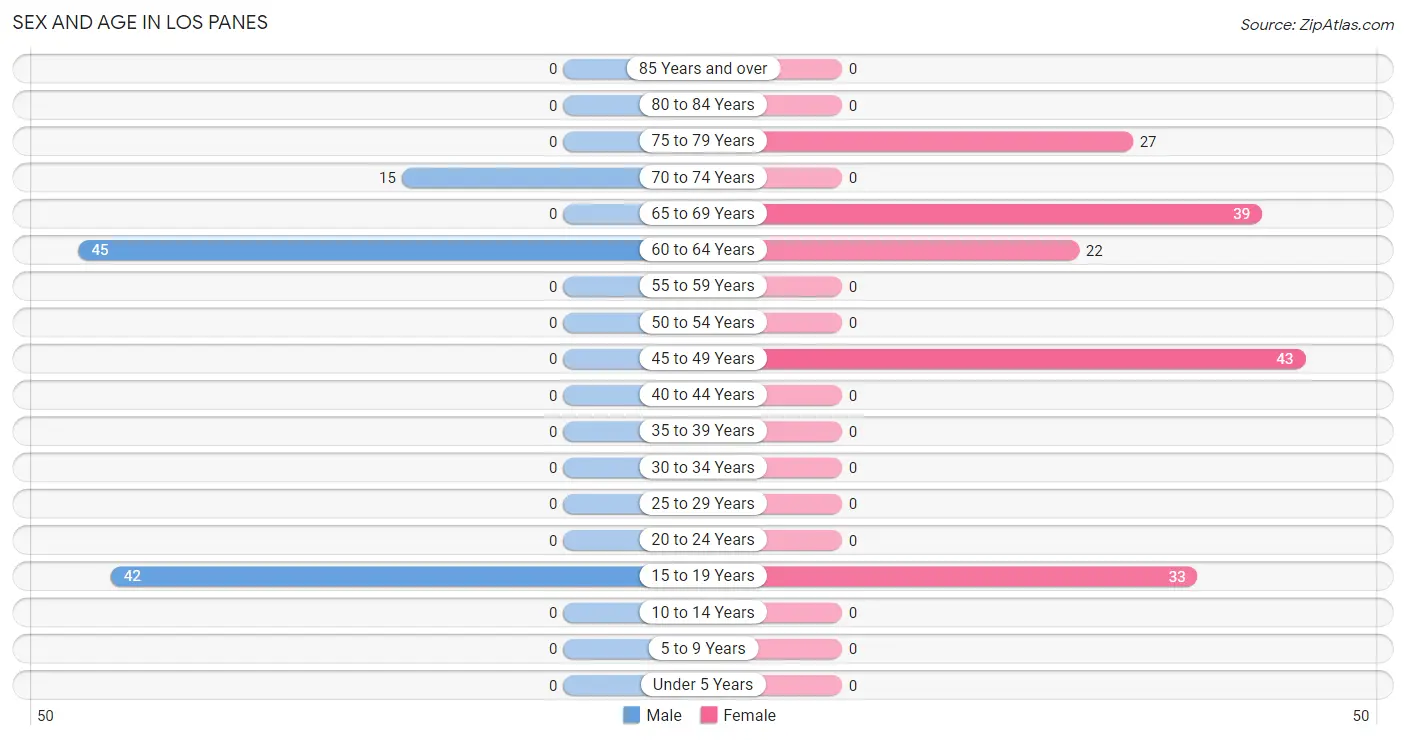
| Age Bracket | Male | Female |
| Under 5 Years | 0 (0.0%) | 0 (0.0%) |
| 5 to 9 Years | 0 (0.0%) | 0 (0.0%) |
| 10 to 14 Years | 0 (0.0%) | 0 (0.0%) |
| 15 to 19 Years | 42 (41.2%) | 33 (20.1%) |
| 20 to 24 Years | 0 (0.0%) | 0 (0.0%) |
| 25 to 29 Years | 0 (0.0%) | 0 (0.0%) |
| 30 to 34 Years | 0 (0.0%) | 0 (0.0%) |
| 35 to 39 Years | 0 (0.0%) | 0 (0.0%) |
| 40 to 44 Years | 0 (0.0%) | 0 (0.0%) |
| 45 to 49 Years | 0 (0.0%) | 43 (26.2%) |
| 50 to 54 Years | 0 (0.0%) | 0 (0.0%) |
| 55 to 59 Years | 0 (0.0%) | 0 (0.0%) |
| 60 to 64 Years | 45 (44.1%) | 22 (13.4%) |
| 65 to 69 Years | 0 (0.0%) | 39 (23.8%) |
| 70 to 74 Years | 15 (14.7%) | 0 (0.0%) |
| 75 to 79 Years | 0 (0.0%) | 27 (16.5%) |
| 80 to 84 Years | 0 (0.0%) | 0 (0.0%) |
| 85 Years and over | 0 (0.0%) | 0 (0.0%) |
| Total | 102 (100.0%) | 164 (100.0%) |
Families and Households in Los Panes
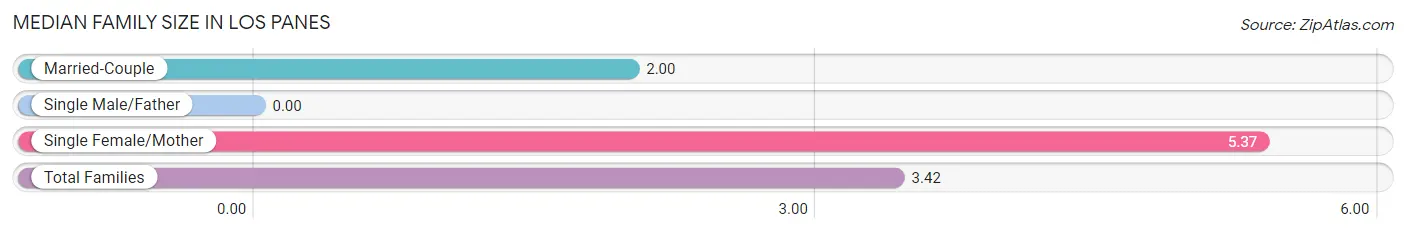
Median Family Size in Los Panes
| Family Type | # Families | Family Size |
| Married-Couple | 37 (57.8%) | 2.00 |
| Single Male/Father | 0 (0.0%) | - |
| Single Female/Mother | 27 (42.2%) | 5.37 |
| Total Families | 64 (100.0%) | 3.42 |
Median Household Size in Los Panes
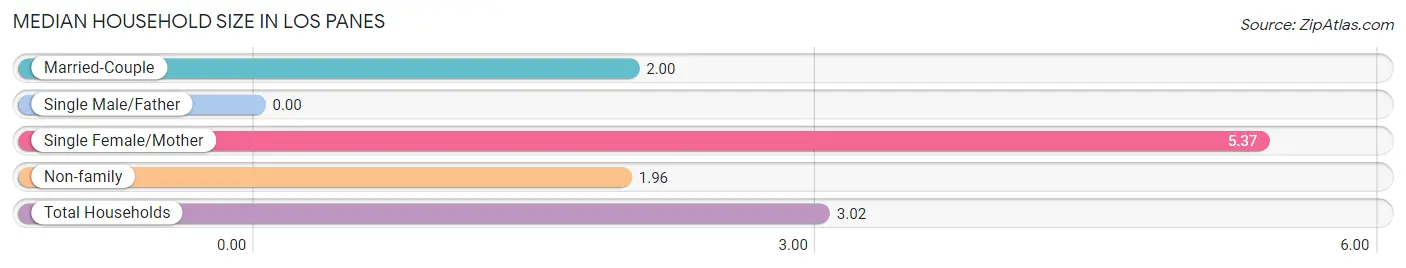
| Household Type | # Households | Household Size |
| Married-Couple | 37 (42.0%) | 2.00 |
| Single Male/Father | 0 (0.0%) | - |
| Single Female/Mother | 27 (30.7%) | 5.37 |
| Non-family | 24 (27.3%) | 1.96 |
| Total Households | 88 (100.0%) | 3.02 |
Household Size by Marriage Status in Los Panes
Out of a total of 88 households in Los Panes, 64 (72.7%) are family households, while 24 (27.3%) are nonfamily households. The most numerous type of family households are 2-person households, comprising 37, and the most common type of nonfamily households are 2-person households, comprising 24.
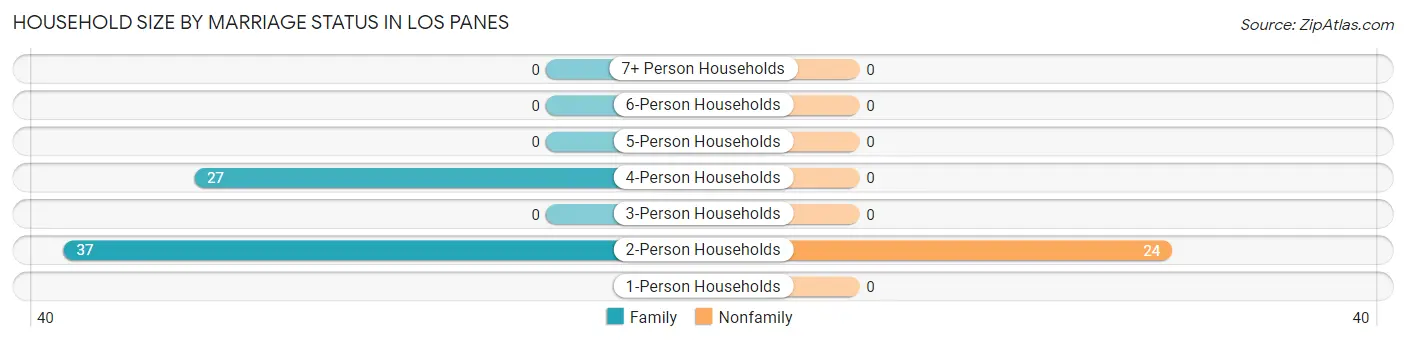
| Household Size | Family Households | Nonfamily Households |
| 1-Person Households | - | 0 (0.0%) |
| 2-Person Households | 37 (42.0%) | 24 (27.3%) |
| 3-Person Households | 0 (0.0%) | 0 (0.0%) |
| 4-Person Households | 27 (30.7%) | 0 (0.0%) |
| 5-Person Households | 0 (0.0%) | 0 (0.0%) |
| 6-Person Households | 0 (0.0%) | 0 (0.0%) |
| 7+ Person Households | 0 (0.0%) | 0 (0.0%) |
| Total | 64 (72.7%) | 24 (27.3%) |
Female Fertility in Los Panes
Fertility by Age in Los Panes
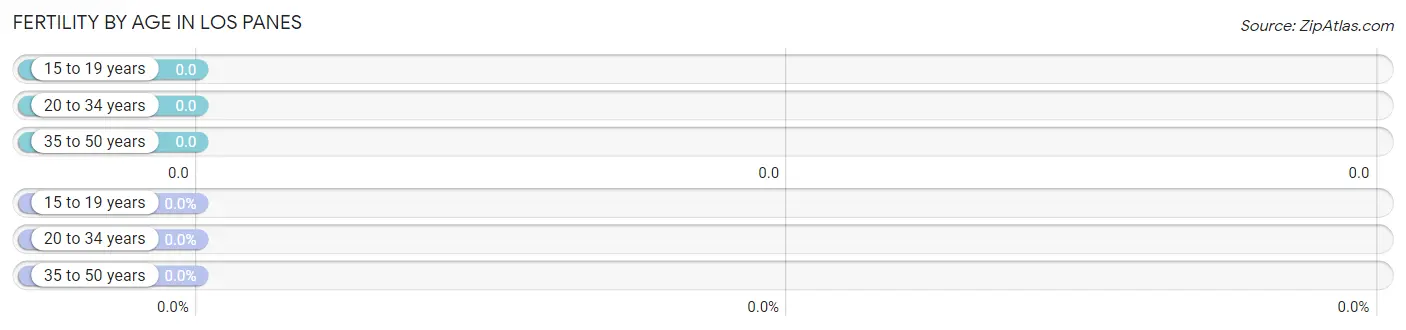
| Age Bracket | Women with Births | Births / 1,000 Women |
| 15 to 19 years | 0 (0.0%) | 0.0 |
| 20 to 34 years | 0 (0.0%) | 0.0 |
| 35 to 50 years | 0 (0.0%) | 0.0 |
| Total | 0 (0.0%) | 0.0 |
Fertility by Age by Marriage Status in Los Panes
| Age Bracket | Married | Unmarried |
| 15 to 19 years | 0 (0.0%) | 0 (0.0%) |
| 20 to 34 years | 0 (0.0%) | 0 (0.0%) |
| 35 to 50 years | 0 (0.0%) | 0 (0.0%) |
| Total | 0 (0.0%) | 0 (0.0%) |
Fertility by Education in Los Panes
| Educational Attainment | Women with Births | Births / 1,000 Women |
| Less than High School | 0 (0.0%) | 0.0 |
| High School Diploma | 0 (0.0%) | 0.0 |
| College or Associate's Degree | 0 (0.0%) | 0.0 |
| Bachelor's Degree | 0 (0.0%) | 0.0 |
| Graduate Degree | 0 (0.0%) | 0.0 |
| Total | 0 (0.0%) | 0.0 |
Fertility by Education by Marriage Status in Los Panes
| Educational Attainment | Married | Unmarried |
| Less than High School | 0 (0.0%) | 0 (0.0%) |
| High School Diploma | 0 (0.0%) | 0 (0.0%) |
| College or Associate's Degree | 0 (0.0%) | 0 (0.0%) |
| Bachelor's Degree | 0 (0.0%) | 0 (0.0%) |
| Graduate Degree | 0 (0.0%) | 0 (0.0%) |
| Total | 0 (0.0%) | 0 (0.0%) |
Employment Characteristics in Los Panes
Employment by Class of Employer in Los Panes
Among the 65 employed individuals in Los Panes, , and private company employees (65 | 100.0%) make up the most common classes of employment.
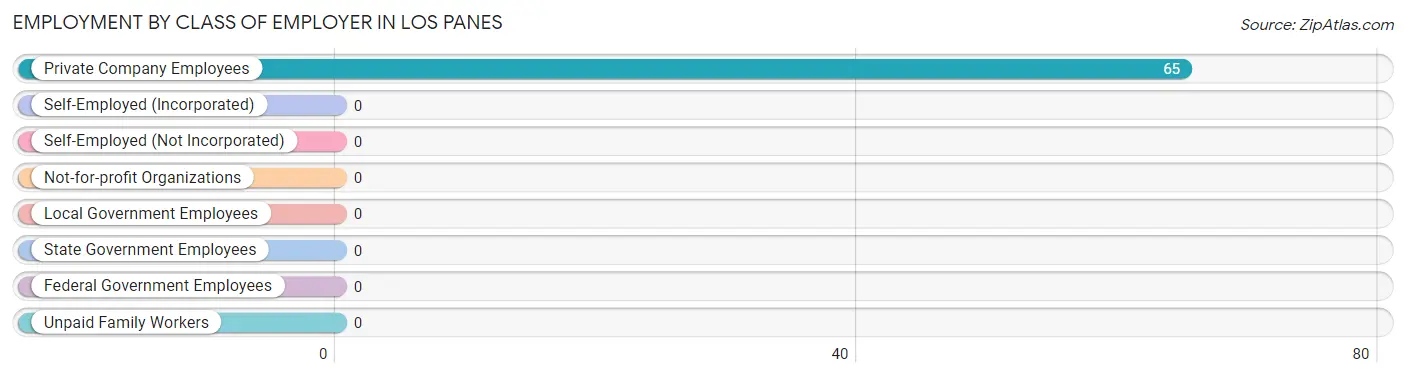
| Employer Class | # Employees | % Employees |
| Private Company Employees | 65 | 100.0% |
| Self-Employed (Incorporated) | 0 | 0.0% |
| Self-Employed (Not Incorporated) | 0 | 0.0% |
| Not-for-profit Organizations | 0 | 0.0% |
| Local Government Employees | 0 | 0.0% |
| State Government Employees | 0 | 0.0% |
| Federal Government Employees | 0 | 0.0% |
| Unpaid Family Workers | 0 | 0.0% |
| Total | 65 | 100.0% |
Employment Status by Age in Los Panes
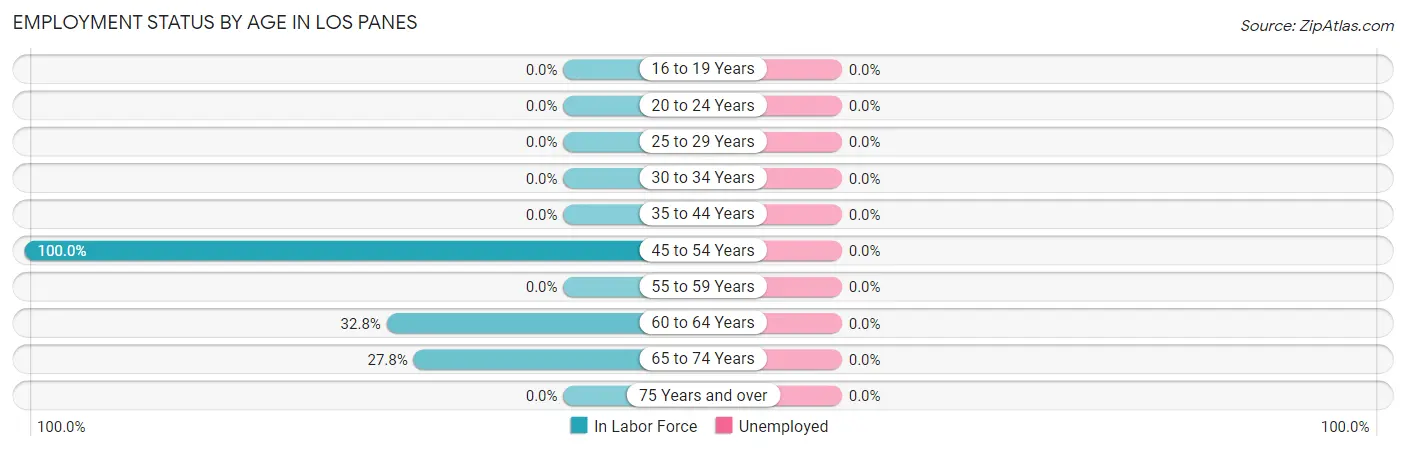
| Age Bracket | In Labor Force | Unemployed |
| 16 to 19 Years | 0 (0.0%) | 0 (0.0%) |
| 20 to 24 Years | 0 (0.0%) | 0 (0.0%) |
| 25 to 29 Years | 0 (0.0%) | 0 (0.0%) |
| 30 to 34 Years | 0 (0.0%) | 0 (0.0%) |
| 35 to 44 Years | 0 (0.0%) | 0 (0.0%) |
| 45 to 54 Years | 43 (100.0%) | 0 (0.0%) |
| 55 to 59 Years | 0 (0.0%) | 0 (0.0%) |
| 60 to 64 Years | 22 (32.8%) | 0 (0.0%) |
| 65 to 74 Years | 15 (27.8%) | 0 (0.0%) |
| 75 Years and over | 0 (0.0%) | 0 (0.0%) |
| Total | 80 (30.1%) | 0 (0.0%) |
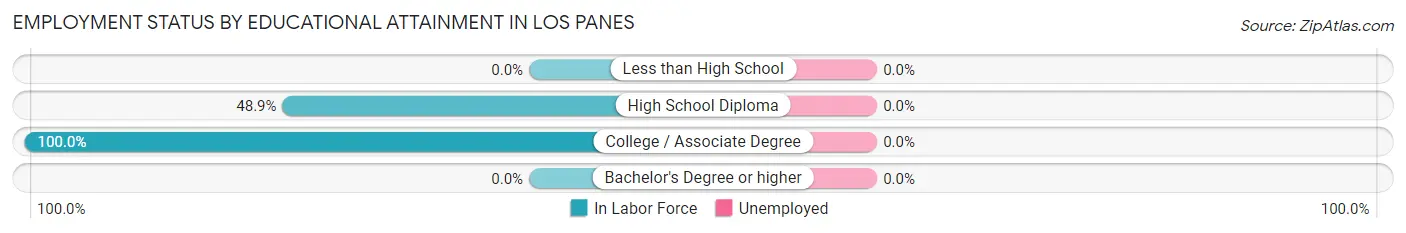
Employment Status by Educational Attainment in Los Panes
| Educational Attainment | In Labor Force | Unemployed |
| Less than High School | 0 (0.0%) | 0 (0.0%) |
| High School Diploma | 43 (48.9%) | 0 (0.0%) |
| College / Associate Degree | 22 (100.0%) | 0 (0.0%) |
| Bachelor's Degree or higher | 0 (0.0%) | 0 (0.0%) |
| Total | 65 (59.1%) | 0 (0.0%) |
Employment Occupations by Sex in Los Panes
Management, Business, Science and Arts Occupations
The most common Management, Business, Science and Arts occupations in Los Panes are , and Management (15 | 18.8%).
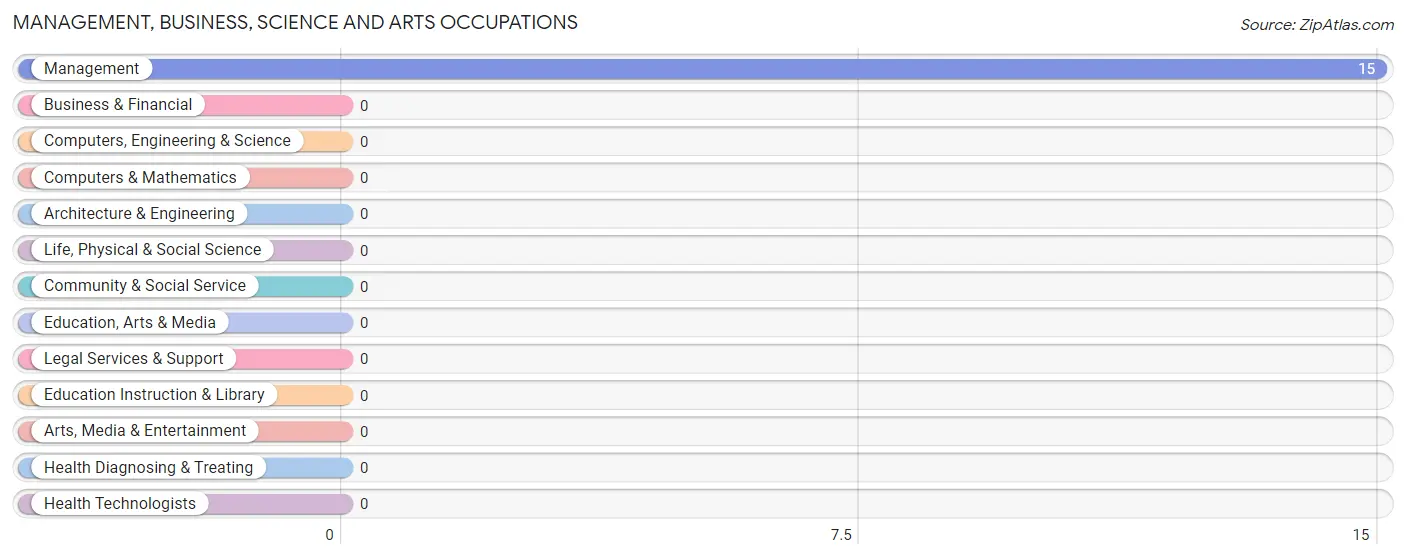
Management, Business, Science and Arts Occupations by Sex
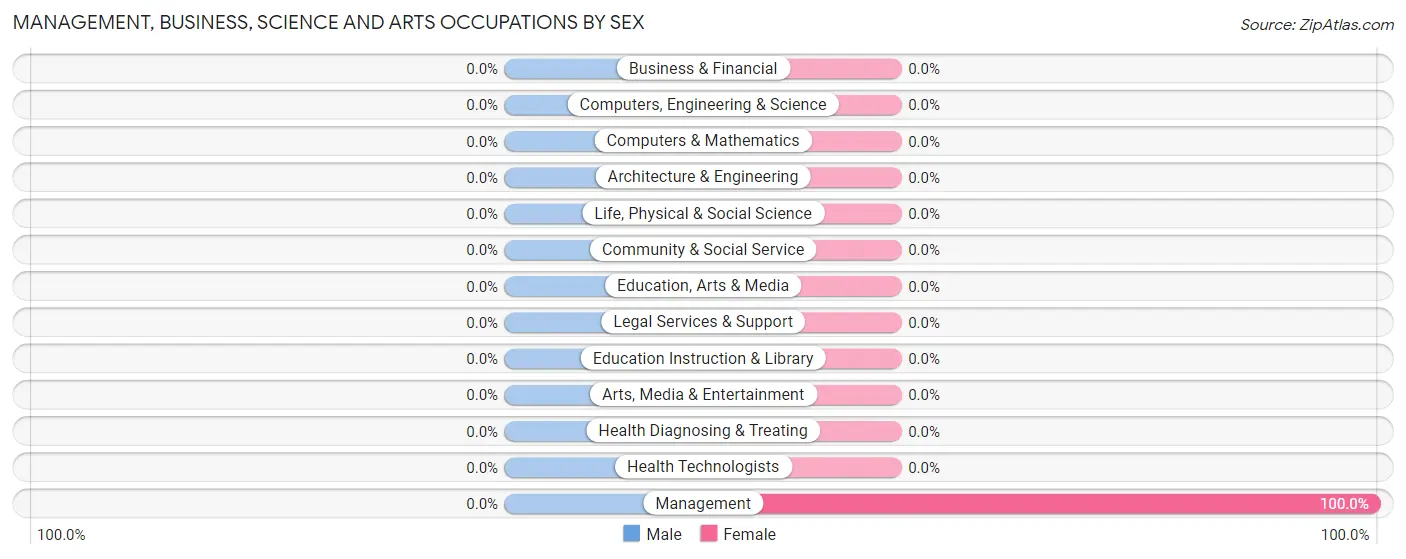
| Occupation | Male | Female |
| Management | 0 (0.0%) | 15 (100.0%) |
| Business & Financial | 0 (0.0%) | 0 (0.0%) |
| Computers, Engineering & Science | 0 (0.0%) | 0 (0.0%) |
| Computers & Mathematics | 0 (0.0%) | 0 (0.0%) |
| Architecture & Engineering | 0 (0.0%) | 0 (0.0%) |
| Life, Physical & Social Science | 0 (0.0%) | 0 (0.0%) |
| Community & Social Service | 0 (0.0%) | 0 (0.0%) |
| Education, Arts & Media | 0 (0.0%) | 0 (0.0%) |
| Legal Services & Support | 0 (0.0%) | 0 (0.0%) |
| Education Instruction & Library | 0 (0.0%) | 0 (0.0%) |
| Arts, Media & Entertainment | 0 (0.0%) | 0 (0.0%) |
| Health Diagnosing & Treating | 0 (0.0%) | 0 (0.0%) |
| Health Technologists | 0 (0.0%) | 0 (0.0%) |
| Total (Category) | 0 (0.0%) | 15 (100.0%) |
| Total (Overall) | 0 (0.0%) | 80 (100.0%) |
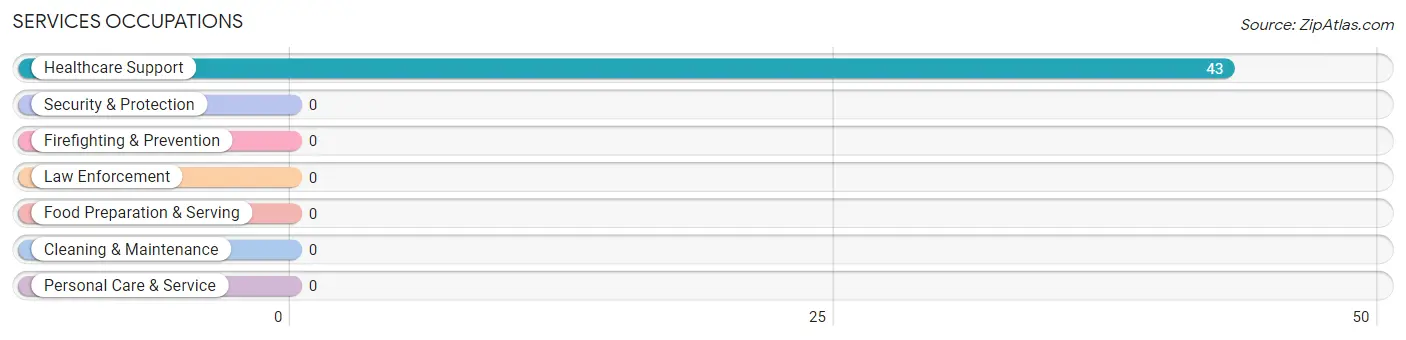
Services Occupations
The most common Services occupations in Los Panes are , and Healthcare Support (43 | 53.7%).
Services Occupations by Sex
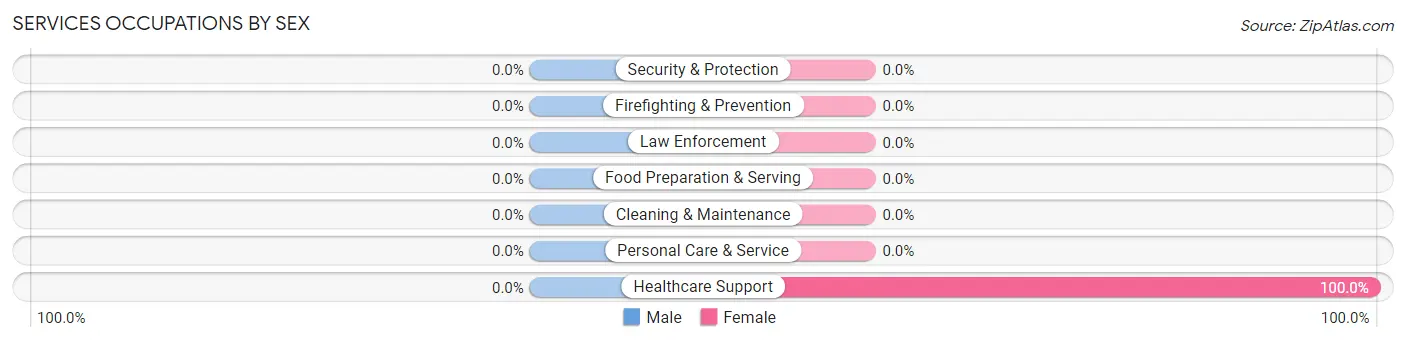
| Occupation | Male | Female |
| Healthcare Support | 0 (0.0%) | 43 (100.0%) |
| Security & Protection | 0 (0.0%) | 0 (0.0%) |
| Firefighting & Prevention | 0 (0.0%) | 0 (0.0%) |
| Law Enforcement | 0 (0.0%) | 0 (0.0%) |
| Food Preparation & Serving | 0 (0.0%) | 0 (0.0%) |
| Cleaning & Maintenance | 0 (0.0%) | 0 (0.0%) |
| Personal Care & Service | 0 (0.0%) | 0 (0.0%) |
| Total (Category) | 0 (0.0%) | 43 (100.0%) |
| Total (Overall) | 0 (0.0%) | 80 (100.0%) |
Sales and Office Occupations
The most common Sales and Office occupations in Los Panes are , and Office & Administration (22 | 27.5%).
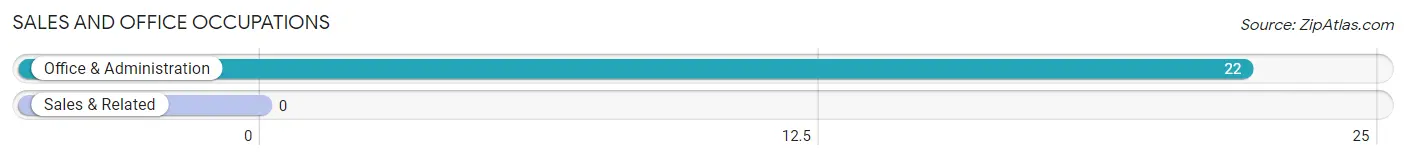
Sales and Office Occupations by Sex
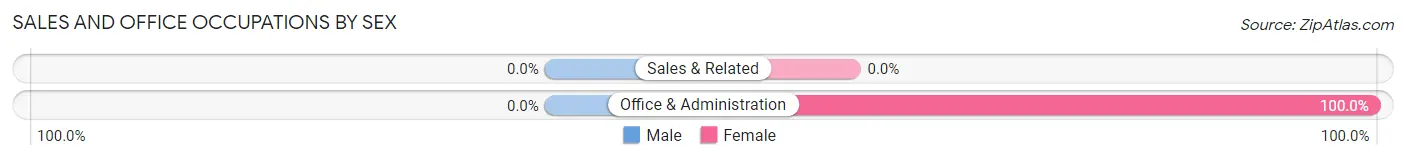
| Occupation | Male | Female |
| Sales & Related | 0 (0.0%) | 0 (0.0%) |
| Office & Administration | 0 (0.0%) | 22 (100.0%) |
| Total (Category) | 0 (0.0%) | 22 (100.0%) |
| Total (Overall) | 0 (0.0%) | 80 (100.0%) |
Natural Resources, Construction and Maintenance Occupations
Natural Resources, Construction and Maintenance Occupations by Sex
| Occupation | Male | Female |
| Farming, Fishing & Forestry | 0 (0.0%) | 0 (0.0%) |
| Construction & Extraction | 0 (0.0%) | 0 (0.0%) |
| Installation, Maintenance & Repair | 0 (0.0%) | 0 (0.0%) |
| Total (Category) | 0 (0.0%) | 0 (0.0%) |
| Total (Overall) | 0 (0.0%) | 80 (100.0%) |
Production, Transportation and Moving Occupations
Production, Transportation and Moving Occupations by Sex
| Occupation | Male | Female |
| Production | 0 (0.0%) | 0 (0.0%) |
| Transportation | 0 (0.0%) | 0 (0.0%) |
| Material Moving | 0 (0.0%) | 0 (0.0%) |
| Total (Category) | 0 (0.0%) | 0 (0.0%) |
| Total (Overall) | 0 (0.0%) | 80 (100.0%) |
Employment Industries by Sex in Los Panes
Employment Industries in Los Panes
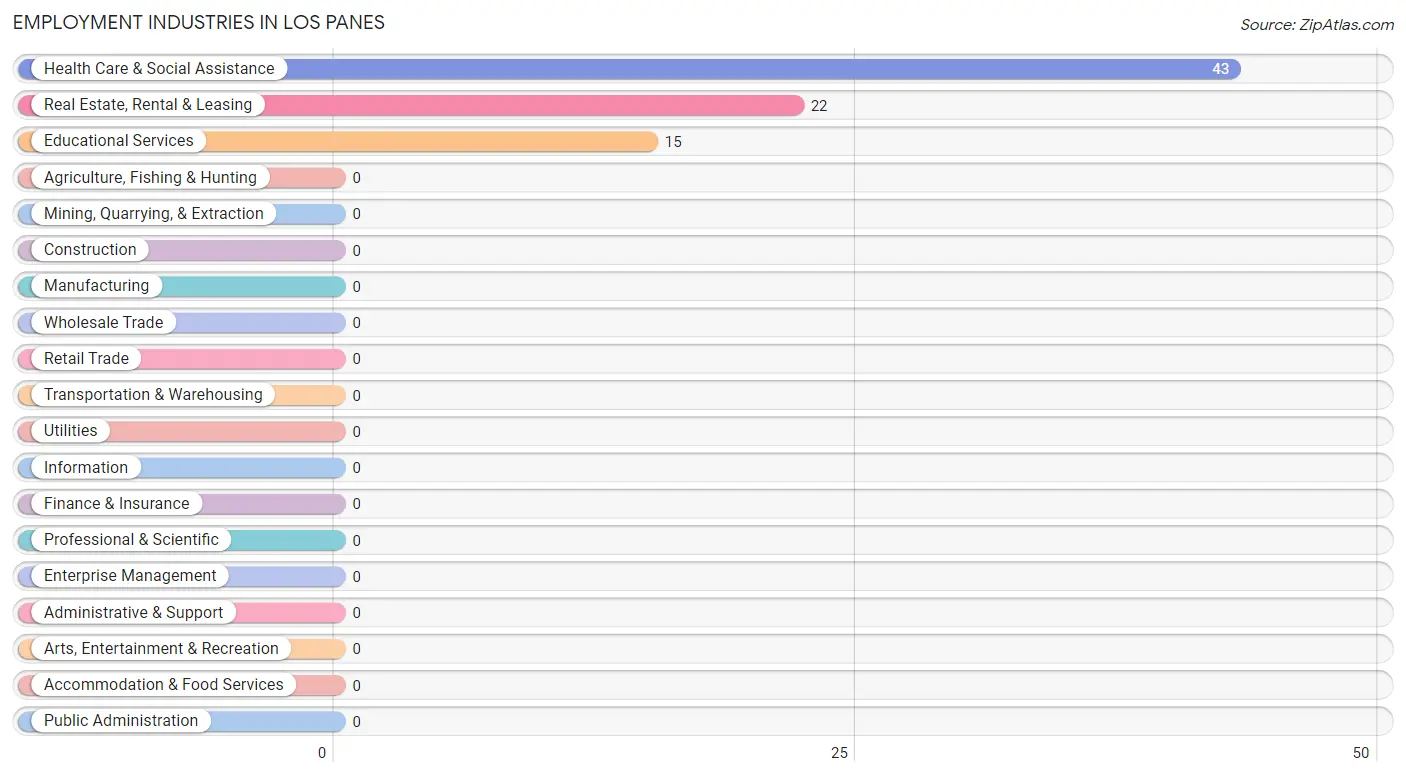
The major employment industries in Los Panes include Health Care & Social Assistance (43 | 53.7%), Real Estate, Rental & Leasing (22 | 27.5%), and Educational Services (15 | 18.8%).
Employment Industries by Sex in Los Panes
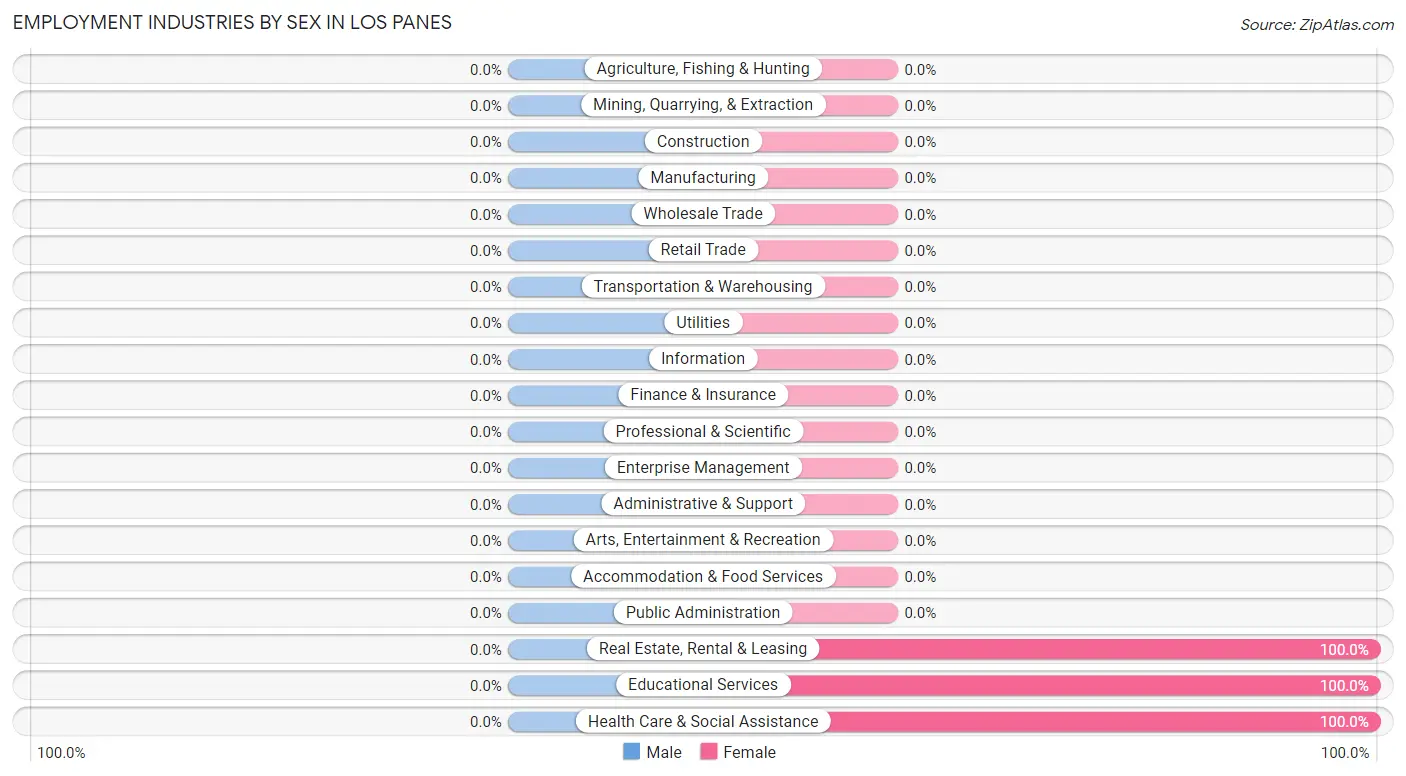
| Industry | Male | Female |
| Agriculture, Fishing & Hunting | 0 (0.0%) | 0 (0.0%) |
| Mining, Quarrying, & Extraction | 0 (0.0%) | 0 (0.0%) |
| Construction | 0 (0.0%) | 0 (0.0%) |
| Manufacturing | 0 (0.0%) | 0 (0.0%) |
| Wholesale Trade | 0 (0.0%) | 0 (0.0%) |
| Retail Trade | 0 (0.0%) | 0 (0.0%) |
| Transportation & Warehousing | 0 (0.0%) | 0 (0.0%) |
| Utilities | 0 (0.0%) | 0 (0.0%) |
| Information | 0 (0.0%) | 0 (0.0%) |
| Finance & Insurance | 0 (0.0%) | 0 (0.0%) |
| Real Estate, Rental & Leasing | 0 (0.0%) | 22 (100.0%) |
| Professional & Scientific | 0 (0.0%) | 0 (0.0%) |
| Enterprise Management | 0 (0.0%) | 0 (0.0%) |
| Administrative & Support | 0 (0.0%) | 0 (0.0%) |
| Educational Services | 0 (0.0%) | 15 (100.0%) |
| Health Care & Social Assistance | 0 (0.0%) | 43 (100.0%) |
| Arts, Entertainment & Recreation | 0 (0.0%) | 0 (0.0%) |
| Accommodation & Food Services | 0 (0.0%) | 0 (0.0%) |
| Public Administration | 0 (0.0%) | 0 (0.0%) |
| Total | 0 (0.0%) | 80 (100.0%) |
Education in Los Panes
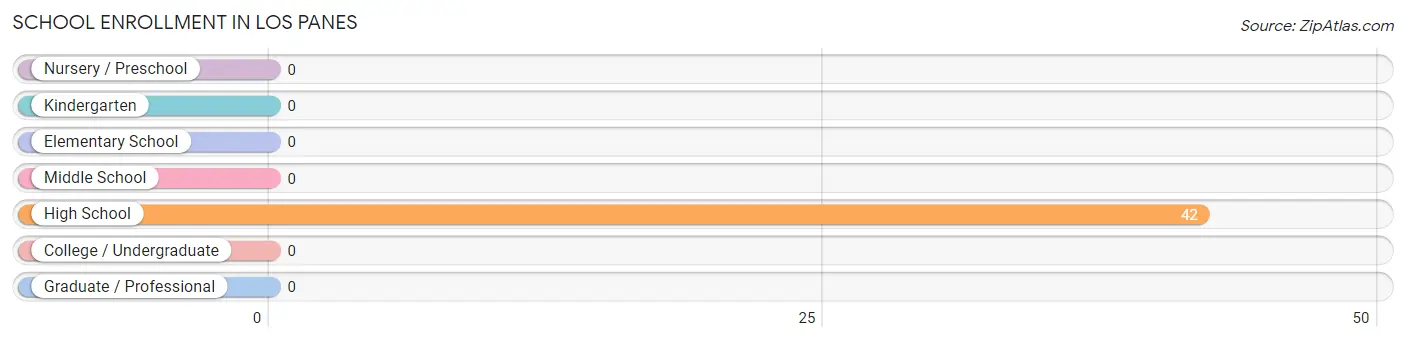
School Enrollment in Los Panes
| School Level | # Students | % Students |
| Nursery / Preschool | 0 | 0.0% |
| Kindergarten | 0 | 0.0% |
| Elementary School | 0 | 0.0% |
| Middle School | 0 | 0.0% |
| High School | 42 | 100.0% |
| College / Undergraduate | 0 | 0.0% |
| Graduate / Professional | 0 | 0.0% |
| Total | 42 | 100.0% |
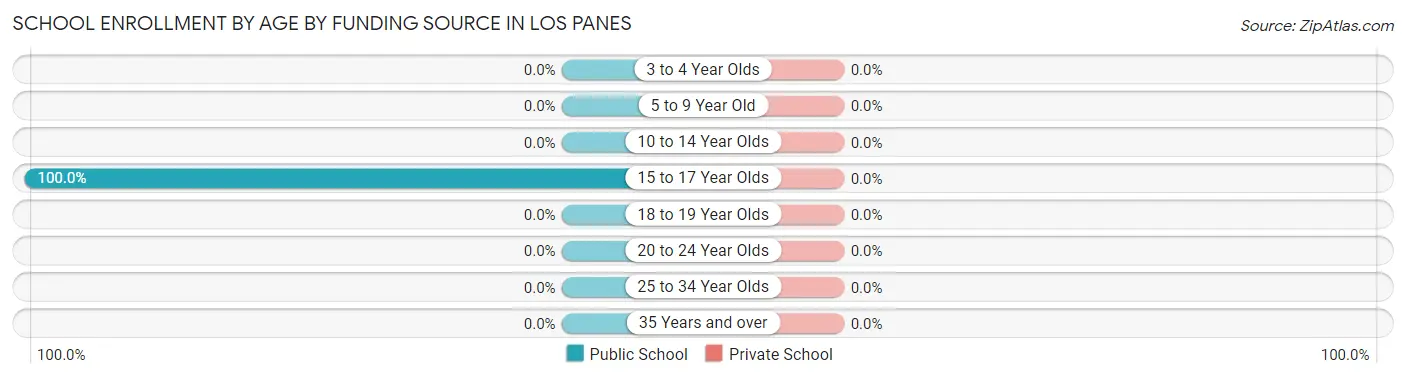
School Enrollment by Age by Funding Source in Los Panes
| Age Bracket | Public School | Private School |
| 3 to 4 Year Olds | 0 (0.0%) | 0 (0.0%) |
| 5 to 9 Year Old | 0 (0.0%) | 0 (0.0%) |
| 10 to 14 Year Olds | 0 (0.0%) | 0 (0.0%) |
| 15 to 17 Year Olds | 42 (100.0%) | 0 (0.0%) |
| 18 to 19 Year Olds | 0 (0.0%) | 0 (0.0%) |
| 20 to 24 Year Olds | 0 (0.0%) | 0 (0.0%) |
| 25 to 34 Year Olds | 0 (0.0%) | 0 (0.0%) |
| 35 Years and over | 0 (0.0%) | 0 (0.0%) |
| Total | 42 (100.0%) | 0 (0.0%) |
Educational Attainment by Field of Study in Los Panes
| Field of Study | # Graduates | % Graduates |
| Computers & Mathematics | 0 | 0.0% |
| Bio, Nature & Agricultural | 0 | 0.0% |
| Physical & Health Sciences | 0 | 0.0% |
| Psychology | 0 | 0.0% |
| Social Sciences | 0 | 0.0% |
| Engineering | 0 | 0.0% |
| Multidisciplinary Studies | 0 | 0.0% |
| Science & Technology | 0 | 0.0% |
| Business | 0 | 0.0% |
| Education | 0 | 0.0% |
| Literature & Languages | 0 | 0.0% |
| Liberal Arts & History | 0 | 0.0% |
| Visual & Performing Arts | 0 | 0.0% |
| Communications | 0 | 0.0% |
| Arts & Humanities | 0 | 0.0% |
| Total | 0 | 0.0% |
Transportation & Commute in Los Panes
Vehicle Availability by Sex in Los Panes
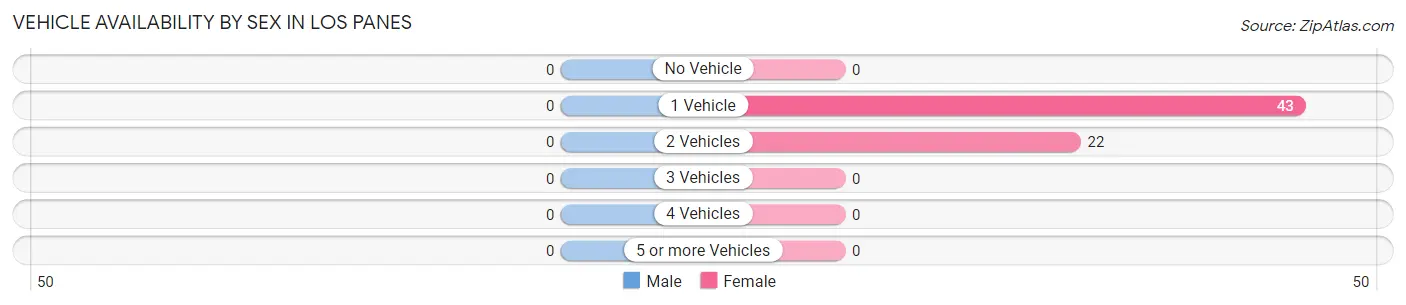
| Vehicles Available | Male | Female |
| No Vehicle | 0 (0.0%) | 0 (0.0%) |
| 1 Vehicle | 0 (0.0%) | 43 (66.1%) |
| 2 Vehicles | 0 (0.0%) | 22 (33.9%) |
| 3 Vehicles | 0 (0.0%) | 0 (0.0%) |
| 4 Vehicles | 0 (0.0%) | 0 (0.0%) |
| 5 or more Vehicles | 0 (0.0%) | 0 (0.0%) |
| Total | 0 (0.0%) | 65 (100.0%) |
Commute Time in Los Panes
The most frequently occuring commute durations in Los Panes are 10 to 14 minutes (43 commuters, 66.1%), 15 to 19 minutes (22 commuters, 33.9%), and less than 5 minutes (0 commuters, 0.0%).
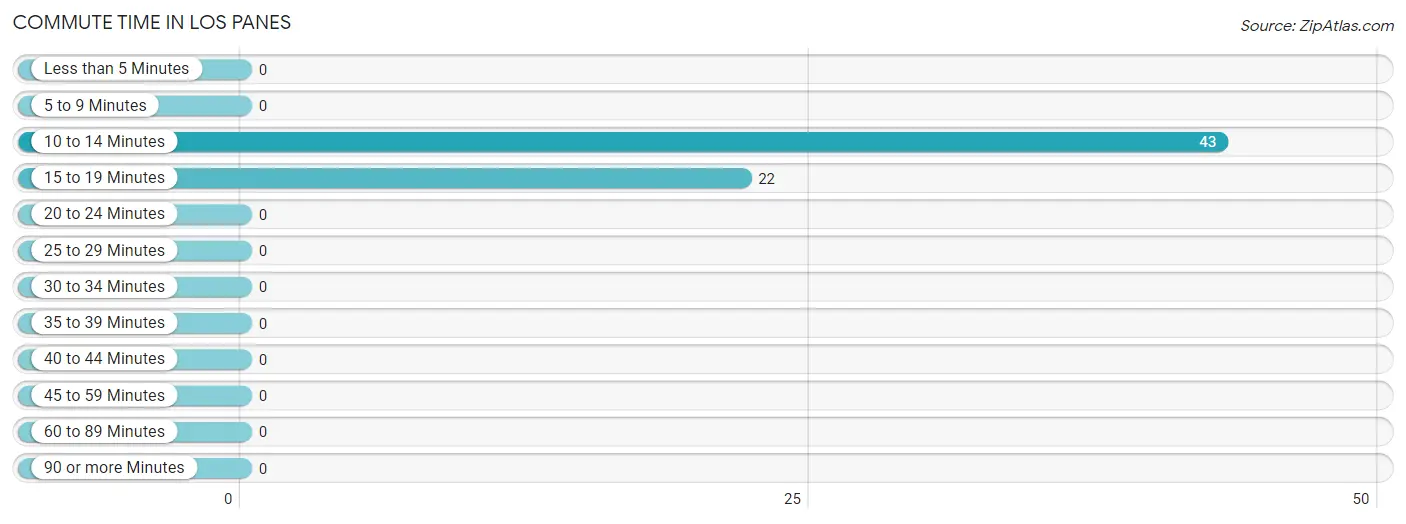
| Commute Time | # Commuters | % Commuters |
| Less than 5 Minutes | 0 | 0.0% |
| 5 to 9 Minutes | 0 | 0.0% |
| 10 to 14 Minutes | 43 | 66.1% |
| 15 to 19 Minutes | 22 | 33.9% |
| 20 to 24 Minutes | 0 | 0.0% |
| 25 to 29 Minutes | 0 | 0.0% |
| 30 to 34 Minutes | 0 | 0.0% |
| 35 to 39 Minutes | 0 | 0.0% |
| 40 to 44 Minutes | 0 | 0.0% |
| 45 to 59 Minutes | 0 | 0.0% |
| 60 to 89 Minutes | 0 | 0.0% |
| 90 or more Minutes | 0 | 0.0% |
Commute Time by Sex in Los Panes
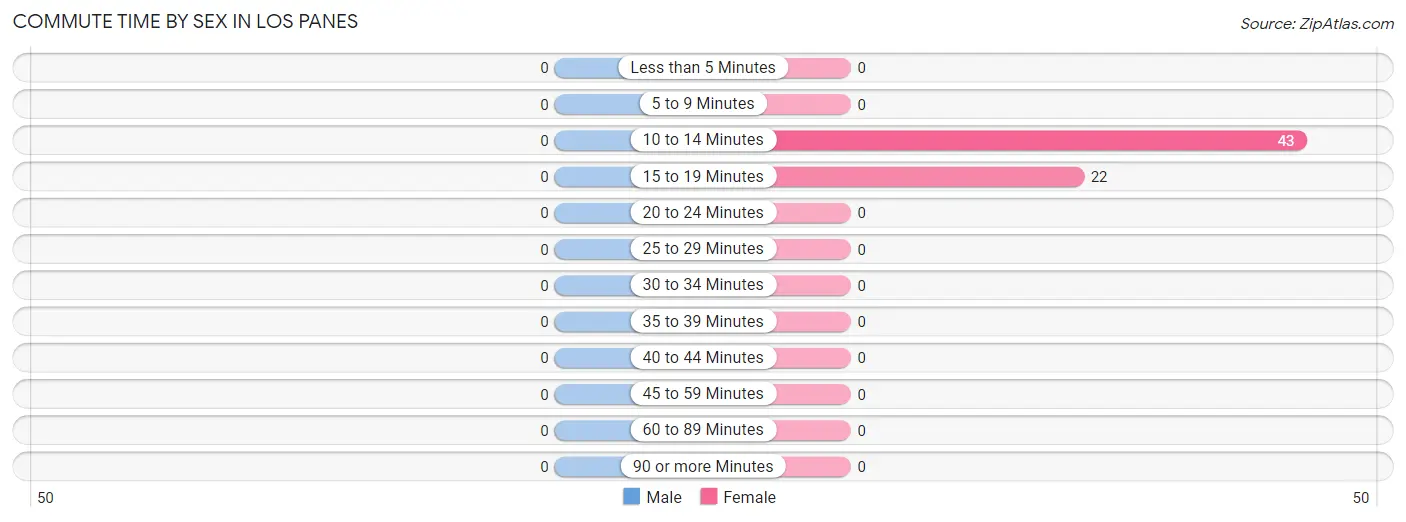
| Commute Time | Male | Female |
| Less than 5 Minutes | 0 (0.0%) | 0 (0.0%) |
| 5 to 9 Minutes | 0 (0.0%) | 0 (0.0%) |
| 10 to 14 Minutes | 0 (0.0%) | 43 (66.1%) |
| 15 to 19 Minutes | 0 (0.0%) | 22 (33.9%) |
| 20 to 24 Minutes | 0 (0.0%) | 0 (0.0%) |
| 25 to 29 Minutes | 0 (0.0%) | 0 (0.0%) |
| 30 to 34 Minutes | 0 (0.0%) | 0 (0.0%) |
| 35 to 39 Minutes | 0 (0.0%) | 0 (0.0%) |
| 40 to 44 Minutes | 0 (0.0%) | 0 (0.0%) |
| 45 to 59 Minutes | 0 (0.0%) | 0 (0.0%) |
| 60 to 89 Minutes | 0 (0.0%) | 0 (0.0%) |
| 90 or more Minutes | 0 (0.0%) | 0 (0.0%) |
Time of Departure to Work by Sex in Los Panes
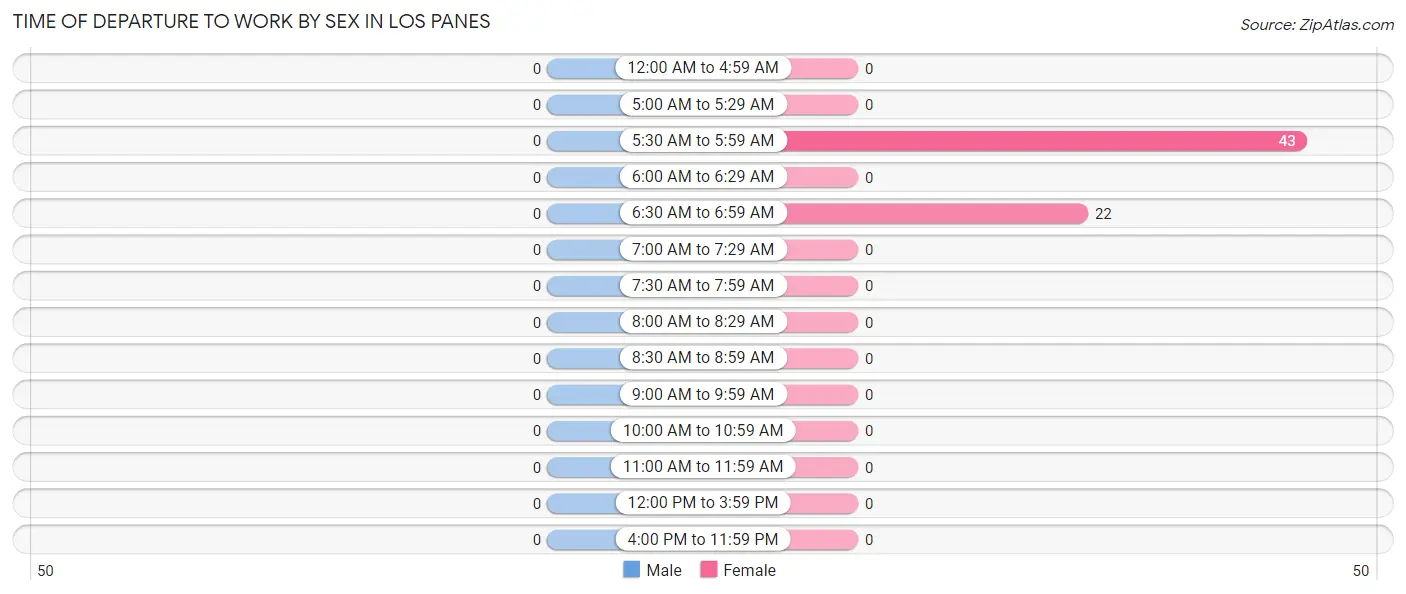
| Time of Departure | Male | Female |
| 12:00 AM to 4:59 AM | 0 (0.0%) | 0 (0.0%) |
| 5:00 AM to 5:29 AM | 0 (0.0%) | 0 (0.0%) |
| 5:30 AM to 5:59 AM | 0 (0.0%) | 43 (66.1%) |
| 6:00 AM to 6:29 AM | 0 (0.0%) | 0 (0.0%) |
| 6:30 AM to 6:59 AM | 0 (0.0%) | 22 (33.9%) |
| 7:00 AM to 7:29 AM | 0 (0.0%) | 0 (0.0%) |
| 7:30 AM to 7:59 AM | 0 (0.0%) | 0 (0.0%) |
| 8:00 AM to 8:29 AM | 0 (0.0%) | 0 (0.0%) |
| 8:30 AM to 8:59 AM | 0 (0.0%) | 0 (0.0%) |
| 9:00 AM to 9:59 AM | 0 (0.0%) | 0 (0.0%) |
| 10:00 AM to 10:59 AM | 0 (0.0%) | 0 (0.0%) |
| 11:00 AM to 11:59 AM | 0 (0.0%) | 0 (0.0%) |
| 12:00 PM to 3:59 PM | 0 (0.0%) | 0 (0.0%) |
| 4:00 PM to 11:59 PM | 0 (0.0%) | 0 (0.0%) |
| Total | 0 (0.0%) | 65 (100.0%) |
Housing Occupancy in Los Panes
Occupancy by Ownership in Los Panes
Of the total 88 dwellings in Los Panes, owner-occupied units account for 88 (100.0%), while renter-occupied units make up 0 (0.0%).
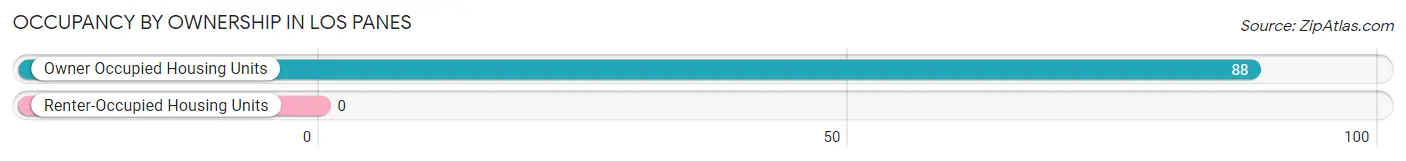
| Occupancy | # Housing Units | % Housing Units |
| Owner Occupied Housing Units | 88 | 100.0% |
| Renter-Occupied Housing Units | 0 | 0.0% |
| Total Occupied Housing Units | 88 | 100.0% |
Occupancy by Household Size in Los Panes
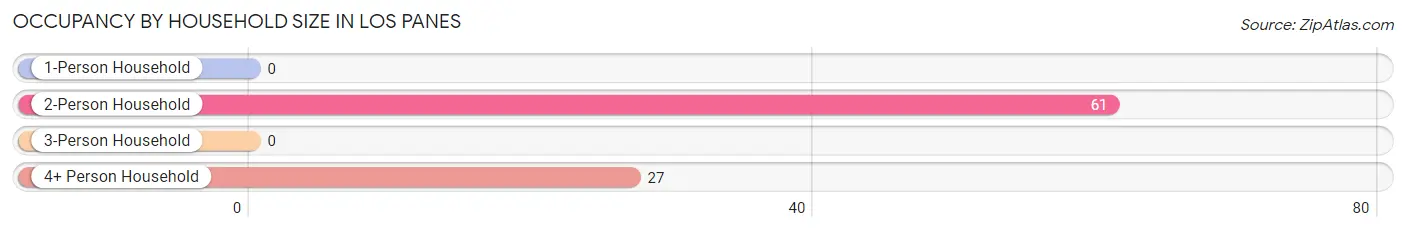
| Household Size | # Housing Units | % Housing Units |
| 1-Person Household | 0 | 0.0% |
| 2-Person Household | 61 | 69.3% |
| 3-Person Household | 0 | 0.0% |
| 4+ Person Household | 27 | 30.7% |
| Total Housing Units | 88 | 100.0% |
Occupancy by Ownership by Household Size in Los Panes
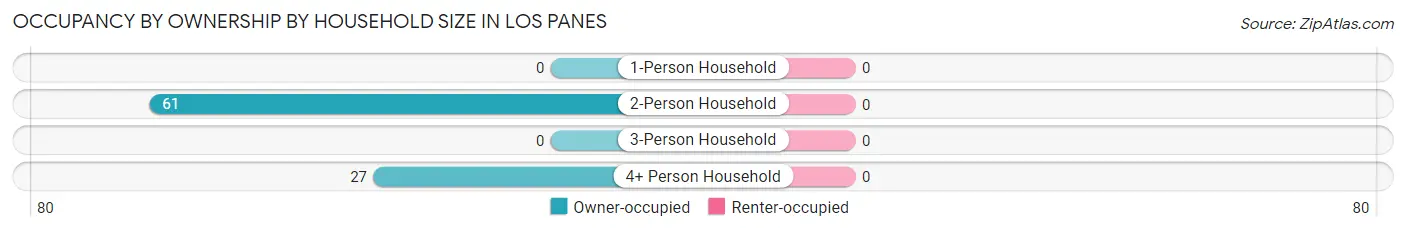
| Household Size | Owner-occupied | Renter-occupied |
| 1-Person Household | 0 (0.0%) | 0 (0.0%) |
| 2-Person Household | 61 (100.0%) | 0 (0.0%) |
| 3-Person Household | 0 (0.0%) | 0 (0.0%) |
| 4+ Person Household | 27 (100.0%) | 0 (0.0%) |
| Total Housing Units | 88 (100.0%) | 0 (0.0%) |
Occupancy by Educational Attainment in Los Panes
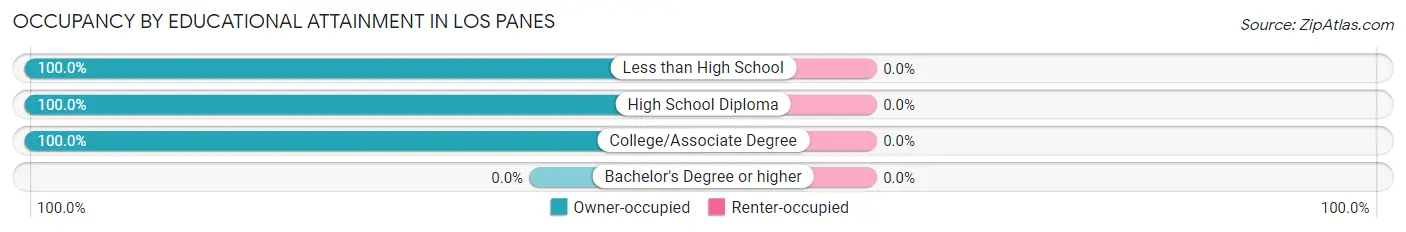
| Household Size | Owner-occupied | Renter-occupied |
| Less than High School | 27 (100.0%) | 0 (0.0%) |
| High School Diploma | 24 (100.0%) | 0 (0.0%) |
| College/Associate Degree | 37 (100.0%) | 0 (0.0%) |
| Bachelor's Degree or higher | 0 (0.0%) | 0 (0.0%) |
Occupancy by Age of Householder in Los Panes
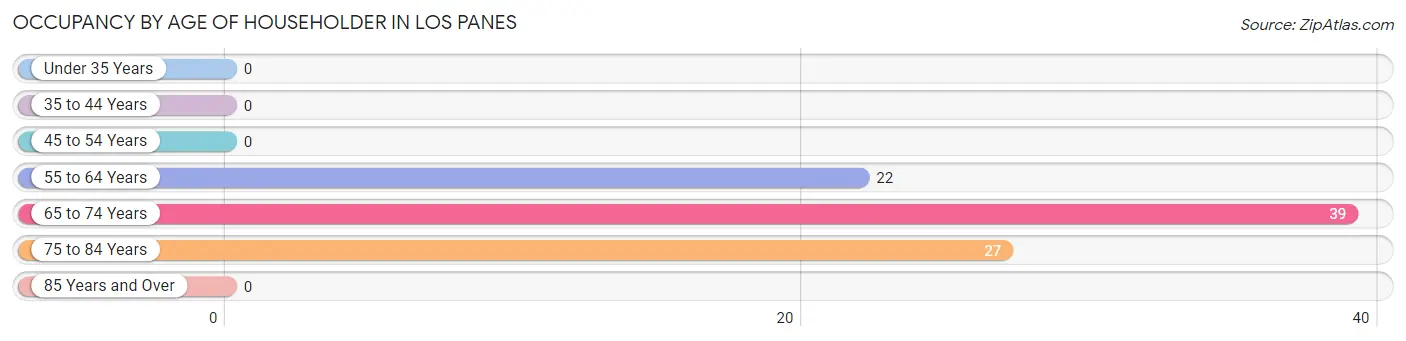
| Age Bracket | # Households | % Households |
| Under 35 Years | 0 | 0.0% |
| 35 to 44 Years | 0 | 0.0% |
| 45 to 54 Years | 0 | 0.0% |
| 55 to 64 Years | 22 | 25.0% |
| 65 to 74 Years | 39 | 44.3% |
| 75 to 84 Years | 27 | 30.7% |
| 85 Years and Over | 0 | 0.0% |
| Total | 88 | 100.0% |
Housing Finances in Los Panes
Median Income by Occupancy in Los Panes
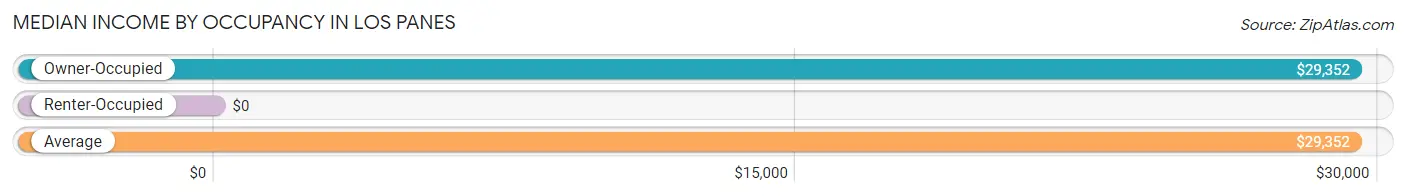
| Occupancy Type | # Households | Median Income |
| Owner-Occupied | 88 (100.0%) | $29,352 |
| Renter-Occupied | 0 (0.0%) | $0 |
| Average | 88 (100.0%) | $29,352 |
Occupancy by Householder Income Bracket in Los Panes
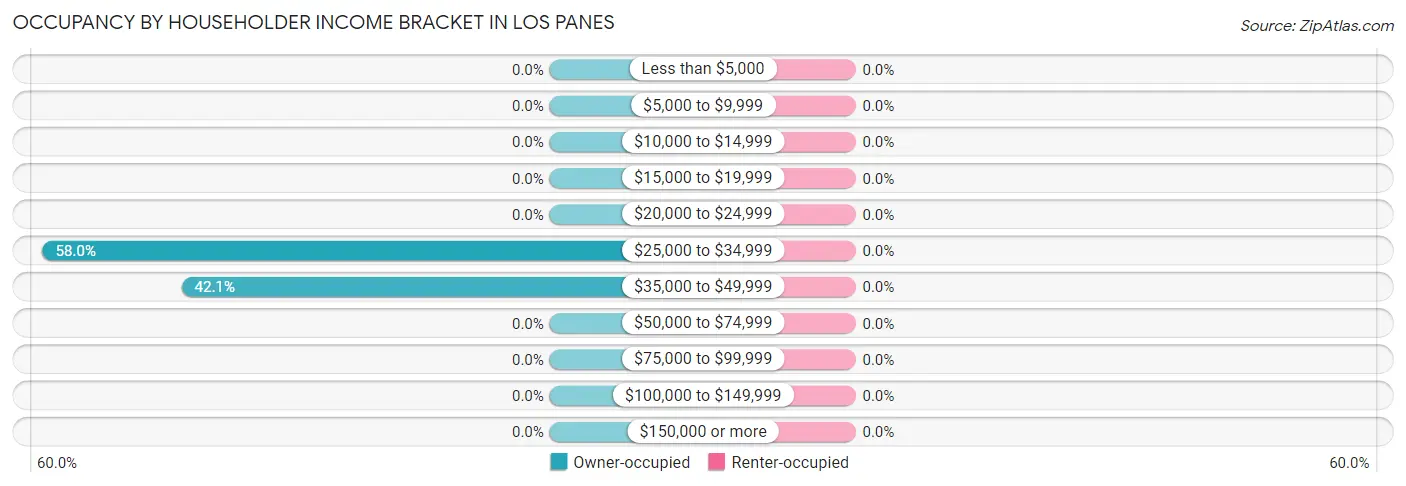
| Income Bracket | Owner-occupied | Renter-occupied |
| Less than $5,000 | 0 (0.0%) | 0 (0.0%) |
| $5,000 to $9,999 | 0 (0.0%) | 0 (0.0%) |
| $10,000 to $14,999 | 0 (0.0%) | 0 (0.0%) |
| $15,000 to $19,999 | 0 (0.0%) | 0 (0.0%) |
| $20,000 to $24,999 | 0 (0.0%) | 0 (0.0%) |
| $25,000 to $34,999 | 51 (58.0%) | 0 (0.0%) |
| $35,000 to $49,999 | 37 (42.0%) | 0 (0.0%) |
| $50,000 to $74,999 | 0 (0.0%) | 0 (0.0%) |
| $75,000 to $99,999 | 0 (0.0%) | 0 (0.0%) |
| $100,000 to $149,999 | 0 (0.0%) | 0 (0.0%) |
| $150,000 or more | 0 (0.0%) | 0 (0.0%) |
| Total | 88 (100.0%) | 0 (0.0%) |
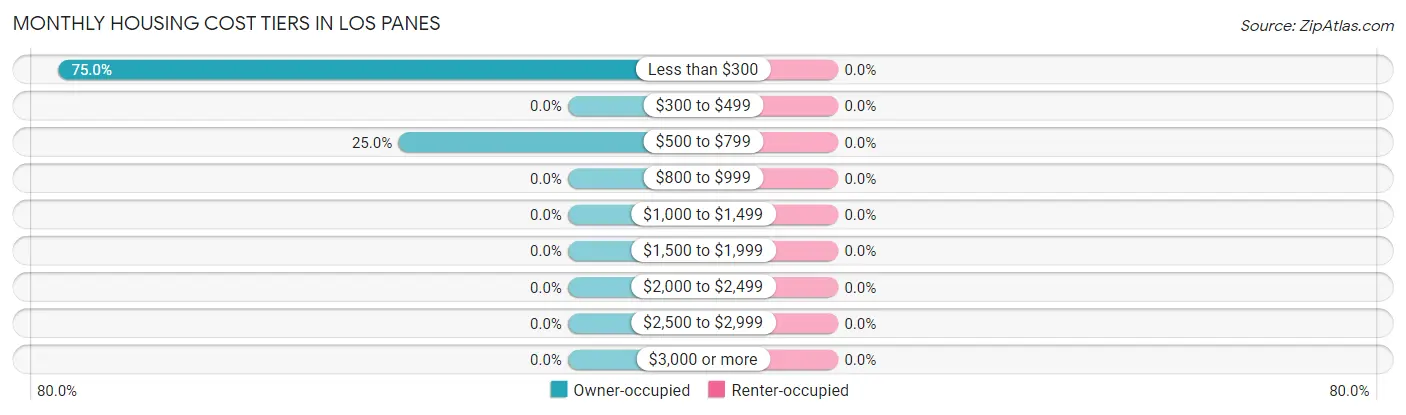
Monthly Housing Cost Tiers in Los Panes
| Monthly Cost | Owner-occupied | Renter-occupied |
| Less than $300 | 66 (75.0%) | 0 (0.0%) |
| $300 to $499 | 0 (0.0%) | 0 (0.0%) |
| $500 to $799 | 22 (25.0%) | 0 (0.0%) |
| $800 to $999 | 0 (0.0%) | 0 (0.0%) |
| $1,000 to $1,499 | 0 (0.0%) | 0 (0.0%) |
| $1,500 to $1,999 | 0 (0.0%) | 0 (0.0%) |
| $2,000 to $2,499 | 0 (0.0%) | 0 (0.0%) |
| $2,500 to $2,999 | 0 (0.0%) | 0 (0.0%) |
| $3,000 or more | 0 (0.0%) | 0 (0.0%) |
| Total | 88 (100.0%) | 0 (0.0%) |
Physical Housing Characteristics in Los Panes
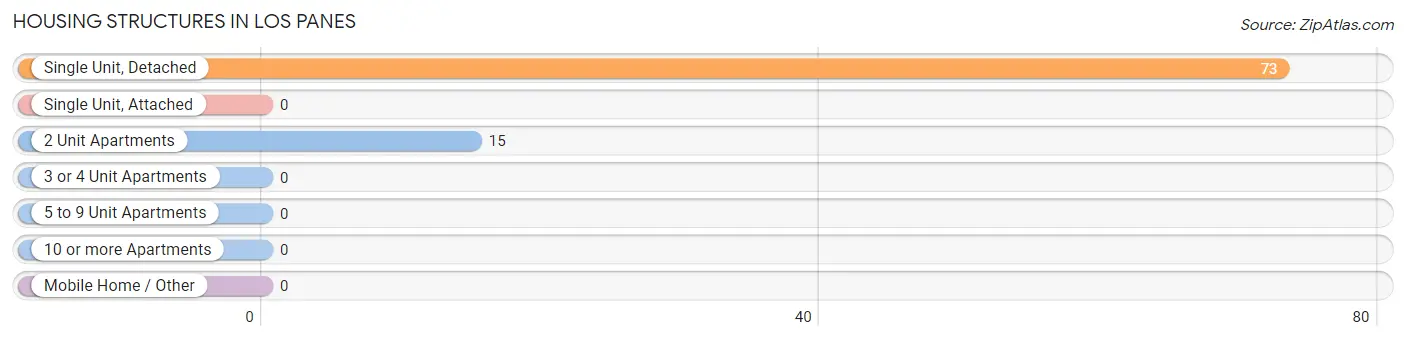
Housing Structures in Los Panes
| Structure Type | # Housing Units | % Housing Units |
| Single Unit, Detached | 73 | 83.0% |
| Single Unit, Attached | 0 | 0.0% |
| 2 Unit Apartments | 15 | 17.1% |
| 3 or 4 Unit Apartments | 0 | 0.0% |
| 5 to 9 Unit Apartments | 0 | 0.0% |
| 10 or more Apartments | 0 | 0.0% |
| Mobile Home / Other | 0 | 0.0% |
| Total | 88 | 100.0% |
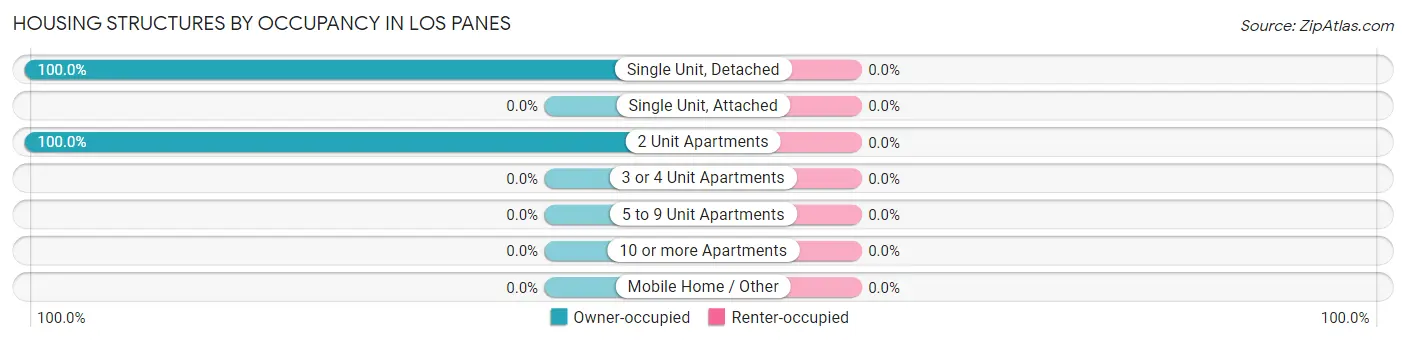
Housing Structures by Occupancy in Los Panes
| Structure Type | Owner-occupied | Renter-occupied |
| Single Unit, Detached | 73 (100.0%) | 0 (0.0%) |
| Single Unit, Attached | 0 (0.0%) | 0 (0.0%) |
| 2 Unit Apartments | 15 (100.0%) | 0 (0.0%) |
| 3 or 4 Unit Apartments | 0 (0.0%) | 0 (0.0%) |
| 5 to 9 Unit Apartments | 0 (0.0%) | 0 (0.0%) |
| 10 or more Apartments | 0 (0.0%) | 0 (0.0%) |
| Mobile Home / Other | 0 (0.0%) | 0 (0.0%) |
| Total | 88 (100.0%) | 0 (0.0%) |
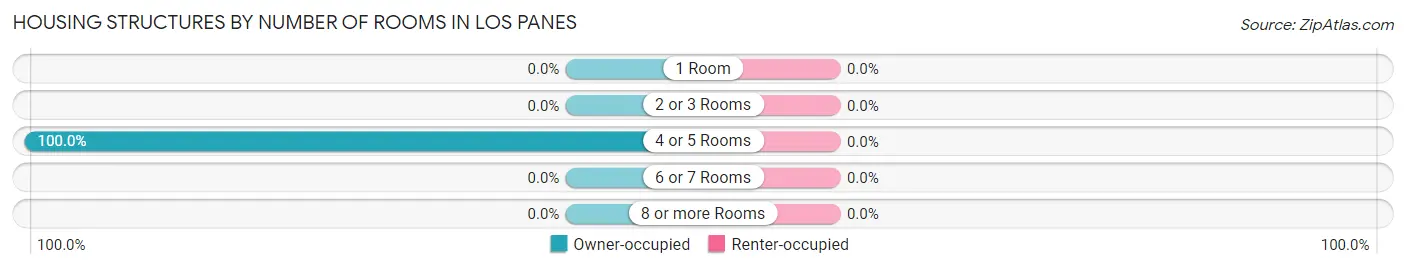
Housing Structures by Number of Rooms in Los Panes
| Number of Rooms | Owner-occupied | Renter-occupied |
| 1 Room | 0 (0.0%) | 0 (0.0%) |
| 2 or 3 Rooms | 0 (0.0%) | 0 (0.0%) |
| 4 or 5 Rooms | 88 (100.0%) | 0 (0.0%) |
| 6 or 7 Rooms | 0 (0.0%) | 0 (0.0%) |
| 8 or more Rooms | 0 (0.0%) | 0 (0.0%) |
| Total | 88 (100.0%) | 0 (0.0%) |
Housing Structure by Heating Type in Los Panes
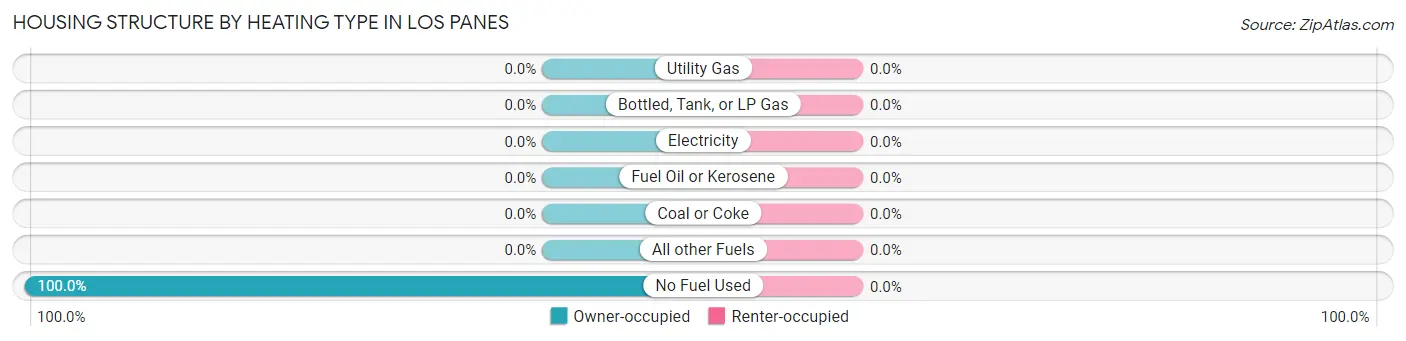
| Heating Type | Owner-occupied | Renter-occupied |
| Utility Gas | 0 (0.0%) | 0 (0.0%) |
| Bottled, Tank, or LP Gas | 0 (0.0%) | 0 (0.0%) |
| Electricity | 0 (0.0%) | 0 (0.0%) |
| Fuel Oil or Kerosene | 0 (0.0%) | 0 (0.0%) |
| Coal or Coke | 0 (0.0%) | 0 (0.0%) |
| All other Fuels | 0 (0.0%) | 0 (0.0%) |
| No Fuel Used | 88 (100.0%) | 0 (0.0%) |
| Total | 88 (100.0%) | 0 (0.0%) |
Household Vehicle Usage in Los Panes
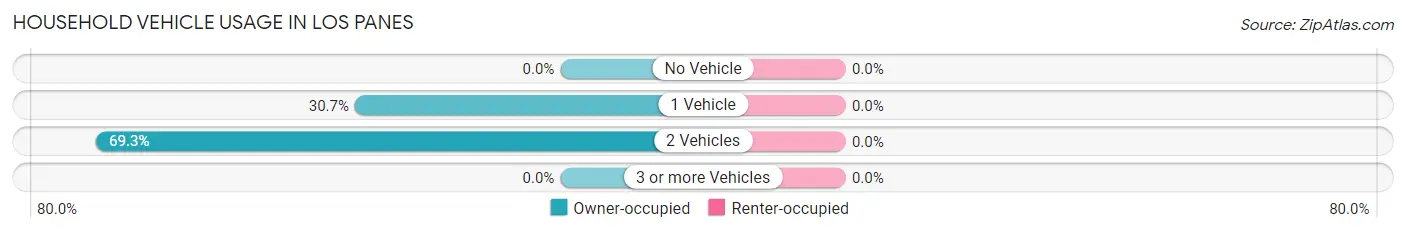
| Vehicles per Household | Owner-occupied | Renter-occupied |
| No Vehicle | 0 (0.0%) | 0 (0.0%) |
| 1 Vehicle | 27 (30.7%) | 0 (0.0%) |
| 2 Vehicles | 61 (69.3%) | 0 (0.0%) |
| 3 or more Vehicles | 0 (0.0%) | 0 (0.0%) |
| Total | 88 (100.0%) | 0 (0.0%) |
Real Estate & Mortgages in Los Panes
Real Estate and Mortgage Overview in Los Panes
| Characteristic | Without Mortgage | With Mortgage |
| Housing Units | 66 | 22 |
| Median Property Value | - | - |
| Median Household Income | $28,333 | $0 |
| Monthly Housing Costs | $238 | $0 |
| Real Estate Taxes | - | - |
Property Value by Mortgage Status in Los Panes
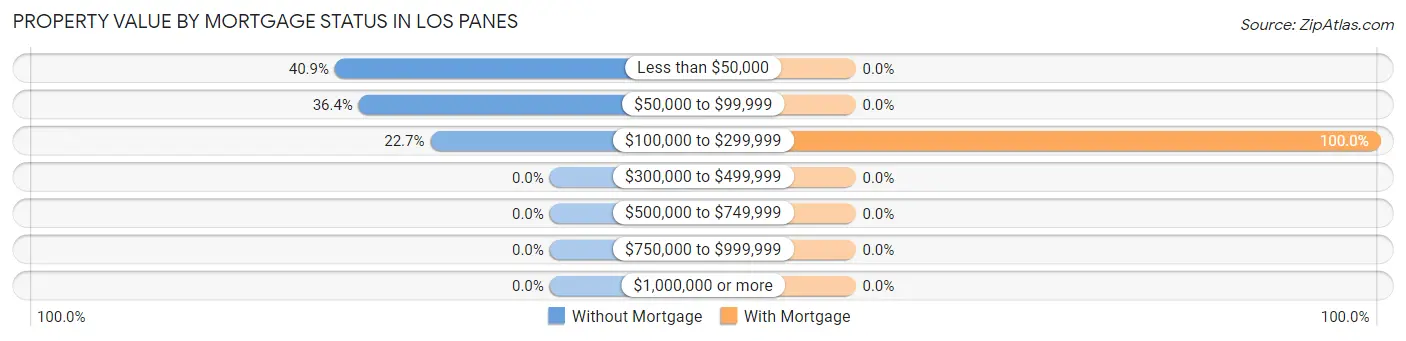
| Property Value | Without Mortgage | With Mortgage |
| Less than $50,000 | 27 (40.9%) | 0 (0.0%) |
| $50,000 to $99,999 | 24 (36.4%) | 0 (0.0%) |
| $100,000 to $299,999 | 15 (22.7%) | 22 (100.0%) |
| $300,000 to $499,999 | 0 (0.0%) | 0 (0.0%) |
| $500,000 to $749,999 | 0 (0.0%) | 0 (0.0%) |
| $750,000 to $999,999 | 0 (0.0%) | 0 (0.0%) |
| $1,000,000 or more | 0 (0.0%) | 0 (0.0%) |
| Total | 66 (100.0%) | 22 (100.0%) |
Household Income by Mortgage Status in Los Panes
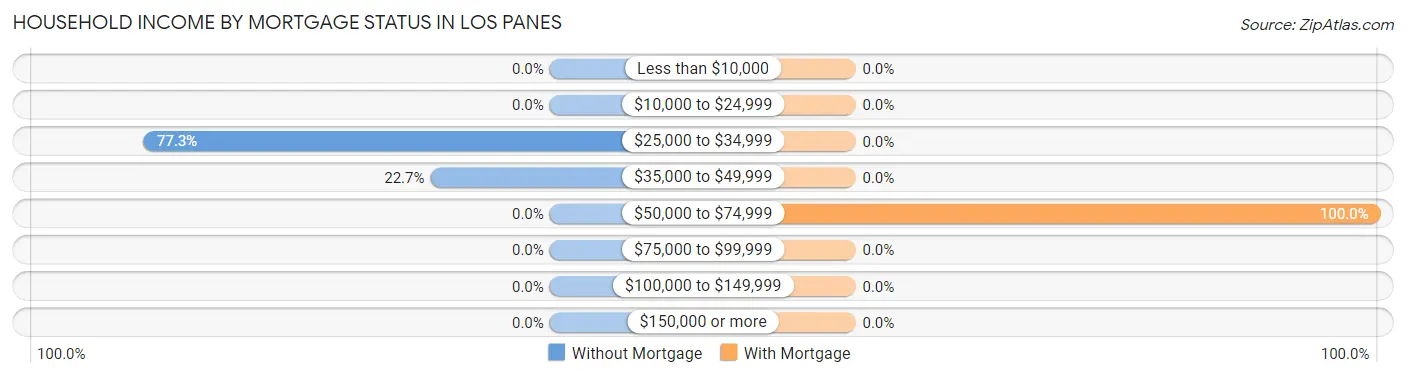
| Household Income | Without Mortgage | With Mortgage |
| Less than $10,000 | 0 (0.0%) | 0 (0.0%) |
| $10,000 to $24,999 | 0 (0.0%) | 0 (0.0%) |
| $25,000 to $34,999 | 51 (77.3%) | 0 (0.0%) |
| $35,000 to $49,999 | 15 (22.7%) | 0 (0.0%) |
| $50,000 to $74,999 | 0 (0.0%) | 22 (100.0%) |
| $75,000 to $99,999 | 0 (0.0%) | 0 (0.0%) |
| $100,000 to $149,999 | 0 (0.0%) | 0 (0.0%) |
| $150,000 or more | 0 (0.0%) | 0 (0.0%) |
| Total | 66 (100.0%) | 22 (100.0%) |
Property Value to Household Income Ratio in Los Panes
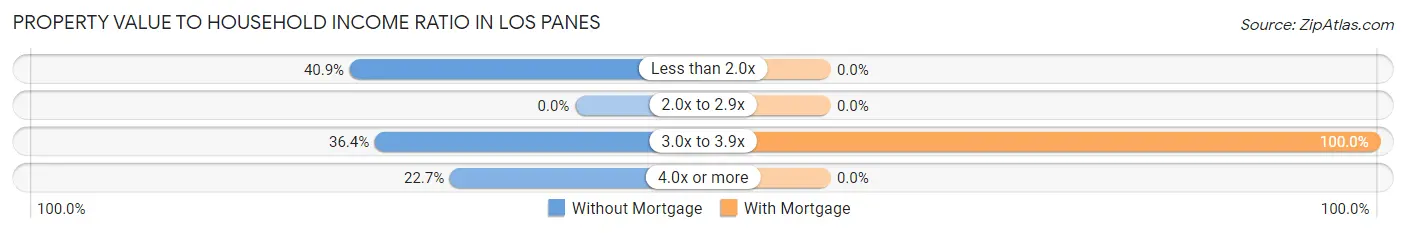
| Value-to-Income Ratio | Without Mortgage | With Mortgage |
| Less than 2.0x | 27 (40.9%) | 0 (0.0%) |
| 2.0x to 2.9x | 0 (0.0%) | 0 (0.0%) |
| 3.0x to 3.9x | 24 (36.4%) | 22 (100.0%) |
| 4.0x or more | 15 (22.7%) | 0 (0.0%) |
| Total | 66 (100.0%) | 22 (100.0%) |
Real Estate Taxes by Mortgage Status in Los Panes
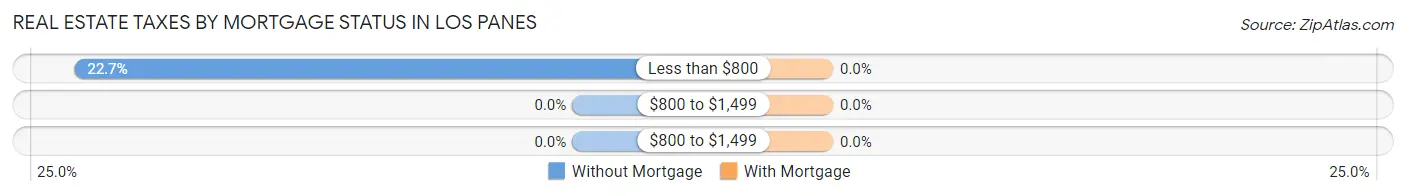
| Property Taxes | Without Mortgage | With Mortgage |
| Less than $800 | 15 (22.7%) | 0 (0.0%) |
| $800 to $1,499 | 0 (0.0%) | 0 (0.0%) |
| $800 to $1,499 | 0 (0.0%) | 0 (0.0%) |
| Total | 66 (100.0%) | 22 (100.0%) |
Health & Disability in Los Panes
Health Insurance Coverage by Age in Los Panes

| Age Bracket | With Coverage | Without Coverage |
| Under 6 Years | 0 (0.0%) | 0 (0.0%) |
| 6 to 18 Years | 42 (100.0%) | 0 (0.0%) |
| 19 to 25 Years | 33 (100.0%) | 0 (0.0%) |
| 26 to 34 Years | 0 (0.0%) | 0 (0.0%) |
| 35 to 44 Years | 0 (0.0%) | 0 (0.0%) |
| 45 to 54 Years | 43 (100.0%) | 0 (0.0%) |
| 55 to 64 Years | 67 (100.0%) | 0 (0.0%) |
| 65 to 74 Years | 54 (100.0%) | 0 (0.0%) |
| 75 Years and older | 27 (100.0%) | 0 (0.0%) |
| Total | 266 (100.0%) | 0 (0.0%) |
Health Insurance Coverage by Citizenship Status in Los Panes
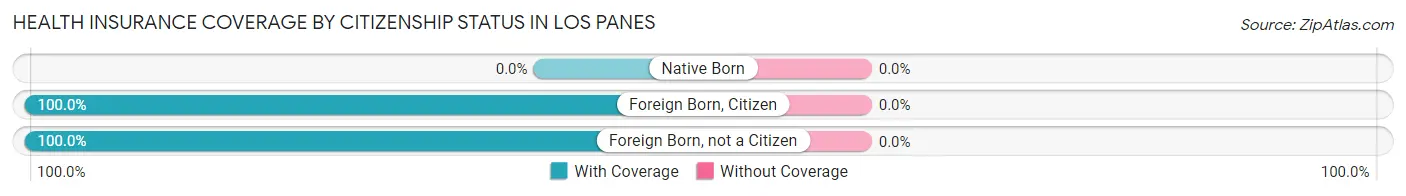
| Citizenship Status | With Coverage | Without Coverage |
| Native Born | 0 (0.0%) | 0 (0.0%) |
| Foreign Born, Citizen | 42 (100.0%) | 0 (0.0%) |
| Foreign Born, not a Citizen | 33 (100.0%) | 0 (0.0%) |
Health Insurance Coverage by Household Income in Los Panes
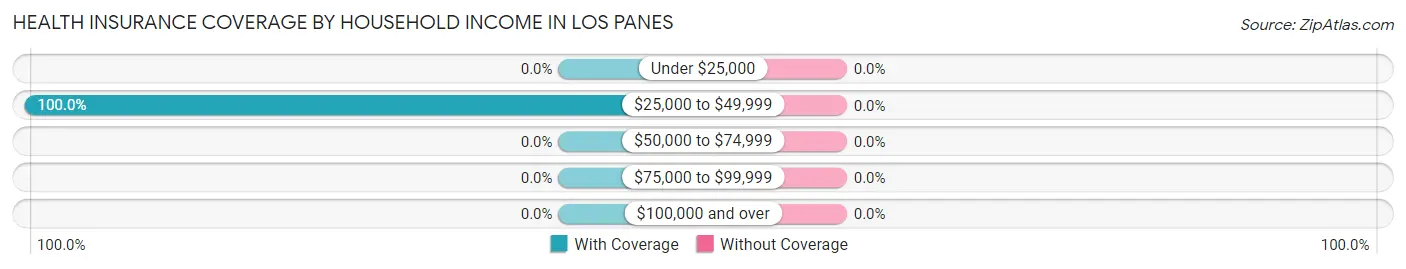
| Household Income | With Coverage | Without Coverage |
| Under $25,000 | 0 (0.0%) | 0 (0.0%) |
| $25,000 to $49,999 | 266 (100.0%) | 0 (0.0%) |
| $50,000 to $74,999 | 0 (0.0%) | 0 (0.0%) |
| $75,000 to $99,999 | 0 (0.0%) | 0 (0.0%) |
| $100,000 and over | 0 (0.0%) | 0 (0.0%) |
Public vs Private Health Insurance Coverage by Age in Los Panes
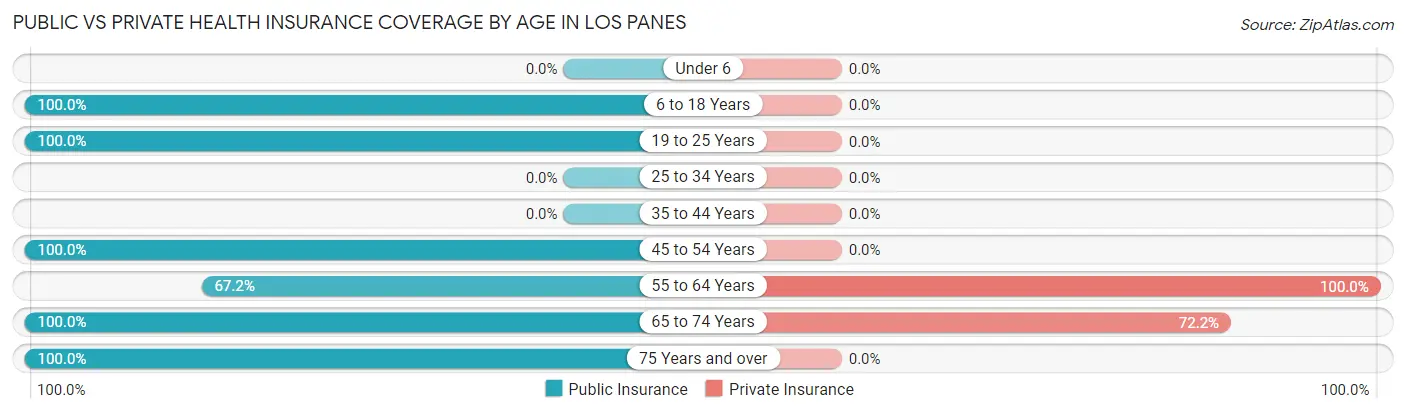
| Age Bracket | Public Insurance | Private Insurance |
| Under 6 | 0 (0.0%) | 0 (0.0%) |
| 6 to 18 Years | 42 (100.0%) | 0 (0.0%) |
| 19 to 25 Years | 33 (100.0%) | 0 (0.0%) |
| 25 to 34 Years | 0 (0.0%) | 0 (0.0%) |
| 35 to 44 Years | 0 (0.0%) | 0 (0.0%) |
| 45 to 54 Years | 43 (100.0%) | 0 (0.0%) |
| 55 to 64 Years | 45 (67.2%) | 67 (100.0%) |
| 65 to 74 Years | 54 (100.0%) | 39 (72.2%) |
| 75 Years and over | 27 (100.0%) | 0 (0.0%) |
| Total | 244 (91.7%) | 106 (39.9%) |
Disability Status by Sex by Age in Los Panes
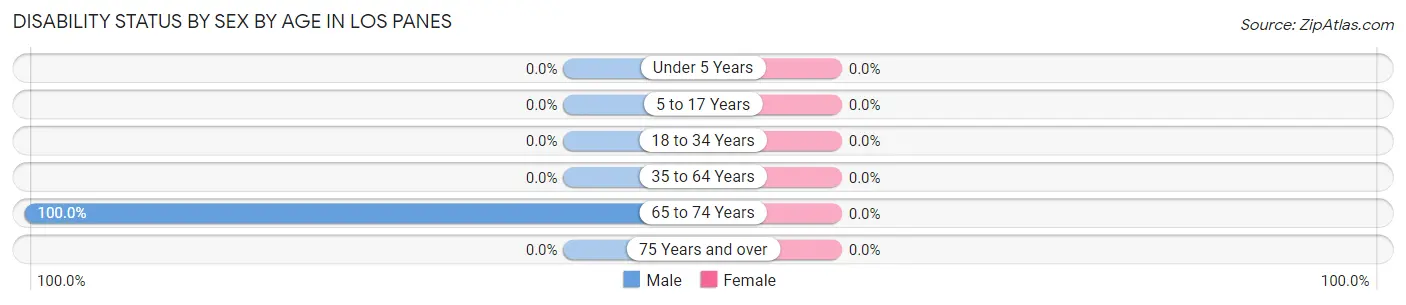
| Age Bracket | Male | Female |
| Under 5 Years | 0 (0.0%) | 0 (0.0%) |
| 5 to 17 Years | 0 (0.0%) | 0 (0.0%) |
| 18 to 34 Years | 0 (0.0%) | 0 (0.0%) |
| 35 to 64 Years | 0 (0.0%) | 0 (0.0%) |
| 65 to 74 Years | 15 (100.0%) | 0 (0.0%) |
| 75 Years and over | 0 (0.0%) | 0 (0.0%) |
Disability Class by Sex by Age in Los Panes
Disability Class: Hearing Difficulty
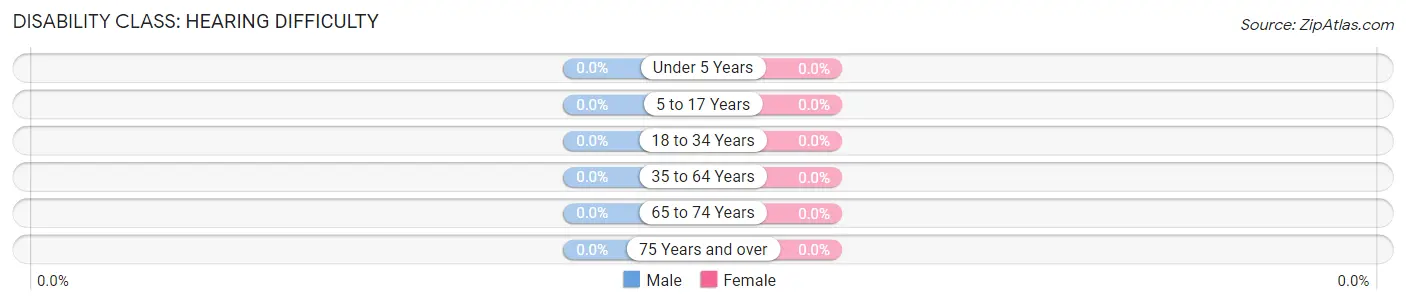
| Age Bracket | Male | Female |
| Under 5 Years | 0 (0.0%) | 0 (0.0%) |
| 5 to 17 Years | 0 (0.0%) | 0 (0.0%) |
| 18 to 34 Years | 0 (0.0%) | 0 (0.0%) |
| 35 to 64 Years | 0 (0.0%) | 0 (0.0%) |
| 65 to 74 Years | 0 (0.0%) | 0 (0.0%) |
| 75 Years and over | 0 (0.0%) | 0 (0.0%) |
Disability Class: Vision Difficulty
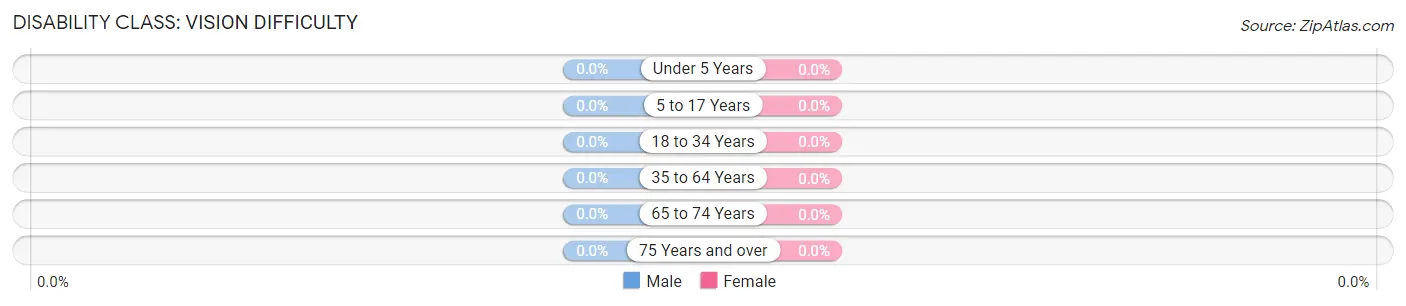
| Age Bracket | Male | Female |
| Under 5 Years | 0 (0.0%) | 0 (0.0%) |
| 5 to 17 Years | 0 (0.0%) | 0 (0.0%) |
| 18 to 34 Years | 0 (0.0%) | 0 (0.0%) |
| 35 to 64 Years | 0 (0.0%) | 0 (0.0%) |
| 65 to 74 Years | 0 (0.0%) | 0 (0.0%) |
| 75 Years and over | 0 (0.0%) | 0 (0.0%) |
Disability Class: Cognitive Difficulty
| Age Bracket | Male | Female |
| 5 to 17 Years | 0 (0.0%) | 0 (0.0%) |
| 18 to 34 Years | 0 (0.0%) | 0 (0.0%) |
| 35 to 64 Years | 0 (0.0%) | 0 (0.0%) |
| 65 to 74 Years | 0 (0.0%) | 0 (0.0%) |
| 75 Years and over | 0 (0.0%) | 0 (0.0%) |
Disability Class: Ambulatory Difficulty
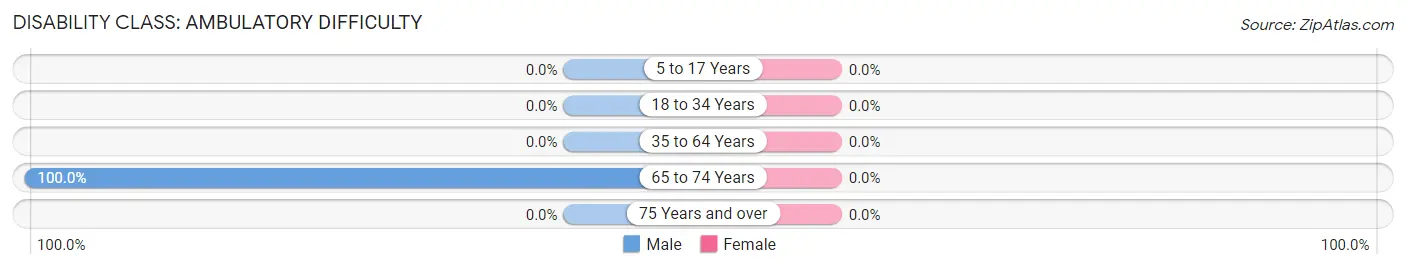
| Age Bracket | Male | Female |
| 5 to 17 Years | 0 (0.0%) | 0 (0.0%) |
| 18 to 34 Years | 0 (0.0%) | 0 (0.0%) |
| 35 to 64 Years | 0 (0.0%) | 0 (0.0%) |
| 65 to 74 Years | 15 (100.0%) | 0 (0.0%) |
| 75 Years and over | 0 (0.0%) | 0 (0.0%) |
Disability Class: Self-Care Difficulty
| Age Bracket | Male | Female |
| 5 to 17 Years | 0 (0.0%) | 0 (0.0%) |
| 18 to 34 Years | 0 (0.0%) | 0 (0.0%) |
| 35 to 64 Years | 0 (0.0%) | 0 (0.0%) |
| 65 to 74 Years | 0 (0.0%) | 0 (0.0%) |
| 75 Years and over | 0 (0.0%) | 0 (0.0%) |
Technology Access in Los Panes
Computing Device Access in Los Panes
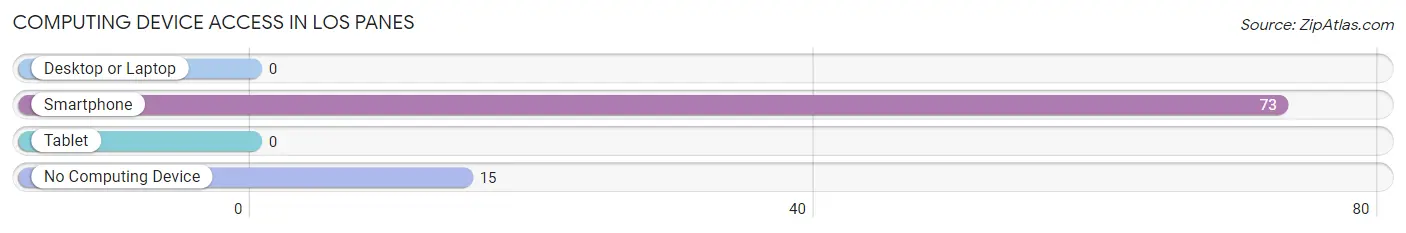
| Device Type | # Households | % Households |
| Desktop or Laptop | 0 | 0.0% |
| Smartphone | 73 | 83.0% |
| Tablet | 0 | 0.0% |
| No Computing Device | 15 | 17.1% |
| Total | 88 | 100.0% |
Internet Access in Los Panes

| Internet Type | # Households | % Households |
| Dial-Up Internet | 0 | 0.0% |
| Broadband Home | 0 | 0.0% |
| Cellular Data Only | 73 | 83.0% |
| Satellite Internet | 0 | 0.0% |
| No Internet | 15 | 17.1% |
| Total | 88 | 100.0% |
Los Panes Summary
Panes, Puerto Rico is a small municipality located in the northern region of the island of Puerto Rico. It is part of the San Juan-Caguas-Guaynabo Metropolitan Statistical Area. The population of Panes was 5,845 as of the 2010 census.
Geography
Panes is located in the northern region of Puerto Rico, in the municipality of San Juan. It is bordered by the municipalities of San Juan, Toa Baja, Bayamón, and Cataño. The terrain of Panes is mostly flat, with some hills in the northern part of the municipality. The highest point in Panes is Cerro de Panes, which is located in the northern part of the municipality and has an elevation of 1,039 feet (316 meters). The climate of Panes is tropical, with temperatures ranging from the mid-70s to the mid-80s Fahrenheit (21-30 Celsius).
History
Panes was founded in 1815 by Don Juan de Panes, a Spanish soldier who was granted the land by the Spanish Crown. The area was originally known as Hato de Panes, and was used for cattle ranching. In 1825, the area was officially recognized as a municipality by the Spanish government.
In 1898, Panes became part of the United States after the Spanish-American War. During the early 20th century, Panes experienced a period of economic growth, as the area became a center for sugar cane production. In the 1950s, the economy of Panes shifted to manufacturing, as several factories were established in the area.
Economy
The economy of Panes is largely based on manufacturing and agriculture. The main agricultural products produced in Panes are sugar cane, coffee, and bananas. The manufacturing sector is dominated by the production of electronics, pharmaceuticals, and food products.
Demographics
As of the 2010 census, the population of Panes was 5,845. The racial makeup of the population was 79.3% White, 15.2% Black, 0.3% Native American, 0.2% Asian, and 4.9% other. The median household income in Panes was $17,845, and the median age was 37.7 years.
Conclusion
Panes, Puerto Rico is a small municipality located in the northern region of the island of Puerto Rico. It is part of the San Juan-Caguas-Guaynabo Metropolitan Statistical Area. The population of Panes was 5,845 as of the 2010 census. The economy of Panes is largely based on manufacturing and agriculture, and the main agricultural products produced in Panes are sugar cane, coffee, and bananas. The racial makeup of the population was 79.3% White, 15.2% Black, 0.3% Native American, 0.2% Asian, and 4.9% other. The median household income in Panes was $17,845, and the median age was 37.7 years.
Common Questions
What is Per Capita Income in Los Panes?
Per Capita income in Los Panes is $11,549.
What is the Median Family Income in Los Panes?
Median Family Income in Los Panes is $38,068.
What is the Median Household income in Los Panes?
Median Household Income in Los Panes is $29,352.
What is Inequality or Gini Index in Los Panes?
Inequality or Gini Index in Los Panes is 0.10.
What is the Total Population of Los Panes?
Total Population of Los Panes is 266.
What is the Total Male Population of Los Panes?
Total Male Population of Los Panes is 102.
What is the Total Female Population of Los Panes?
Total Female Population of Los Panes is 164.
What is the Ratio of Males per 100 Females in Los Panes?
There are 62.20 Males per 100 Females in Los Panes.
What is the Ratio of Females per 100 Males in Los Panes?
There are 160.78 Females per 100 Males in Los Panes.
What is the Median Population Age in Los Panes?
Median Population Age in Los Panes is 61.7 Years.
What is the Average Family Size in Los Panes
Average Family Size in Los Panes is 3.4 People.
What is the Average Household Size in Los Panes
Average Household Size in Los Panes is 3.0 People.
How Large is the Labor Force in Los Panes?
There are 80 People in the Labor Forcein in Los Panes.
What is the Percentage of People in the Labor Force in Los Panes?
30.1% of People are in the Labor Force in Los Panes.