G L Garcia, PR Map & Demographics
G L Garcia Overview
$16,907
PER CAPITA INCOME
$30,123
AVG FAMILY INCOME
$21,208
AVG HOUSEHOLD INCOME
0.52
INEQUALITY / GINI INDEX
1,312
TOTAL POPULATION
538
MALE POPULATION
774
FEMALE POPULATION
69.51
MALES / 100 FEMALES
143.87
FEMALES / 100 MALES
54.9
MEDIAN AGE
3.0
AVG FAMILY SIZE
2.5
AVG HOUSEHOLD SIZE
214
LABOR FORCE [ PEOPLE ]
19.2%
PERCENT IN LABOR FORCE
Income in G L Garcia
Income Overview in G L Garcia
Per Capita Income in G L Garcia is $16,907, while median incomes of families and households are $30,123 and $21,208 respectively.
| Characteristic | Number | Measure |
| Per Capita Income | 1,312 | $16,907 |
| Median Family Income | 298 | $30,123 |
| Mean Family Income | 298 | $24,686 |
| Median Household Income | 523 | $21,208 |
| Mean Household Income | 523 | $31,831 |
| Income Deficit | 298 | $0 |
| Wage / Income Gap (%) | 1,312 | 0.00% |
| Wage / Income Gap ($) | 1,312 | 100.00¢ per $1 |
| Gini / Inequality Index | 1,312 | 0.52 |
Earnings by Sex in G L Garcia
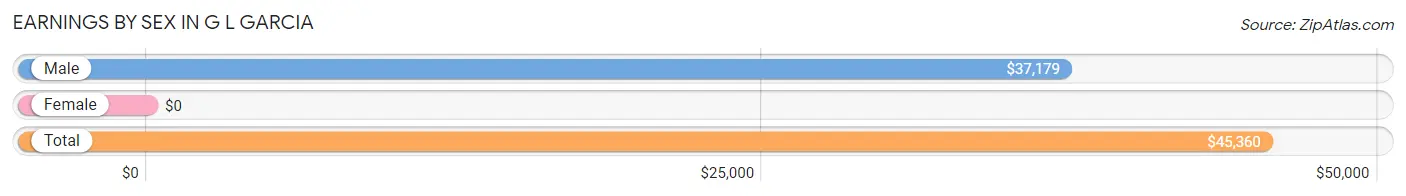
| Sex | Number | Average Earnings |
| Male | 127 (38.8%) | $37,179 |
| Female | 200 (61.2%) | $0 |
| Total | 327 (100.0%) | $45,360 |
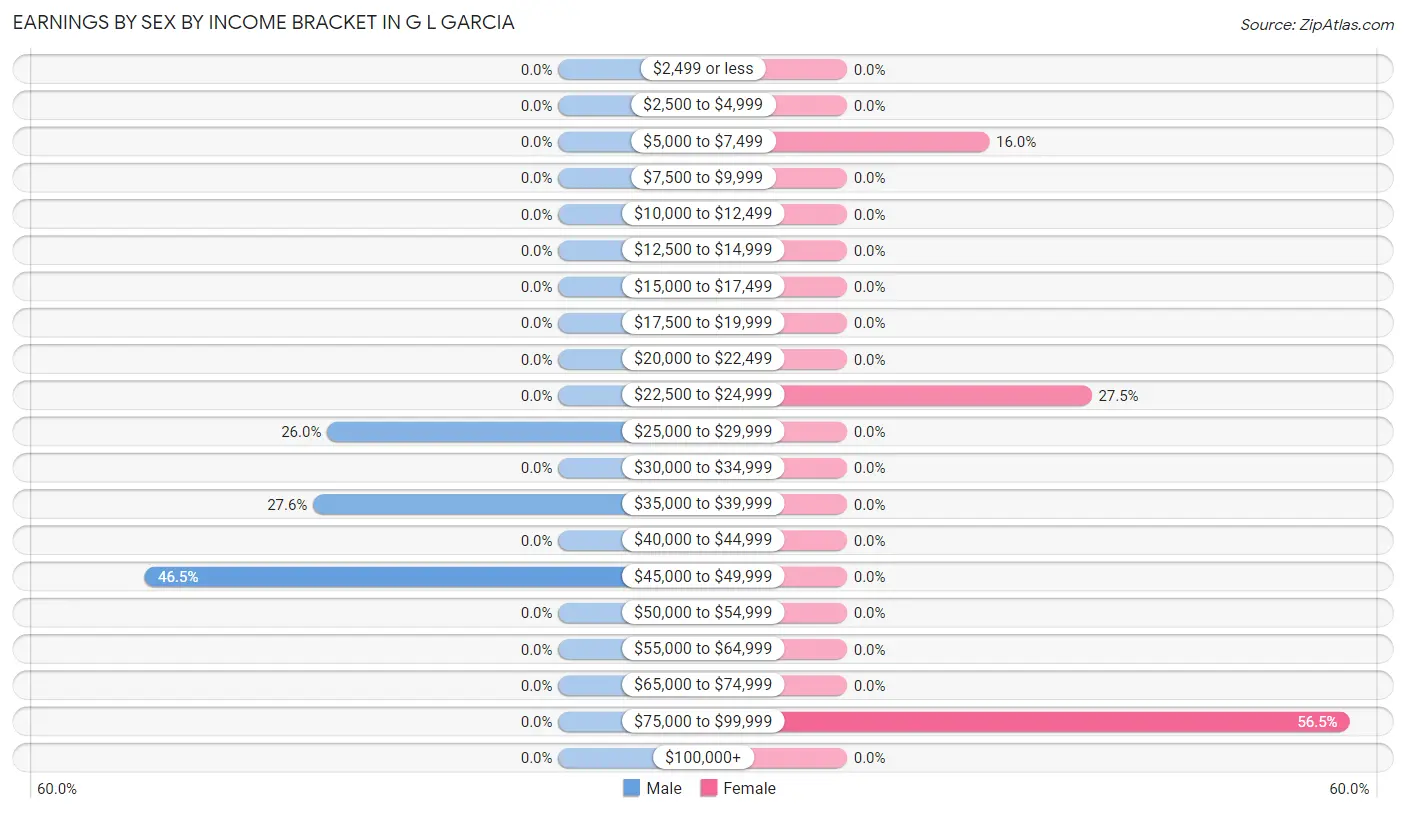
Earnings by Sex by Income Bracket in G L Garcia
The most common earnings brackets in G L Garcia are $45,000 to $49,999 for men (59 | 46.5%) and $75,000 to $99,999 for women (113 | 56.5%).
| Income | Male | Female |
| $2,499 or less | 0 (0.0%) | 0 (0.0%) |
| $2,500 to $4,999 | 0 (0.0%) | 0 (0.0%) |
| $5,000 to $7,499 | 0 (0.0%) | 32 (16.0%) |
| $7,500 to $9,999 | 0 (0.0%) | 0 (0.0%) |
| $10,000 to $12,499 | 0 (0.0%) | 0 (0.0%) |
| $12,500 to $14,999 | 0 (0.0%) | 0 (0.0%) |
| $15,000 to $17,499 | 0 (0.0%) | 0 (0.0%) |
| $17,500 to $19,999 | 0 (0.0%) | 0 (0.0%) |
| $20,000 to $22,499 | 0 (0.0%) | 0 (0.0%) |
| $22,500 to $24,999 | 0 (0.0%) | 55 (27.5%) |
| $25,000 to $29,999 | 33 (26.0%) | 0 (0.0%) |
| $30,000 to $34,999 | 0 (0.0%) | 0 (0.0%) |
| $35,000 to $39,999 | 35 (27.6%) | 0 (0.0%) |
| $40,000 to $44,999 | 0 (0.0%) | 0 (0.0%) |
| $45,000 to $49,999 | 59 (46.5%) | 0 (0.0%) |
| $50,000 to $54,999 | 0 (0.0%) | 0 (0.0%) |
| $55,000 to $64,999 | 0 (0.0%) | 0 (0.0%) |
| $65,000 to $74,999 | 0 (0.0%) | 0 (0.0%) |
| $75,000 to $99,999 | 0 (0.0%) | 113 (56.5%) |
| $100,000+ | 0 (0.0%) | 0 (0.0%) |
| Total | 127 (100.0%) | 200 (100.0%) |
Earnings by Sex by Educational Attainment in G L Garcia
| Educational Attainment | Male Income | Female Income |
| Less than High School | - | - |
| High School Diploma | - | - |
| College or Associate's Degree | - | - |
| Bachelor's Degree | - | - |
| Graduate Degree | - | - |
| Total | $37,179 | $0 |
Family Income in G L Garcia
Family Income Brackets in G L Garcia
According to the G L Garcia family income data, there are 115 families falling into the $25,000 to $34,999 income range, which is the most common income bracket and makes up 38.6% of all families.
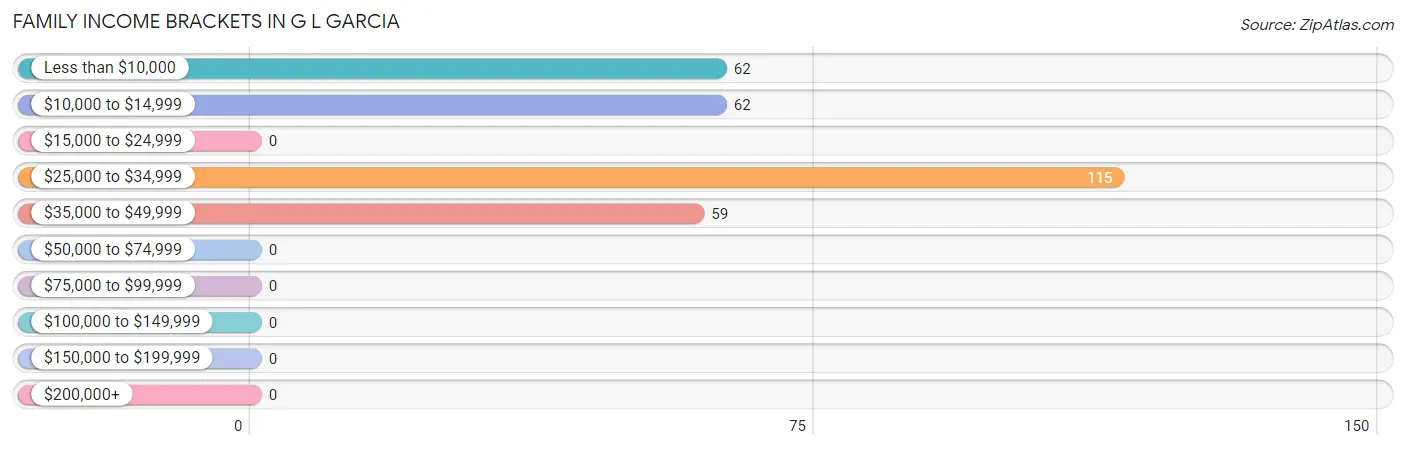
| Income Bracket | # Families | % Families |
| Less than $10,000 | 62 | 20.8% |
| $10,000 to $14,999 | 62 | 20.8% |
| $15,000 to $24,999 | 0 | 0.0% |
| $25,000 to $34,999 | 115 | 38.6% |
| $35,000 to $49,999 | 59 | 19.8% |
| $50,000 to $74,999 | 0 | 0.0% |
| $75,000 to $99,999 | 0 | 0.0% |
| $100,000 to $149,999 | 0 | 0.0% |
| $150,000 to $199,999 | 0 | 0.0% |
| $200,000+ | 0 | 0.0% |
Family Income by Famaliy Size in G L Garcia
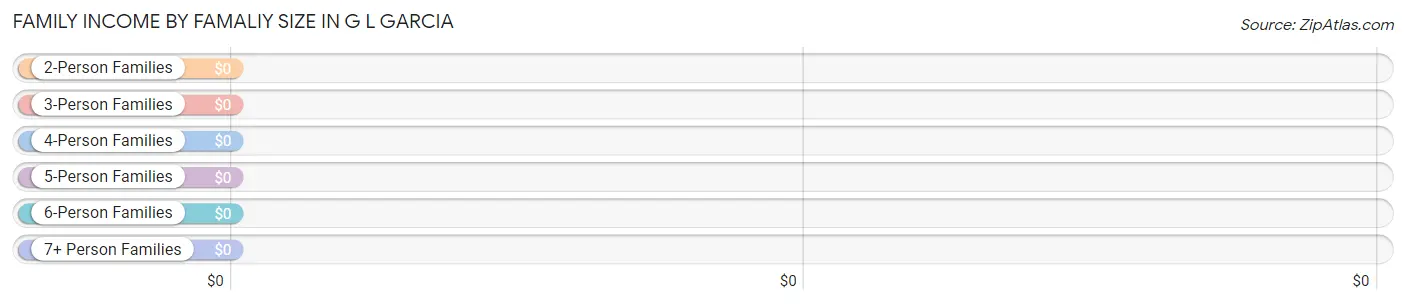
| Income Bracket | # Families | Median Income |
| 2-Person Families | 186 (62.4%) | $0 |
| 3-Person Families | 90 (30.2%) | $0 |
| 4-Person Families | 0 (0.0%) | $0 |
| 5-Person Families | 22 (7.4%) | $0 |
| 6-Person Families | 0 (0.0%) | $0 |
| 7+ Person Families | 0 (0.0%) | $0 |
| Total | 298 (100.0%) | $30,123 |
Family Income by Number of Earners in G L Garcia
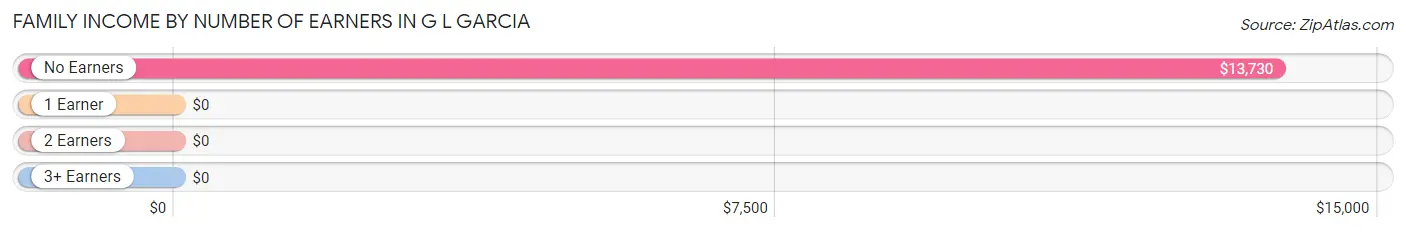
| Number of Earners | # Families | Median Income |
| No Earners | 185 (62.1%) | $13,730 |
| 1 Earner | 81 (27.2%) | $0 |
| 2 Earners | 32 (10.7%) | $0 |
| 3+ Earners | 0 (0.0%) | $0 |
| Total | 298 (100.0%) | $30,123 |
Household Income in G L Garcia
Household Income Brackets in G L Garcia
With 126 households falling in the category, the less than $10,000 income range is the most frequent in G L Garcia, accounting for 24.1% of all households.
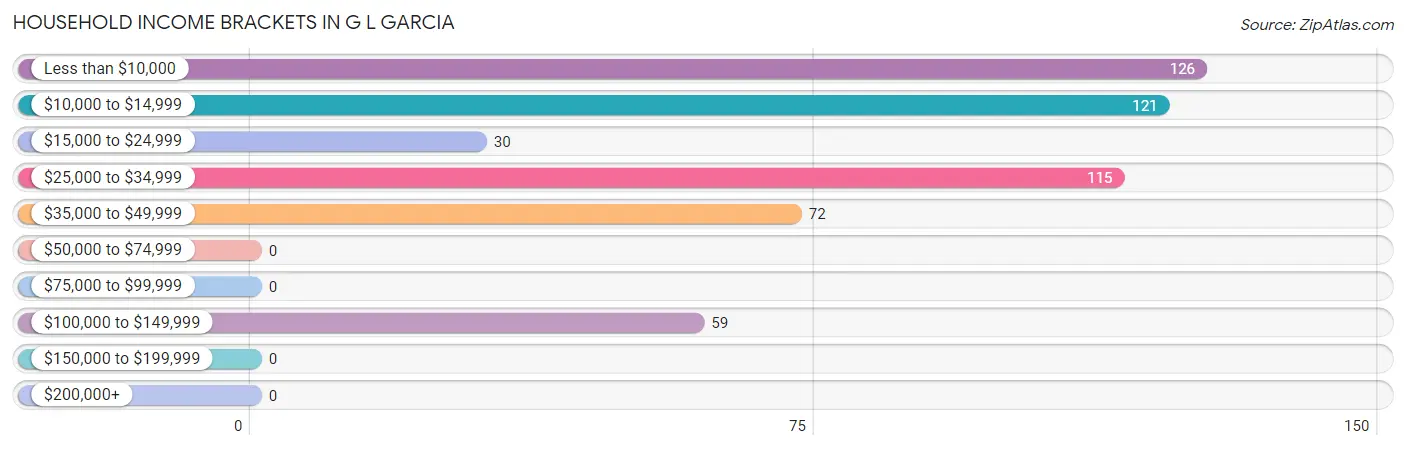
| Income Bracket | # Households | % Households |
| Less than $10,000 | 126 | 24.1% |
| $10,000 to $14,999 | 121 | 23.1% |
| $15,000 to $24,999 | 30 | 5.7% |
| $25,000 to $34,999 | 115 | 22.0% |
| $35,000 to $49,999 | 72 | 13.8% |
| $50,000 to $74,999 | 0 | 0.0% |
| $75,000 to $99,999 | 0 | 0.0% |
| $100,000 to $149,999 | 59 | 11.3% |
| $150,000 to $199,999 | 0 | 0.0% |
| $200,000+ | 0 | 0.0% |
Household Income by Householder Age in G L Garcia
The median household income in G L Garcia is $21,208, with the highest median household income of $21,542 found in the 45 to 64 years age bracket for the primary householder. A total of 233 households (44.6%) fall into this category.
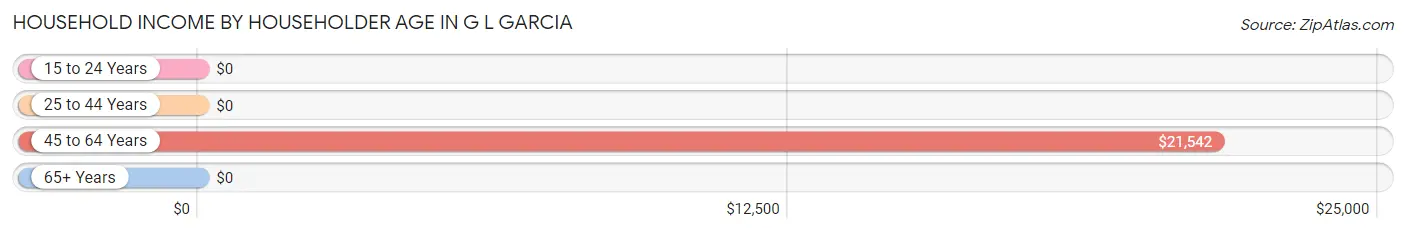
| Income Bracket | # Households | Median Income |
| 15 to 24 Years | 0 (0.0%) | $0 |
| 25 to 44 Years | 94 (18.0%) | $0 |
| 45 to 64 Years | 233 (44.6%) | $21,542 |
| 65+ Years | 196 (37.5%) | $0 |
| Total | 523 (100.0%) | $21,208 |
Poverty in G L Garcia
Income Below Poverty by Sex and Age in G L Garcia
With 54.6% poverty level for males and 52.3% for females among the residents of G L Garcia, 12 to 14 year old males and 18 to 24 year old females are the most vulnerable to poverty, with 28 males (100.0%) and 75 females (100.0%) in their respective age groups living below the poverty level.
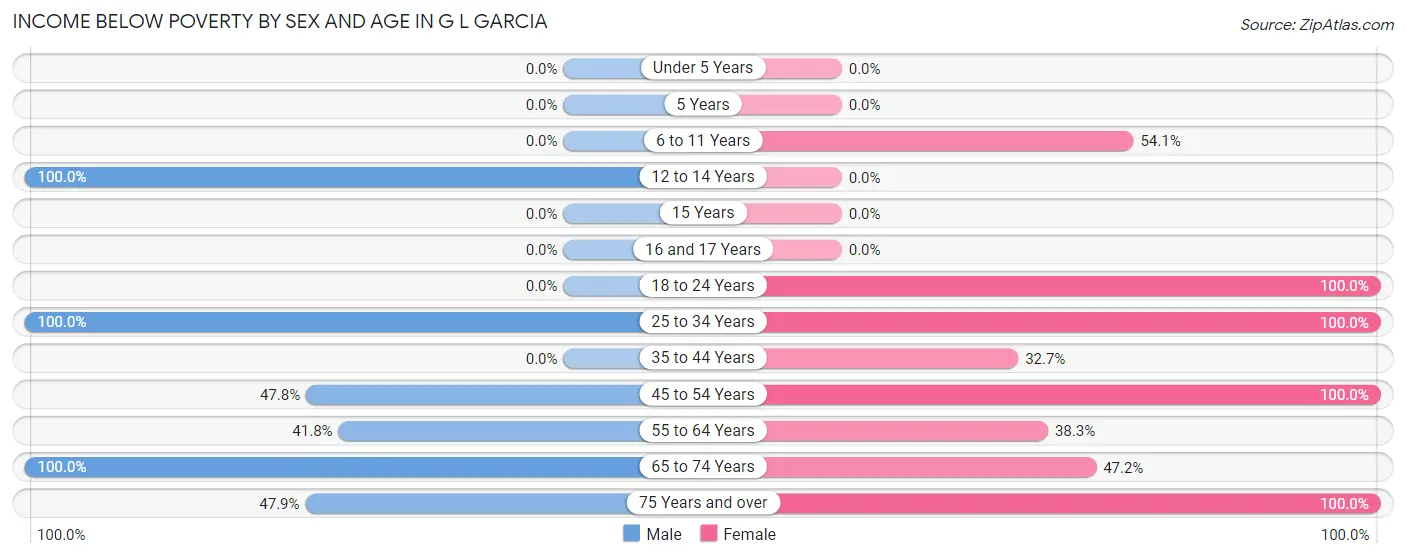
| Age Bracket | Male | Female |
| Under 5 Years | 0 (0.0%) | 0 (0.0%) |
| 5 Years | 0 (0.0%) | 0 (0.0%) |
| 6 to 11 Years | 0 (0.0%) | 72 (54.1%) |
| 12 to 14 Years | 28 (100.0%) | 0 (0.0%) |
| 15 Years | 0 (0.0%) | 0 (0.0%) |
| 16 and 17 Years | 0 (0.0%) | 0 (0.0%) |
| 18 to 24 Years | 0 (0.0%) | 75 (100.0%) |
| 25 to 34 Years | 35 (100.0%) | 33 (100.0%) |
| 35 to 44 Years | 0 (0.0%) | 55 (32.7%) |
| 45 to 54 Years | 32 (47.8%) | 27 (100.0%) |
| 55 to 64 Years | 81 (41.7%) | 62 (38.3%) |
| 65 to 74 Years | 84 (100.0%) | 51 (47.2%) |
| 75 Years and over | 34 (47.9%) | 30 (100.0%) |
| Total | 294 (54.6%) | 405 (52.3%) |
Income Above Poverty by Sex and Age in G L Garcia
According to the poverty statistics in G L Garcia, males aged 35 to 44 years and females aged under 5 years are the age groups that are most secure financially, with 100.0% of males and 100.0% of females in these age groups living above the poverty line.
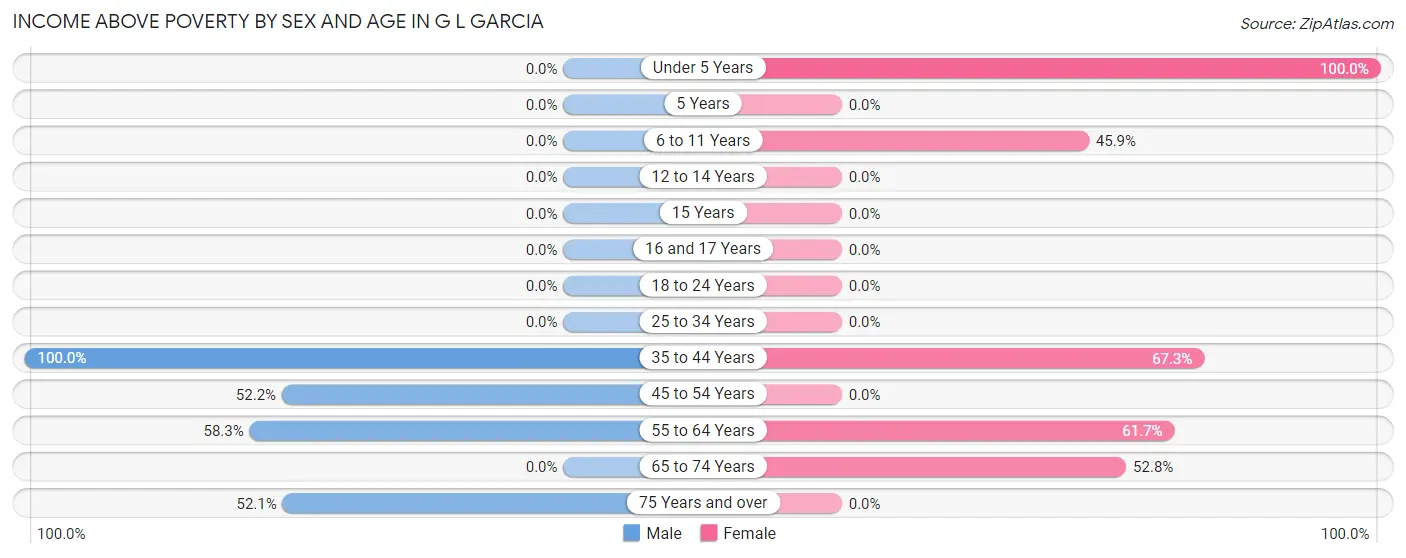
| Age Bracket | Male | Female |
| Under 5 Years | 0 (0.0%) | 38 (100.0%) |
| 5 Years | 0 (0.0%) | 0 (0.0%) |
| 6 to 11 Years | 0 (0.0%) | 61 (45.9%) |
| 12 to 14 Years | 0 (0.0%) | 0 (0.0%) |
| 15 Years | 0 (0.0%) | 0 (0.0%) |
| 16 and 17 Years | 0 (0.0%) | 0 (0.0%) |
| 18 to 24 Years | 0 (0.0%) | 0 (0.0%) |
| 25 to 34 Years | 0 (0.0%) | 0 (0.0%) |
| 35 to 44 Years | 59 (100.0%) | 113 (67.3%) |
| 45 to 54 Years | 35 (52.2%) | 0 (0.0%) |
| 55 to 64 Years | 113 (58.3%) | 100 (61.7%) |
| 65 to 74 Years | 0 (0.0%) | 57 (52.8%) |
| 75 Years and over | 37 (52.1%) | 0 (0.0%) |
| Total | 244 (45.4%) | 369 (47.7%) |
Income Below Poverty Among Married-Couple Families in G L Garcia
The poverty statistics for married-couple families in G L Garcia show that 47.0% or 62 of the total 132 families live below the poverty line. Families with no children have the highest poverty rate of 62.0%, comprising of 62 families. On the other hand, families with 1 or 2 children have the lowest poverty rate of 0.0%, which includes 0 families.
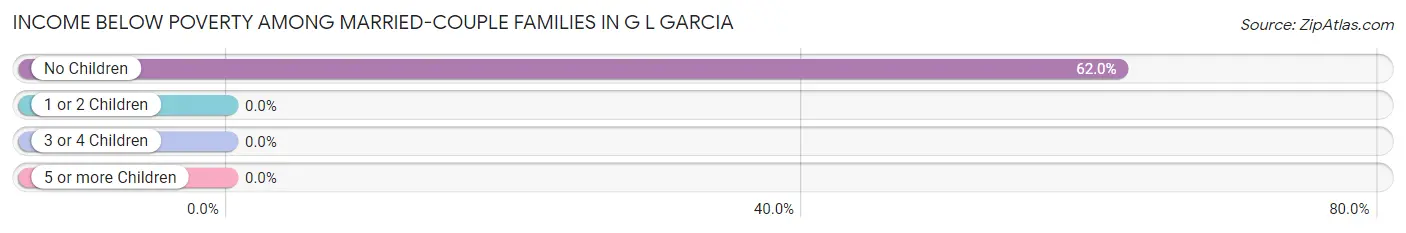
| Children | Above Poverty | Below Poverty |
| No Children | 38 (38.0%) | 62 (62.0%) |
| 1 or 2 Children | 32 (100.0%) | 0 (0.0%) |
| 3 or 4 Children | 0 (0.0%) | 0 (0.0%) |
| 5 or more Children | 0 (0.0%) | 0 (0.0%) |
| Total | 70 (53.0%) | 62 (47.0%) |
Income Below Poverty Among Single-Parent Households in G L Garcia
According to the poverty data in G L Garcia, 51.2% or 62 single-father households and 48.9% or 22 single-mother households are living below the poverty line. Among single-father households, those with no children have the highest poverty rate, with 27 households (100.0%) experiencing poverty. Likewise, among single-mother households, those with 1 or 2 children have the highest poverty rate, with 22 households (100.0%) falling below the poverty line.
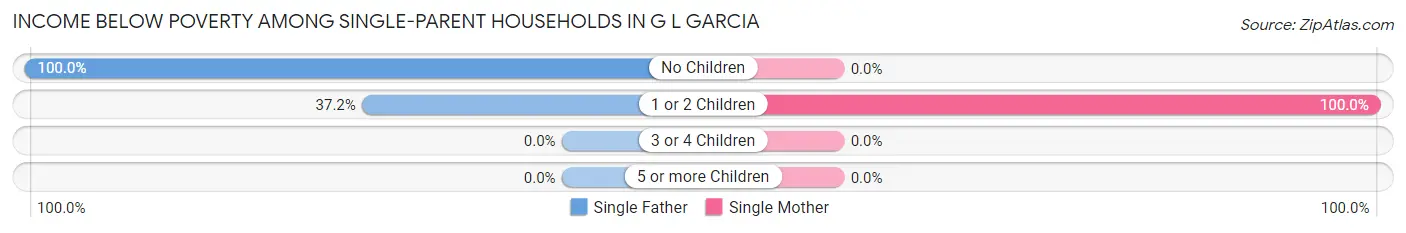
| Children | Single Father | Single Mother |
| No Children | 27 (100.0%) | 0 (0.0%) |
| 1 or 2 Children | 35 (37.2%) | 22 (100.0%) |
| 3 or 4 Children | 0 (0.0%) | 0 (0.0%) |
| 5 or more Children | 0 (0.0%) | 0 (0.0%) |
| Total | 62 (51.2%) | 22 (48.9%) |
Income Below Poverty Among Married-Couple vs Single-Parent Households in G L Garcia
The poverty data for G L Garcia shows that 62 of the married-couple family households (47.0%) and 84 of the single-parent households (50.6%) are living below the poverty level. Within the married-couple family households, those with no children have the highest poverty rate, with 62 households (62.0%) falling below the poverty line. Among the single-parent households, those with no children have the highest poverty rate, with 27 household (54.0%) living below poverty.
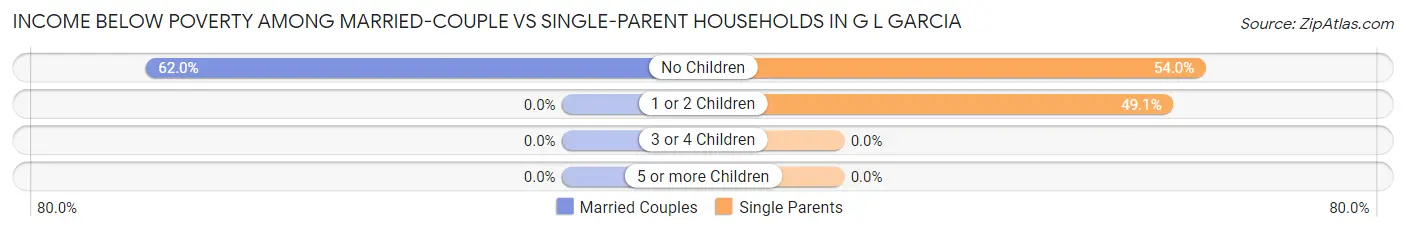
| Children | Married-Couple Families | Single-Parent Households |
| No Children | 62 (62.0%) | 27 (54.0%) |
| 1 or 2 Children | 0 (0.0%) | 57 (49.1%) |
| 3 or 4 Children | 0 (0.0%) | 0 (0.0%) |
| 5 or more Children | 0 (0.0%) | 0 (0.0%) |
| Total | 62 (47.0%) | 84 (50.6%) |
Race in G L Garcia
The most populous races in G L Garcia are Hispanic or Latino (1,312 | 100.0%), Some other Race (464 | 35.4%), and Two or more Races (406 | 30.9%).
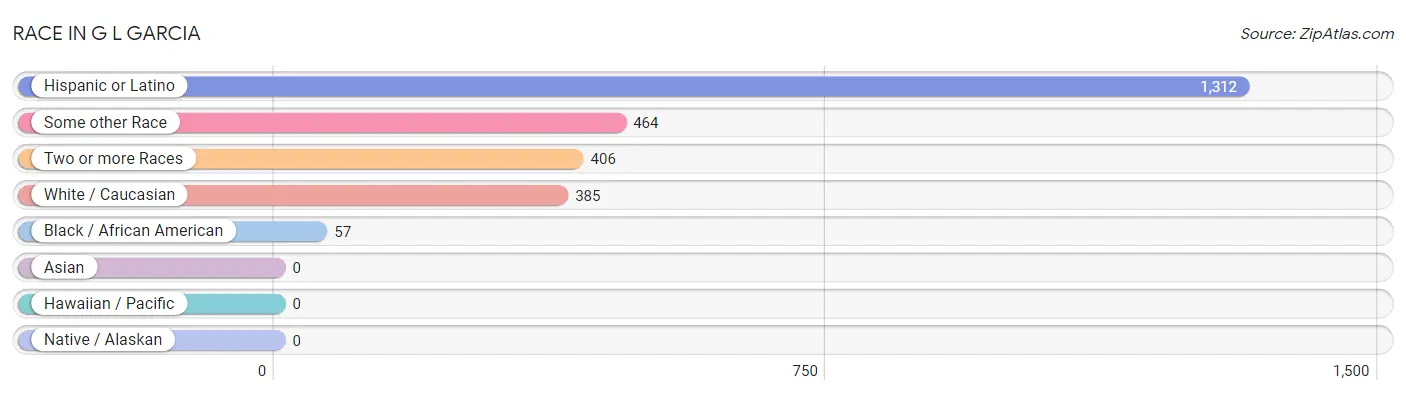
| Race | # Population | % Population |
| Asian | 0 | 0.0% |
| Black / African American | 57 | 4.3% |
| Hawaiian / Pacific | 0 | 0.0% |
| Hispanic or Latino | 1,312 | 100.0% |
| Native / Alaskan | 0 | 0.0% |
| White / Caucasian | 385 | 29.3% |
| Two or more Races | 406 | 30.9% |
| Some other Race | 464 | 35.4% |
| Total | 1,312 | 100.0% |
Ancestry in G L Garcia
The most populous ancestries reported in G L Garcia are , and Puerto Rican (1,312 | 100.0%), together accounting for 100.0% of all G L Garcia residents.

| Ancestry | # Population | % Population |
| Puerto Rican | 1,312 | 100.0% | View All 1 Rows |
Immigrants in G L Garcia

| Immigration Origin | # Population | % Population | View All 0 Rows |
Sex and Age in G L Garcia
Sex and Age in G L Garcia
The most populous age groups in G L Garcia are 60 to 64 Years (113 | 21.0%) for men and 35 to 39 Years (113 | 14.6%) for women.
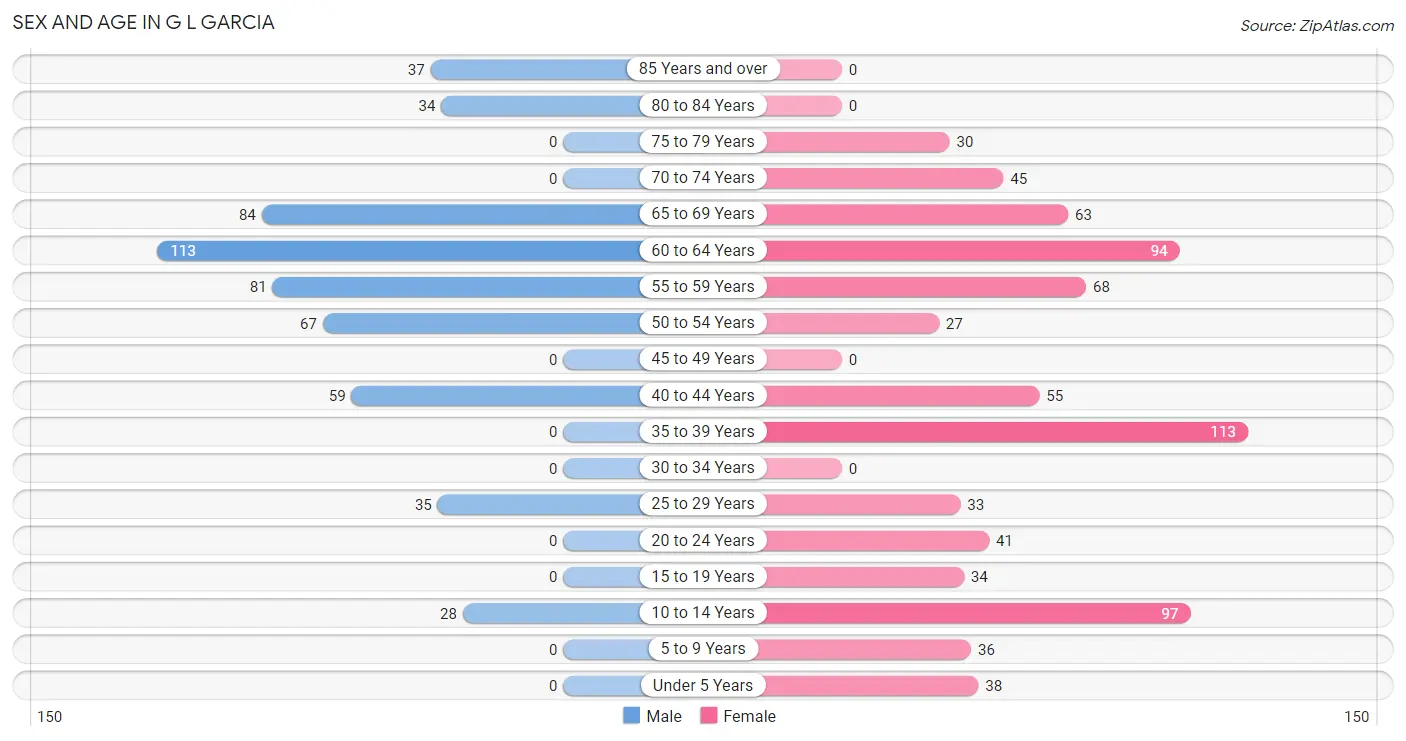
| Age Bracket | Male | Female |
| Under 5 Years | 0 (0.0%) | 38 (4.9%) |
| 5 to 9 Years | 0 (0.0%) | 36 (4.6%) |
| 10 to 14 Years | 28 (5.2%) | 97 (12.5%) |
| 15 to 19 Years | 0 (0.0%) | 34 (4.4%) |
| 20 to 24 Years | 0 (0.0%) | 41 (5.3%) |
| 25 to 29 Years | 35 (6.5%) | 33 (4.3%) |
| 30 to 34 Years | 0 (0.0%) | 0 (0.0%) |
| 35 to 39 Years | 0 (0.0%) | 113 (14.6%) |
| 40 to 44 Years | 59 (11.0%) | 55 (7.1%) |
| 45 to 49 Years | 0 (0.0%) | 0 (0.0%) |
| 50 to 54 Years | 67 (12.4%) | 27 (3.5%) |
| 55 to 59 Years | 81 (15.1%) | 68 (8.8%) |
| 60 to 64 Years | 113 (21.0%) | 94 (12.1%) |
| 65 to 69 Years | 84 (15.6%) | 63 (8.1%) |
| 70 to 74 Years | 0 (0.0%) | 45 (5.8%) |
| 75 to 79 Years | 0 (0.0%) | 30 (3.9%) |
| 80 to 84 Years | 34 (6.3%) | 0 (0.0%) |
| 85 Years and over | 37 (6.9%) | 0 (0.0%) |
| Total | 538 (100.0%) | 774 (100.0%) |
Families and Households in G L Garcia
Median Family Size in G L Garcia
The median family size in G L Garcia is 2.96 persons per family, with single female/mother families (45 | 15.1%) accounting for the largest median family size of 6.16 persons per family. On the other hand, married-couple families (132 | 44.3%) represent the smallest median family size with 2.30 persons per family.
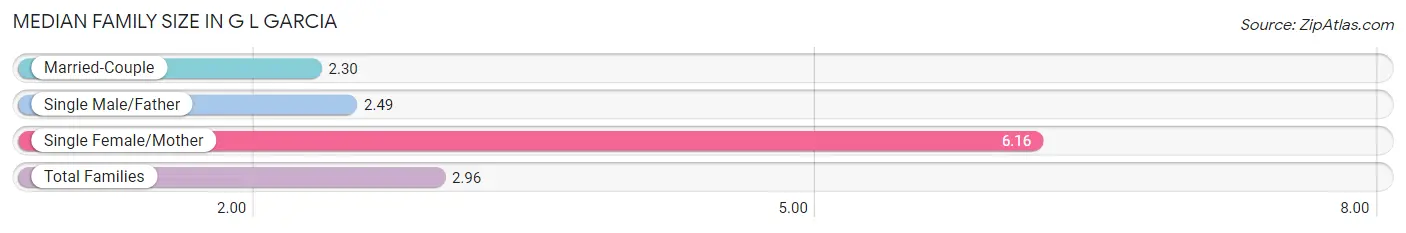
| Family Type | # Families | Family Size |
| Married-Couple | 132 (44.3%) | 2.30 |
| Single Male/Father | 121 (40.6%) | 2.49 |
| Single Female/Mother | 45 (15.1%) | 6.16 |
| Total Families | 298 (100.0%) | 2.96 |
Median Household Size in G L Garcia
The median household size in G L Garcia is 2.51 persons per household, with single female/mother households (45 | 8.6%) accounting for the largest median household size of 6.16 persons per household. non-family households (225 | 43.0%) represent the smallest median household size with 1.26 persons per household.
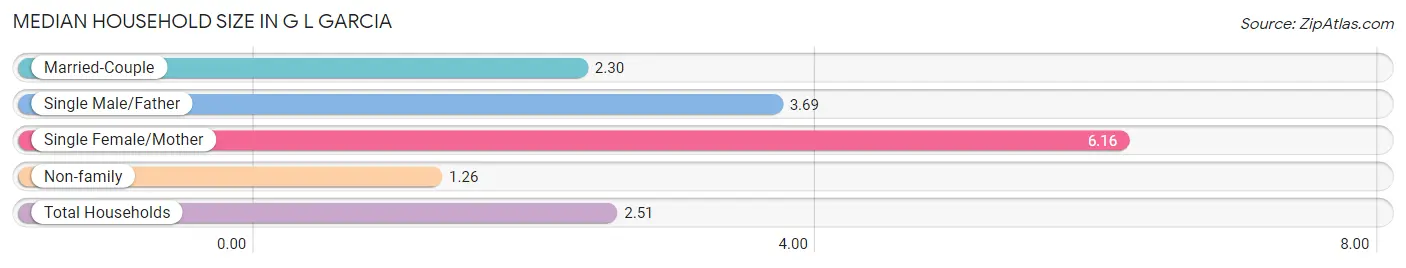
| Household Type | # Households | Household Size |
| Married-Couple | 132 (25.2%) | 2.30 |
| Single Male/Father | 121 (23.1%) | 3.69 |
| Single Female/Mother | 45 (8.6%) | 6.16 |
| Non-family | 225 (43.0%) | 1.26 |
| Total Households | 523 (100.0%) | 2.51 |
Household Size by Marriage Status in G L Garcia
Out of a total of 523 households in G L Garcia, 298 (57.0%) are family households, while 225 (43.0%) are nonfamily households. The most numerous type of family households are 2-person households, comprising 127, and the most common type of nonfamily households are 1-person households, comprising 168.
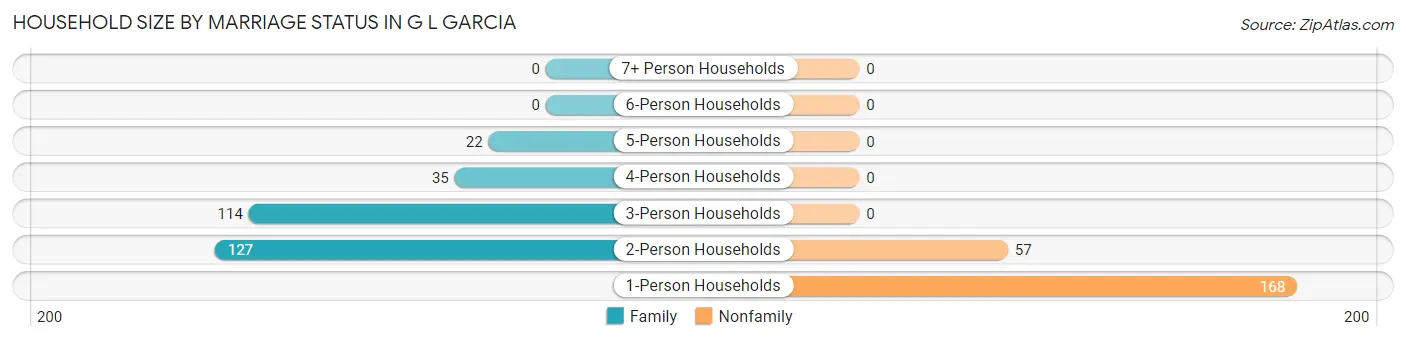
| Household Size | Family Households | Nonfamily Households |
| 1-Person Households | - | 168 (32.1%) |
| 2-Person Households | 127 (24.3%) | 57 (10.9%) |
| 3-Person Households | 114 (21.8%) | 0 (0.0%) |
| 4-Person Households | 35 (6.7%) | 0 (0.0%) |
| 5-Person Households | 22 (4.2%) | 0 (0.0%) |
| 6-Person Households | 0 (0.0%) | 0 (0.0%) |
| 7+ Person Households | 0 (0.0%) | 0 (0.0%) |
| Total | 298 (57.0%) | 225 (43.0%) |
Female Fertility in G L Garcia
Fertility by Age in G L Garcia
| Age Bracket | Women with Births | Births / 1,000 Women |
| 15 to 19 years | 0 (0.0%) | 0.0 |
| 20 to 34 years | 0 (0.0%) | 0.0 |
| 35 to 50 years | 0 (0.0%) | 0.0 |
| Total | 0 (0.0%) | 0.0 |
Fertility by Age by Marriage Status in G L Garcia
| Age Bracket | Married | Unmarried |
| 15 to 19 years | 0 (0.0%) | 0 (0.0%) |
| 20 to 34 years | 0 (0.0%) | 0 (0.0%) |
| 35 to 50 years | 0 (0.0%) | 0 (0.0%) |
| Total | 0 (0.0%) | 0 (0.0%) |
Fertility by Education in G L Garcia
| Educational Attainment | Women with Births | Births / 1,000 Women |
| Less than High School | 0 (0.0%) | 0.0 |
| High School Diploma | 0 (0.0%) | 0.0 |
| College or Associate's Degree | 0 (0.0%) | 0.0 |
| Bachelor's Degree | 0 (0.0%) | 0.0 |
| Graduate Degree | 0 (0.0%) | 0.0 |
| Total | 0 (0.0%) | 0.0 |
Fertility by Education by Marriage Status in G L Garcia
| Educational Attainment | Married | Unmarried |
| Less than High School | 0 (0.0%) | 0 (0.0%) |
| High School Diploma | 0 (0.0%) | 0 (0.0%) |
| College or Associate's Degree | 0 (0.0%) | 0 (0.0%) |
| Bachelor's Degree | 0 (0.0%) | 0 (0.0%) |
| Graduate Degree | 0 (0.0%) | 0 (0.0%) |
| Total | 0 (0.0%) | 0 (0.0%) |
Employment Characteristics in G L Garcia
Employment by Class of Employer in G L Garcia
Among the 214 employed individuals in G L Garcia, private company employees (123 | 57.5%), federal government employees (59 | 27.6%), and self-employed (not incorporated) (32 | 14.9%) make up the most common classes of employment.
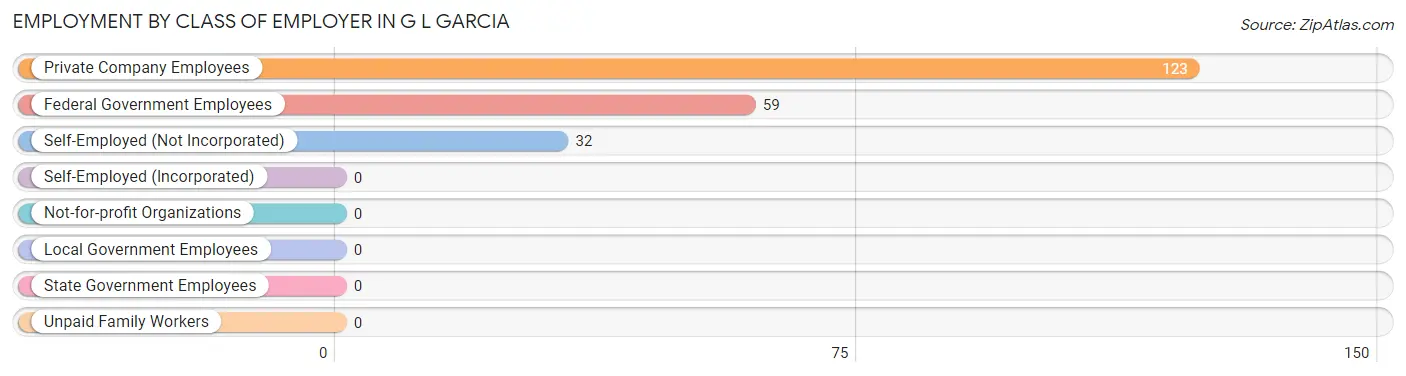
| Employer Class | # Employees | % Employees |
| Private Company Employees | 123 | 57.5% |
| Self-Employed (Incorporated) | 0 | 0.0% |
| Self-Employed (Not Incorporated) | 32 | 14.9% |
| Not-for-profit Organizations | 0 | 0.0% |
| Local Government Employees | 0 | 0.0% |
| State Government Employees | 0 | 0.0% |
| Federal Government Employees | 59 | 27.6% |
| Unpaid Family Workers | 0 | 0.0% |
| Total | 214 | 100.0% |
Employment Status by Age in G L Garcia
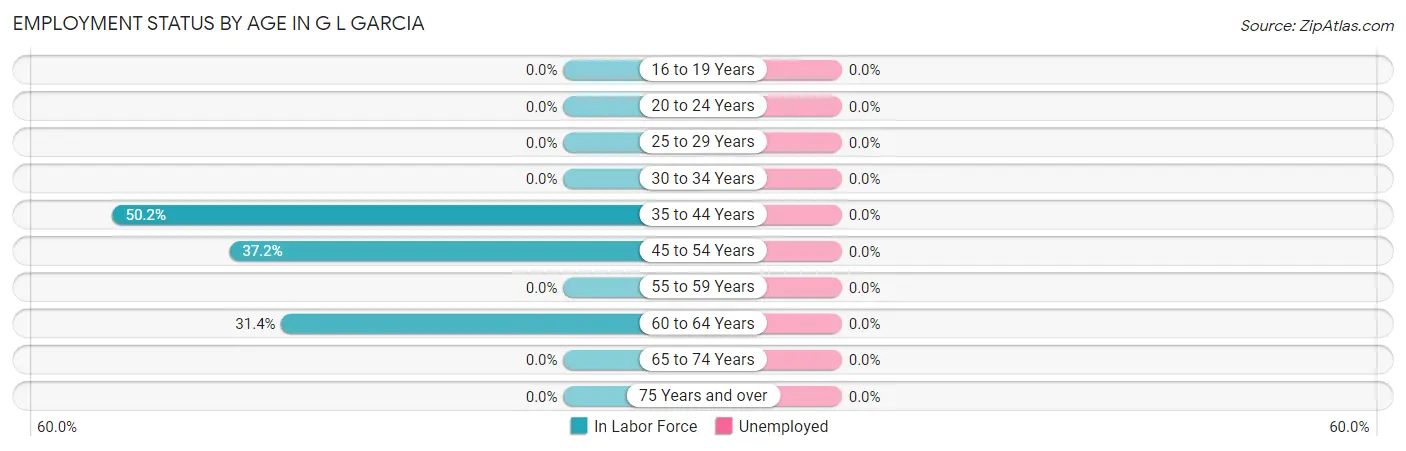
| Age Bracket | In Labor Force | Unemployed |
| 16 to 19 Years | 0 (0.0%) | 0 (0.0%) |
| 20 to 24 Years | 0 (0.0%) | 0 (0.0%) |
| 25 to 29 Years | 0 (0.0%) | 0 (0.0%) |
| 30 to 34 Years | 0 (0.0%) | 0 (0.0%) |
| 35 to 44 Years | 114 (50.2%) | 0 (0.0%) |
| 45 to 54 Years | 35 (37.2%) | 0 (0.0%) |
| 55 to 59 Years | 0 (0.0%) | 0 (0.0%) |
| 60 to 64 Years | 65 (31.4%) | 0 (0.0%) |
| 65 to 74 Years | 0 (0.0%) | 0 (0.0%) |
| 75 Years and over | 0 (0.0%) | 0 (0.0%) |
| Total | 214 (19.2%) | 0 (0.0%) |
Employment Status by Educational Attainment in G L Garcia
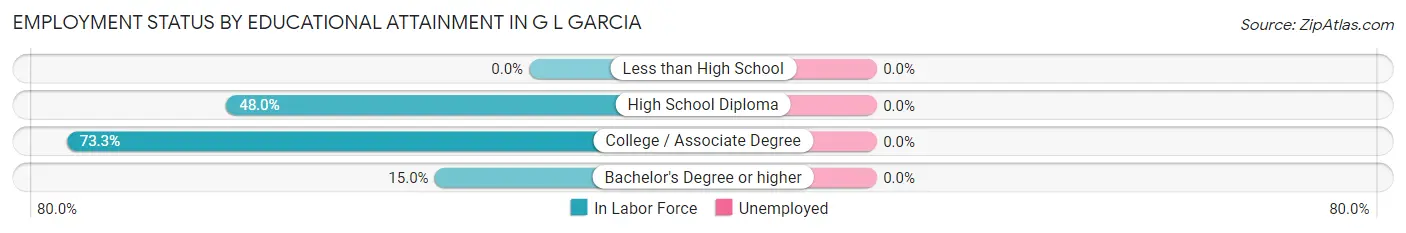
| Educational Attainment | In Labor Force | Unemployed |
| Less than High School | 0 (0.0%) | 0 (0.0%) |
| High School Diploma | 94 (48.0%) | 0 (0.0%) |
| College / Associate Degree | 88 (73.3%) | 0 (0.0%) |
| Bachelor's Degree or higher | 32 (15.0%) | 0 (0.0%) |
| Total | 214 (28.7%) | 0 (0.0%) |
Employment Occupations by Sex in G L Garcia
Management, Business, Science and Arts Occupations
The most common Management, Business, Science and Arts occupations in G L Garcia are Health Diagnosing & Treating (55 | 35.5%), and Management (32 | 20.6%).
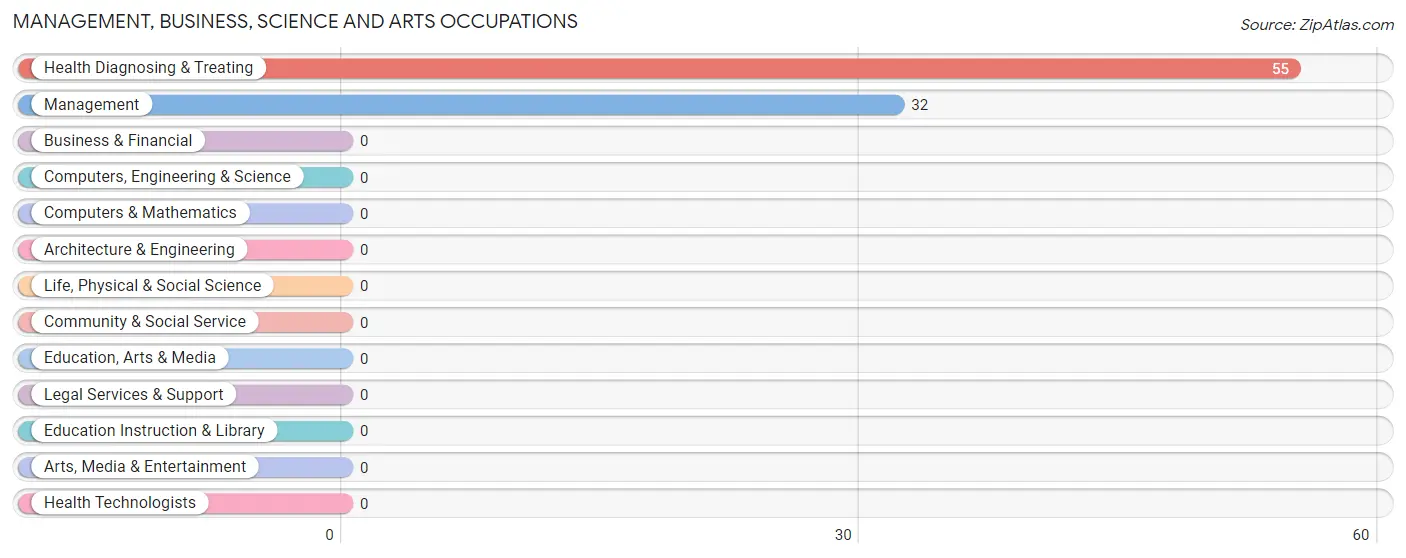
Management, Business, Science and Arts Occupations by Sex
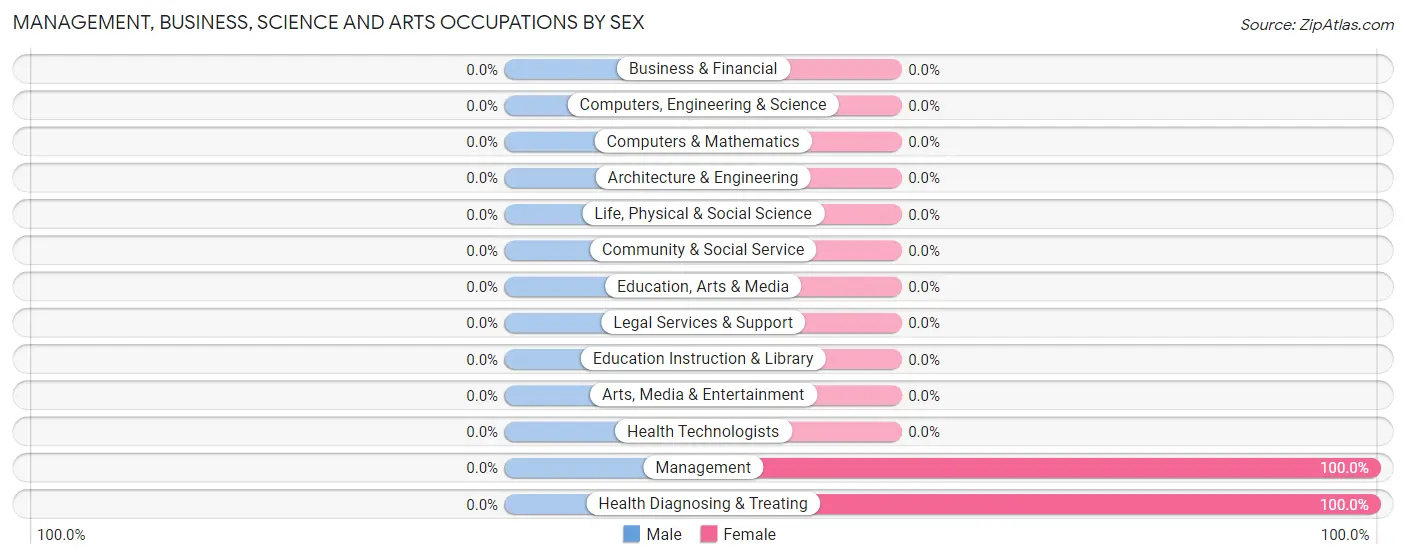
| Occupation | Male | Female |
| Management | 0 (0.0%) | 32 (100.0%) |
| Business & Financial | 0 (0.0%) | 0 (0.0%) |
| Computers, Engineering & Science | 0 (0.0%) | 0 (0.0%) |
| Computers & Mathematics | 0 (0.0%) | 0 (0.0%) |
| Architecture & Engineering | 0 (0.0%) | 0 (0.0%) |
| Life, Physical & Social Science | 0 (0.0%) | 0 (0.0%) |
| Community & Social Service | 0 (0.0%) | 0 (0.0%) |
| Education, Arts & Media | 0 (0.0%) | 0 (0.0%) |
| Legal Services & Support | 0 (0.0%) | 0 (0.0%) |
| Education Instruction & Library | 0 (0.0%) | 0 (0.0%) |
| Arts, Media & Entertainment | 0 (0.0%) | 0 (0.0%) |
| Health Diagnosing & Treating | 0 (0.0%) | 55 (100.0%) |
| Health Technologists | 0 (0.0%) | 0 (0.0%) |
| Total (Category) | 0 (0.0%) | 87 (100.0%) |
| Total (Overall) | 68 (43.9%) | 87 (56.1%) |
Services Occupations
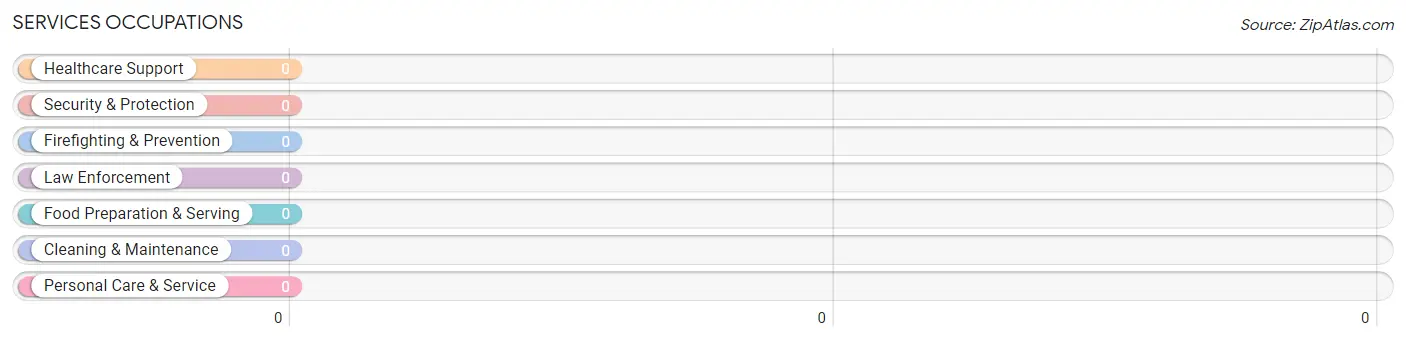
Services Occupations by Sex
| Occupation | Male | Female |
| Healthcare Support | 0 (0.0%) | 0 (0.0%) |
| Security & Protection | 0 (0.0%) | 0 (0.0%) |
| Firefighting & Prevention | 0 (0.0%) | 0 (0.0%) |
| Law Enforcement | 0 (0.0%) | 0 (0.0%) |
| Food Preparation & Serving | 0 (0.0%) | 0 (0.0%) |
| Cleaning & Maintenance | 0 (0.0%) | 0 (0.0%) |
| Personal Care & Service | 0 (0.0%) | 0 (0.0%) |
| Total (Category) | 0 (0.0%) | 0 (0.0%) |
| Total (Overall) | 68 (43.9%) | 87 (56.1%) |
Sales and Office Occupations
The most common Sales and Office occupations in G L Garcia are , and Sales & Related (35 | 22.6%).
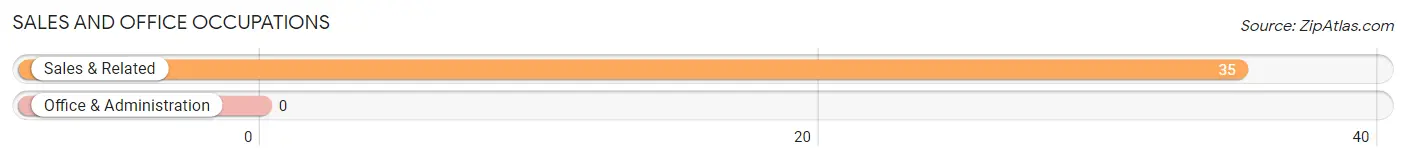
Sales and Office Occupations by Sex

| Occupation | Male | Female |
| Sales & Related | 35 (100.0%) | 0 (0.0%) |
| Office & Administration | 0 (0.0%) | 0 (0.0%) |
| Total (Category) | 35 (100.0%) | 0 (0.0%) |
| Total (Overall) | 68 (43.9%) | 87 (56.1%) |
Natural Resources, Construction and Maintenance Occupations
The most common Natural Resources, Construction and Maintenance occupations in G L Garcia are , and Installation, Maintenance & Repair (33 | 21.3%).
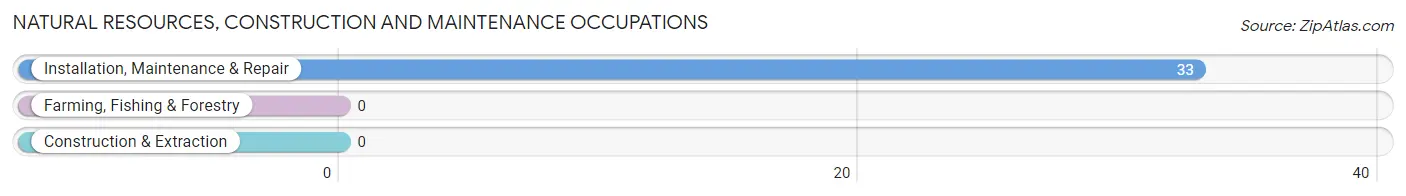
Natural Resources, Construction and Maintenance Occupations by Sex
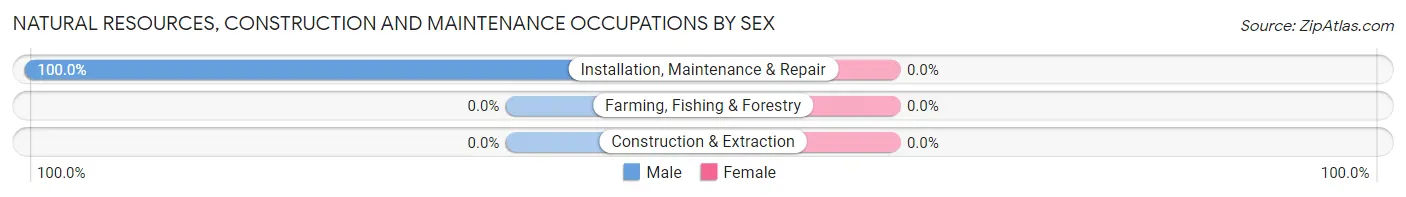
| Occupation | Male | Female |
| Farming, Fishing & Forestry | 0 (0.0%) | 0 (0.0%) |
| Construction & Extraction | 0 (0.0%) | 0 (0.0%) |
| Installation, Maintenance & Repair | 33 (100.0%) | 0 (0.0%) |
| Total (Category) | 33 (100.0%) | 0 (0.0%) |
| Total (Overall) | 68 (43.9%) | 87 (56.1%) |
Production, Transportation and Moving Occupations
Production, Transportation and Moving Occupations by Sex
| Occupation | Male | Female |
| Production | 0 (0.0%) | 0 (0.0%) |
| Transportation | 0 (0.0%) | 0 (0.0%) |
| Material Moving | 0 (0.0%) | 0 (0.0%) |
| Total (Category) | 0 (0.0%) | 0 (0.0%) |
| Total (Overall) | 68 (43.9%) | 87 (56.1%) |
Employment Industries by Sex in G L Garcia
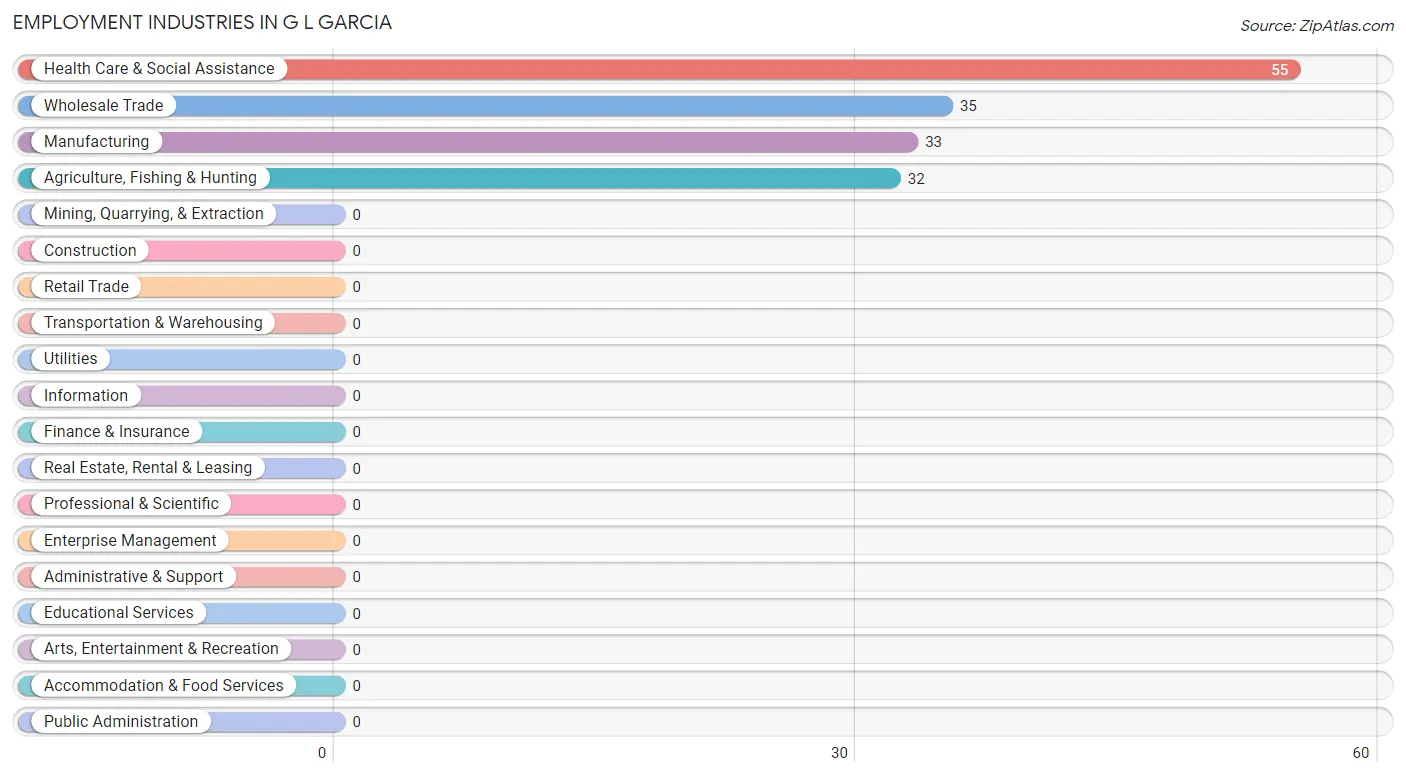
Employment Industries in G L Garcia
The major employment industries in G L Garcia include Health Care & Social Assistance (55 | 35.5%), Wholesale Trade (35 | 22.6%), Manufacturing (33 | 21.3%), and Agriculture, Fishing & Hunting (32 | 20.6%).
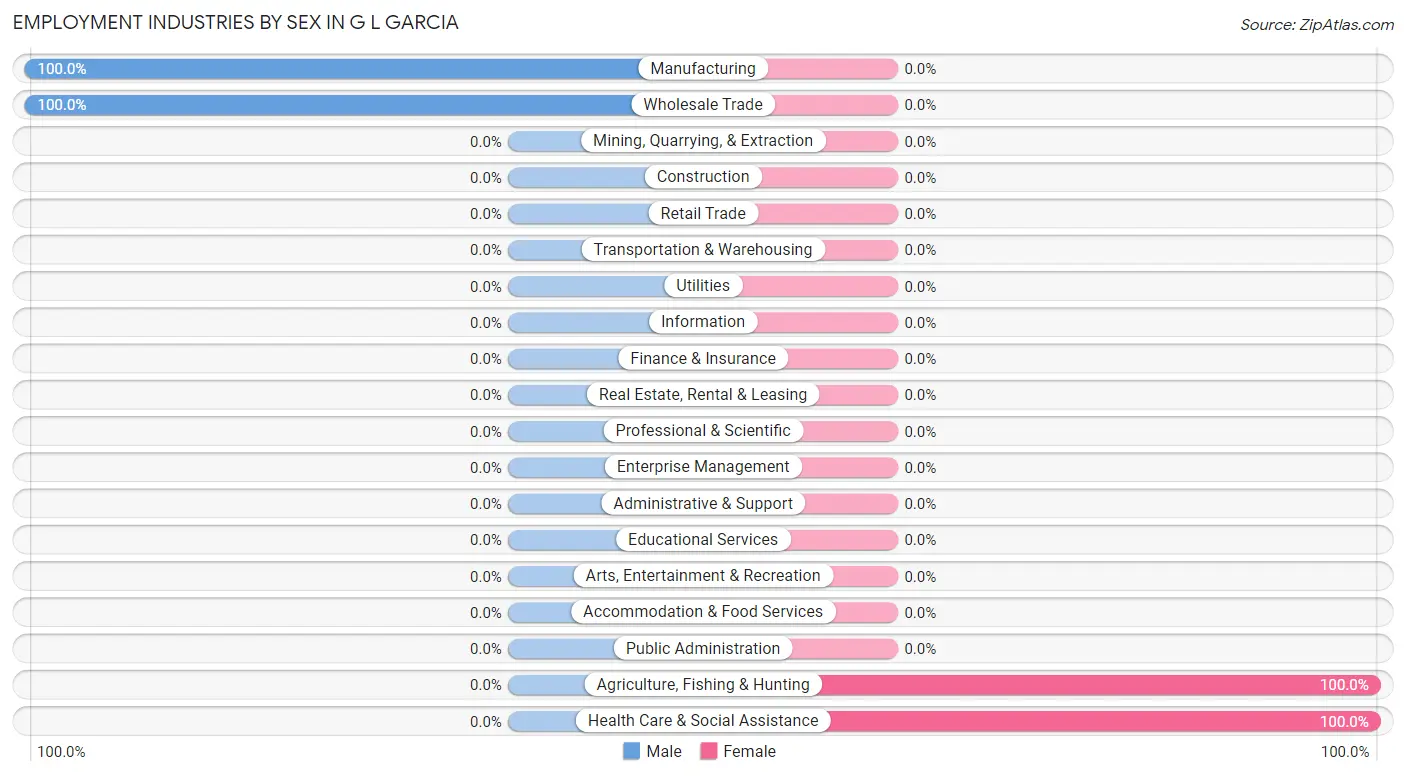
Employment Industries by Sex in G L Garcia
The G L Garcia industries that see more men than women are Manufacturing (100.0%), and Wholesale Trade (100.0%), whereas the industries that tend to have a higher number of women are Agriculture, Fishing & Hunting (100.0%), and Health Care & Social Assistance (100.0%).
| Industry | Male | Female |
| Agriculture, Fishing & Hunting | 0 (0.0%) | 32 (100.0%) |
| Mining, Quarrying, & Extraction | 0 (0.0%) | 0 (0.0%) |
| Construction | 0 (0.0%) | 0 (0.0%) |
| Manufacturing | 33 (100.0%) | 0 (0.0%) |
| Wholesale Trade | 35 (100.0%) | 0 (0.0%) |
| Retail Trade | 0 (0.0%) | 0 (0.0%) |
| Transportation & Warehousing | 0 (0.0%) | 0 (0.0%) |
| Utilities | 0 (0.0%) | 0 (0.0%) |
| Information | 0 (0.0%) | 0 (0.0%) |
| Finance & Insurance | 0 (0.0%) | 0 (0.0%) |
| Real Estate, Rental & Leasing | 0 (0.0%) | 0 (0.0%) |
| Professional & Scientific | 0 (0.0%) | 0 (0.0%) |
| Enterprise Management | 0 (0.0%) | 0 (0.0%) |
| Administrative & Support | 0 (0.0%) | 0 (0.0%) |
| Educational Services | 0 (0.0%) | 0 (0.0%) |
| Health Care & Social Assistance | 0 (0.0%) | 55 (100.0%) |
| Arts, Entertainment & Recreation | 0 (0.0%) | 0 (0.0%) |
| Accommodation & Food Services | 0 (0.0%) | 0 (0.0%) |
| Public Administration | 0 (0.0%) | 0 (0.0%) |
| Total | 68 (43.9%) | 87 (56.1%) |
Education in G L Garcia
School Enrollment in G L Garcia
The most common levels of schooling among the 233 students in G L Garcia are middle school (125 | 53.6%), nursery / preschool (38 | 16.3%), and elementary school (36 | 15.4%).
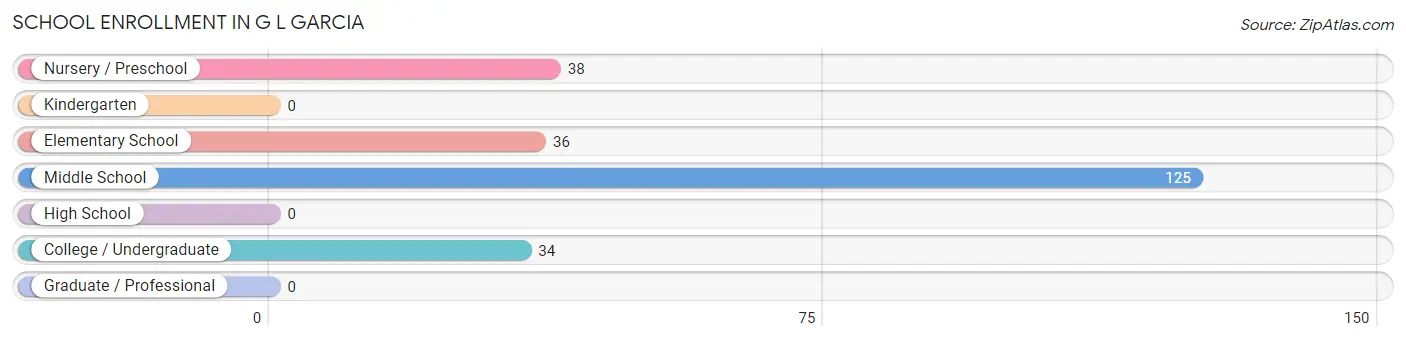
| School Level | # Students | % Students |
| Nursery / Preschool | 38 | 16.3% |
| Kindergarten | 0 | 0.0% |
| Elementary School | 36 | 15.4% |
| Middle School | 125 | 53.6% |
| High School | 0 | 0.0% |
| College / Undergraduate | 34 | 14.6% |
| Graduate / Professional | 0 | 0.0% |
| Total | 233 | 100.0% |
School Enrollment by Age by Funding Source in G L Garcia
Out of a total of 233 students who are enrolled in schools in G L Garcia, 106 (45.5%) attend a private institution, while the remaining 127 (54.5%) are enrolled in public schools. The age group of 5 to 9 year old has the highest likelihood of being enrolled in private schools, with 36 (100.0% in the age bracket) enrolled. Conversely, the age group of 3 to 4 year olds has the lowest likelihood of being enrolled in a private school, with 38 (100.0% in the age bracket) attending a public institution.
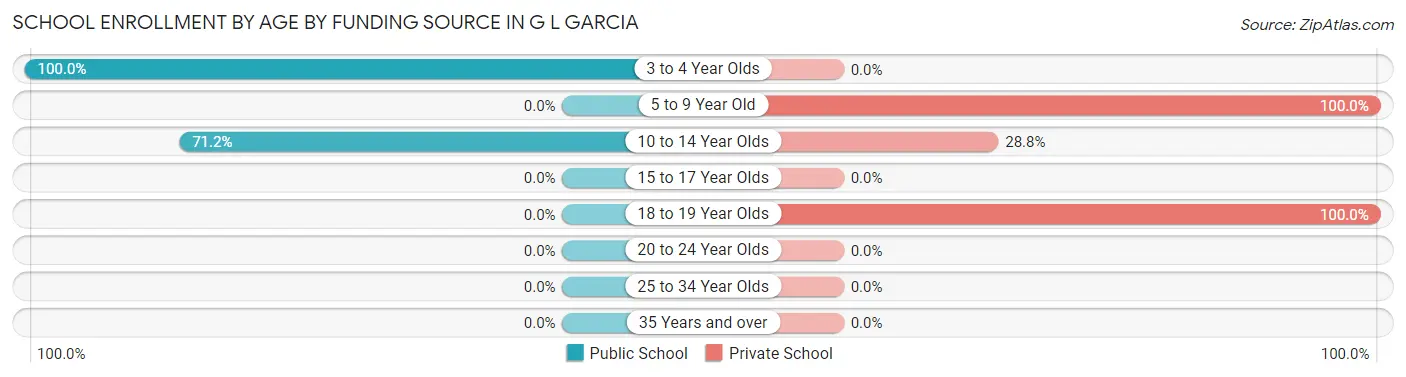
| Age Bracket | Public School | Private School |
| 3 to 4 Year Olds | 38 (100.0%) | 0 (0.0%) |
| 5 to 9 Year Old | 0 (0.0%) | 36 (100.0%) |
| 10 to 14 Year Olds | 89 (71.2%) | 36 (28.8%) |
| 15 to 17 Year Olds | 0 (0.0%) | 0 (0.0%) |
| 18 to 19 Year Olds | 0 (0.0%) | 34 (100.0%) |
| 20 to 24 Year Olds | 0 (0.0%) | 0 (0.0%) |
| 25 to 34 Year Olds | 0 (0.0%) | 0 (0.0%) |
| 35 Years and over | 0 (0.0%) | 0 (0.0%) |
| Total | 127 (54.5%) | 106 (45.5%) |
Educational Attainment by Field of Study in G L Garcia
Education (151 | 70.9%), business (32 | 15.0%), and science & technology (30 | 14.1%) are the most common fields of study among 213 individuals in G L Garcia who have obtained a bachelor's degree or higher.
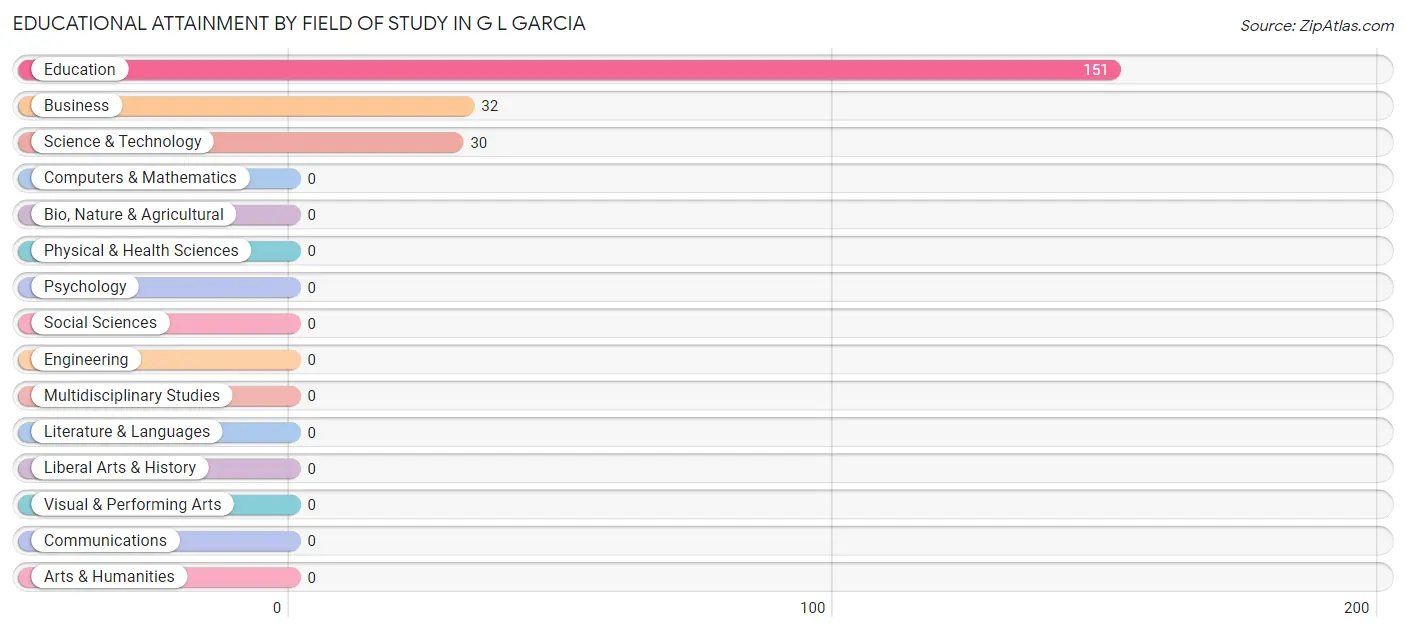
| Field of Study | # Graduates | % Graduates |
| Computers & Mathematics | 0 | 0.0% |
| Bio, Nature & Agricultural | 0 | 0.0% |
| Physical & Health Sciences | 0 | 0.0% |
| Psychology | 0 | 0.0% |
| Social Sciences | 0 | 0.0% |
| Engineering | 0 | 0.0% |
| Multidisciplinary Studies | 0 | 0.0% |
| Science & Technology | 30 | 14.1% |
| Business | 32 | 15.0% |
| Education | 151 | 70.9% |
| Literature & Languages | 0 | 0.0% |
| Liberal Arts & History | 0 | 0.0% |
| Visual & Performing Arts | 0 | 0.0% |
| Communications | 0 | 0.0% |
| Arts & Humanities | 0 | 0.0% |
| Total | 213 | 100.0% |
Transportation & Commute in G L Garcia
Vehicle Availability by Sex in G L Garcia
The most prevalent vehicle ownership categories in G L Garcia are males with 2 vehicles (127, accounting for 100.0%) and females with 2 vehicles (32, making up 146.0%).
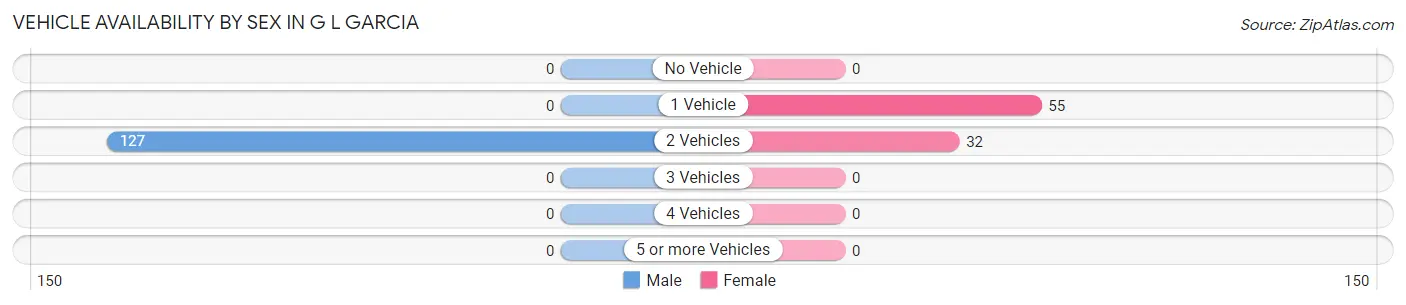
| Vehicles Available | Male | Female |
| No Vehicle | 0 (0.0%) | 0 (0.0%) |
| 1 Vehicle | 0 (0.0%) | 55 (63.2%) |
| 2 Vehicles | 127 (100.0%) | 32 (36.8%) |
| 3 Vehicles | 0 (0.0%) | 0 (0.0%) |
| 4 Vehicles | 0 (0.0%) | 0 (0.0%) |
| 5 or more Vehicles | 0 (0.0%) | 0 (0.0%) |
| Total | 127 (100.0%) | 87 (100.0%) |
Commute Time in G L Garcia
The most frequently occuring commute durations in G L Garcia are 15 to 19 minutes (92 commuters, 43.0%), 30 to 34 minutes (87 commuters, 40.6%), and 60 to 89 minutes (35 commuters, 16.4%).
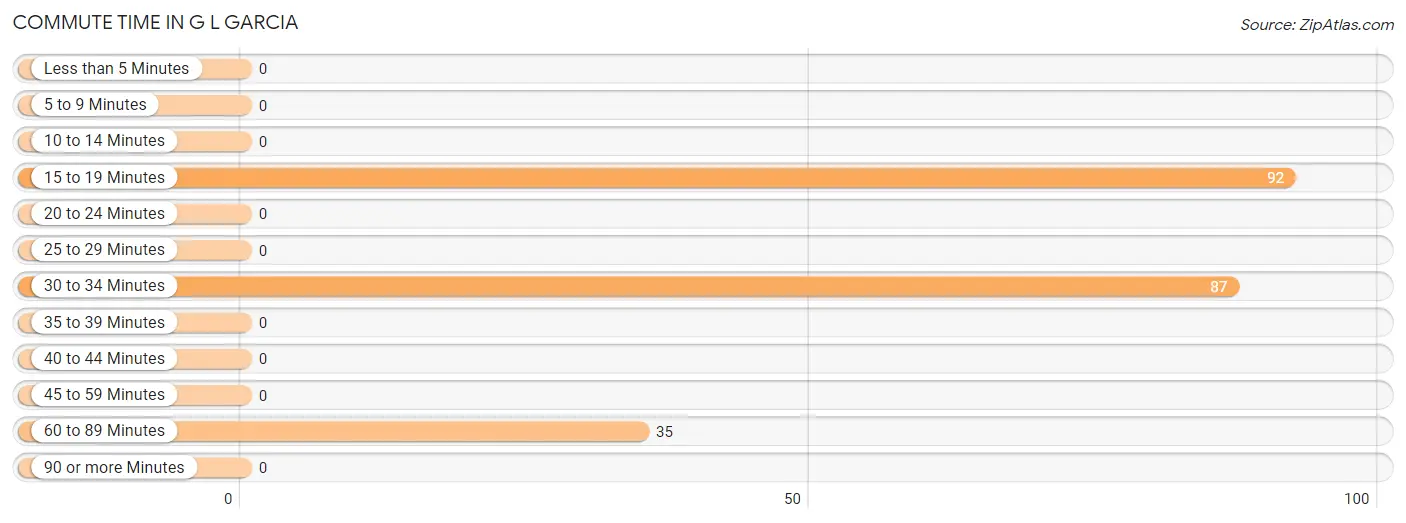
| Commute Time | # Commuters | % Commuters |
| Less than 5 Minutes | 0 | 0.0% |
| 5 to 9 Minutes | 0 | 0.0% |
| 10 to 14 Minutes | 0 | 0.0% |
| 15 to 19 Minutes | 92 | 43.0% |
| 20 to 24 Minutes | 0 | 0.0% |
| 25 to 29 Minutes | 0 | 0.0% |
| 30 to 34 Minutes | 87 | 40.6% |
| 35 to 39 Minutes | 0 | 0.0% |
| 40 to 44 Minutes | 0 | 0.0% |
| 45 to 59 Minutes | 0 | 0.0% |
| 60 to 89 Minutes | 35 | 16.4% |
| 90 or more Minutes | 0 | 0.0% |
Commute Time by Sex in G L Garcia
The most common commute times in G L Garcia are 15 to 19 minutes (92 commuters, 72.4%) for males and 30 to 34 minutes (87 commuters, 100.0%) for females.
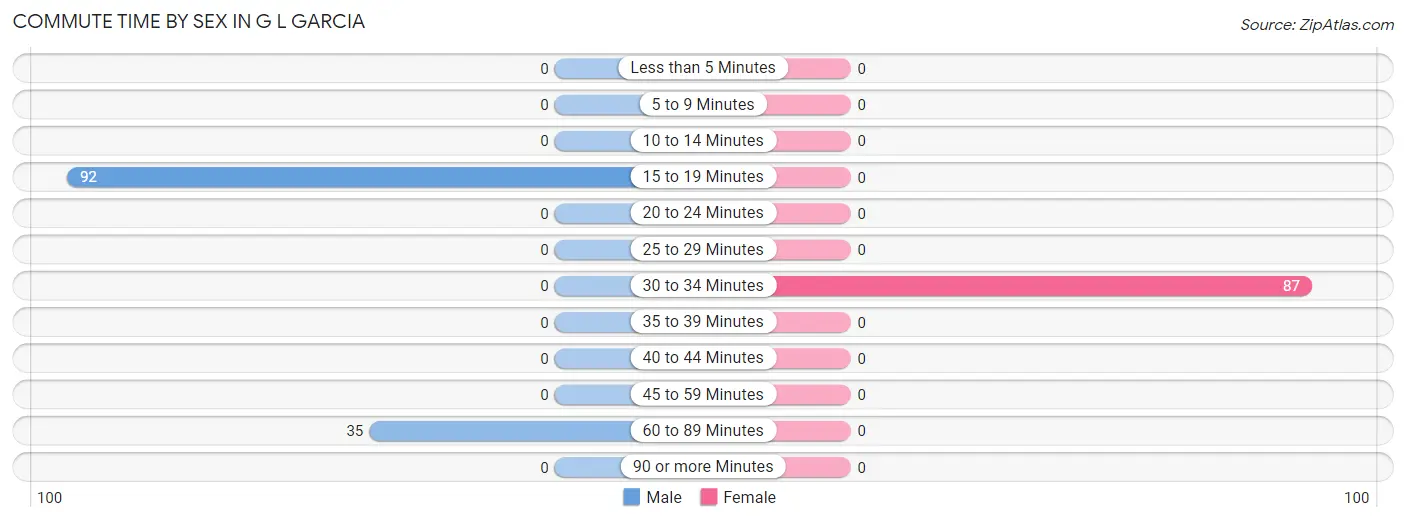
| Commute Time | Male | Female |
| Less than 5 Minutes | 0 (0.0%) | 0 (0.0%) |
| 5 to 9 Minutes | 0 (0.0%) | 0 (0.0%) |
| 10 to 14 Minutes | 0 (0.0%) | 0 (0.0%) |
| 15 to 19 Minutes | 92 (72.4%) | 0 (0.0%) |
| 20 to 24 Minutes | 0 (0.0%) | 0 (0.0%) |
| 25 to 29 Minutes | 0 (0.0%) | 0 (0.0%) |
| 30 to 34 Minutes | 0 (0.0%) | 87 (100.0%) |
| 35 to 39 Minutes | 0 (0.0%) | 0 (0.0%) |
| 40 to 44 Minutes | 0 (0.0%) | 0 (0.0%) |
| 45 to 59 Minutes | 0 (0.0%) | 0 (0.0%) |
| 60 to 89 Minutes | 35 (27.6%) | 0 (0.0%) |
| 90 or more Minutes | 0 (0.0%) | 0 (0.0%) |
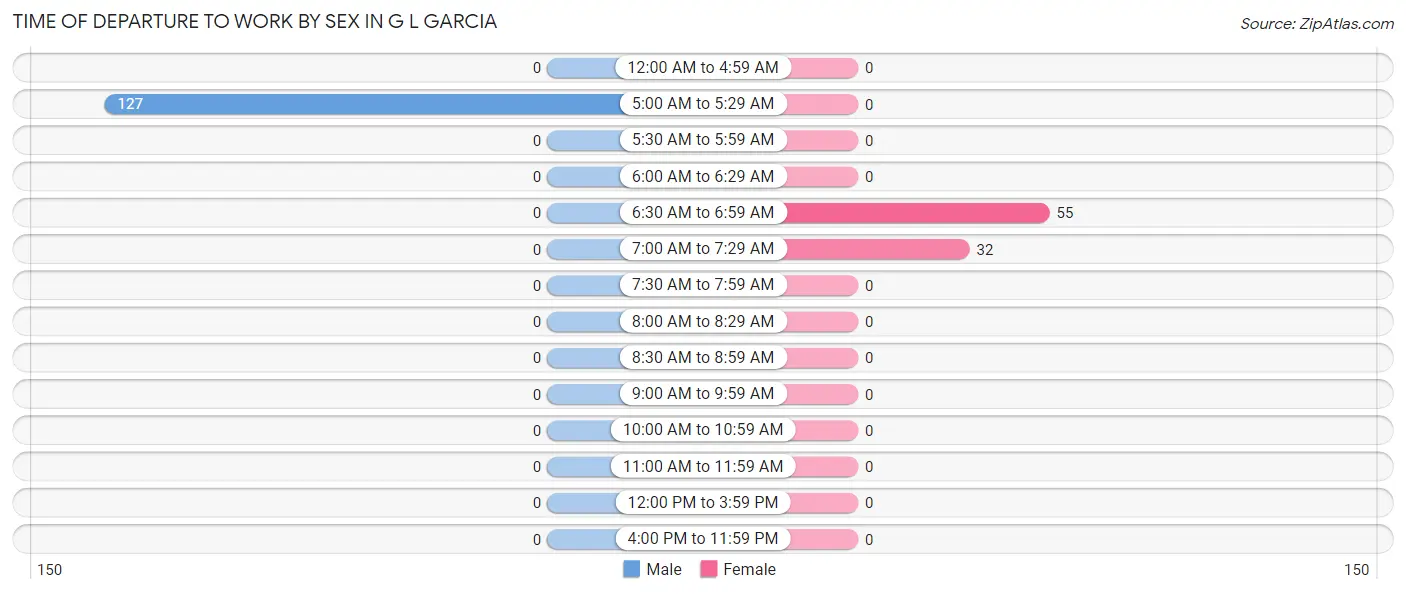
Time of Departure to Work by Sex in G L Garcia
The most frequent times of departure to work in G L Garcia are 5:00 AM to 5:29 AM (127, 100.0%) for males and 6:30 AM to 6:59 AM (55, 63.2%) for females.
| Time of Departure | Male | Female |
| 12:00 AM to 4:59 AM | 0 (0.0%) | 0 (0.0%) |
| 5:00 AM to 5:29 AM | 127 (100.0%) | 0 (0.0%) |
| 5:30 AM to 5:59 AM | 0 (0.0%) | 0 (0.0%) |
| 6:00 AM to 6:29 AM | 0 (0.0%) | 0 (0.0%) |
| 6:30 AM to 6:59 AM | 0 (0.0%) | 55 (63.2%) |
| 7:00 AM to 7:29 AM | 0 (0.0%) | 32 (36.8%) |
| 7:30 AM to 7:59 AM | 0 (0.0%) | 0 (0.0%) |
| 8:00 AM to 8:29 AM | 0 (0.0%) | 0 (0.0%) |
| 8:30 AM to 8:59 AM | 0 (0.0%) | 0 (0.0%) |
| 9:00 AM to 9:59 AM | 0 (0.0%) | 0 (0.0%) |
| 10:00 AM to 10:59 AM | 0 (0.0%) | 0 (0.0%) |
| 11:00 AM to 11:59 AM | 0 (0.0%) | 0 (0.0%) |
| 12:00 PM to 3:59 PM | 0 (0.0%) | 0 (0.0%) |
| 4:00 PM to 11:59 PM | 0 (0.0%) | 0 (0.0%) |
| Total | 127 (100.0%) | 87 (100.0%) |
Housing Occupancy in G L Garcia
Occupancy by Ownership in G L Garcia
Of the total 523 dwellings in G L Garcia, owner-occupied units account for 308 (58.9%), while renter-occupied units make up 215 (41.1%).
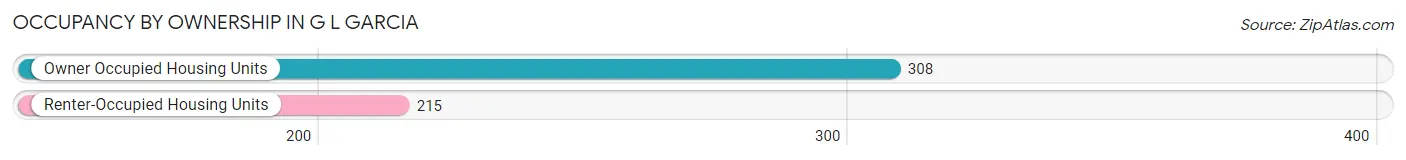
| Occupancy | # Housing Units | % Housing Units |
| Owner Occupied Housing Units | 308 | 58.9% |
| Renter-Occupied Housing Units | 215 | 41.1% |
| Total Occupied Housing Units | 523 | 100.0% |
Occupancy by Household Size in G L Garcia
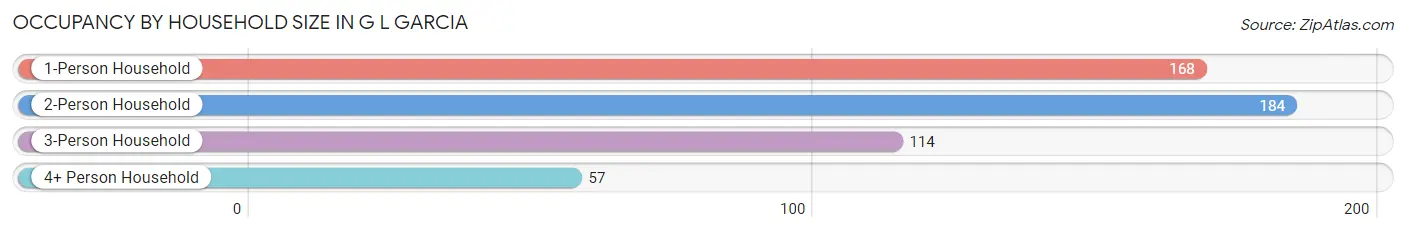
| Household Size | # Housing Units | % Housing Units |
| 1-Person Household | 168 | 32.1% |
| 2-Person Household | 184 | 35.2% |
| 3-Person Household | 114 | 21.8% |
| 4+ Person Household | 57 | 10.9% |
| Total Housing Units | 523 | 100.0% |
Occupancy by Ownership by Household Size in G L Garcia
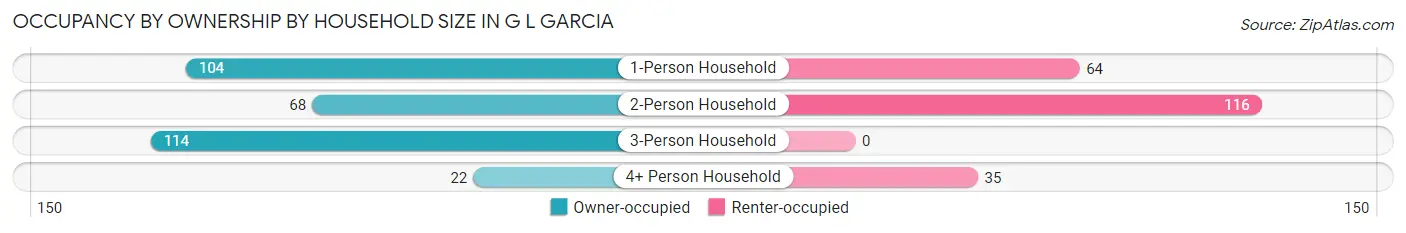
| Household Size | Owner-occupied | Renter-occupied |
| 1-Person Household | 104 (61.9%) | 64 (38.1%) |
| 2-Person Household | 68 (37.0%) | 116 (63.0%) |
| 3-Person Household | 114 (100.0%) | 0 (0.0%) |
| 4+ Person Household | 22 (38.6%) | 35 (61.4%) |
| Total Housing Units | 308 (58.9%) | 215 (41.1%) |
Occupancy by Educational Attainment in G L Garcia
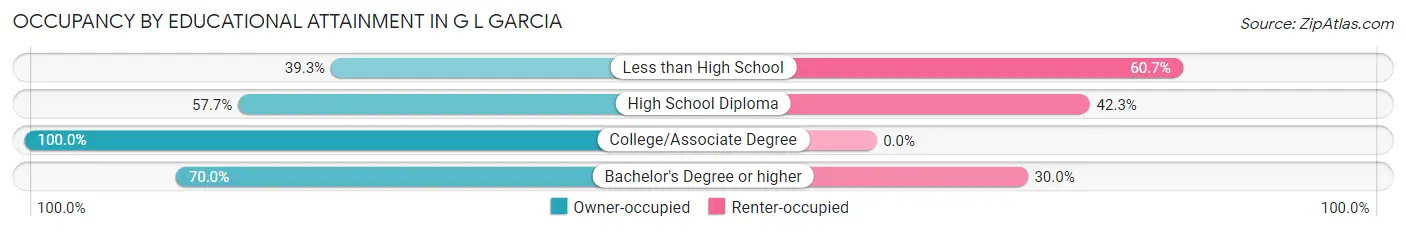
| Household Size | Owner-occupied | Renter-occupied |
| Less than High School | 75 (39.3%) | 116 (60.7%) |
| High School Diploma | 94 (57.7%) | 69 (42.3%) |
| College/Associate Degree | 69 (100.0%) | 0 (0.0%) |
| Bachelor's Degree or higher | 70 (70.0%) | 30 (30.0%) |
Occupancy by Age of Householder in G L Garcia
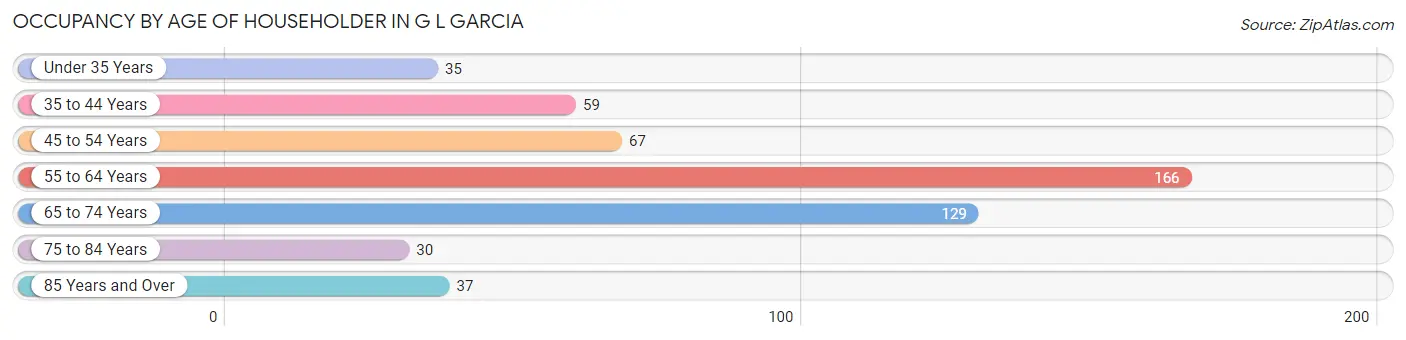
| Age Bracket | # Households | % Households |
| Under 35 Years | 35 | 6.7% |
| 35 to 44 Years | 59 | 11.3% |
| 45 to 54 Years | 67 | 12.8% |
| 55 to 64 Years | 166 | 31.7% |
| 65 to 74 Years | 129 | 24.7% |
| 75 to 84 Years | 30 | 5.7% |
| 85 Years and Over | 37 | 7.1% |
| Total | 523 | 100.0% |
Housing Finances in G L Garcia
Median Income by Occupancy in G L Garcia
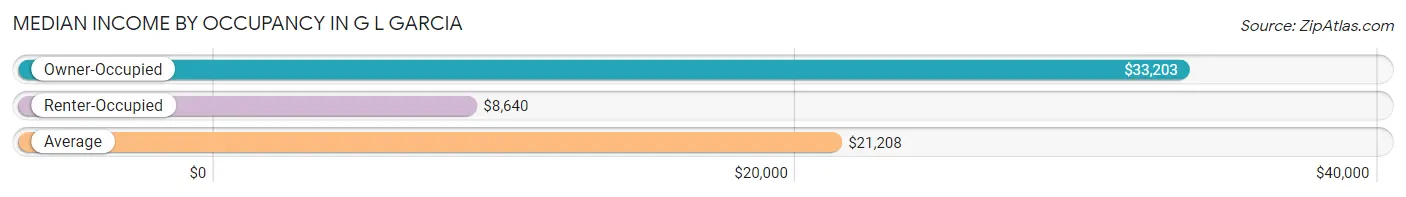
| Occupancy Type | # Households | Median Income |
| Owner-Occupied | 308 (58.9%) | $33,203 |
| Renter-Occupied | 215 (41.1%) | $8,640 |
| Average | 523 (100.0%) | $21,208 |
Occupancy by Householder Income Bracket in G L Garcia
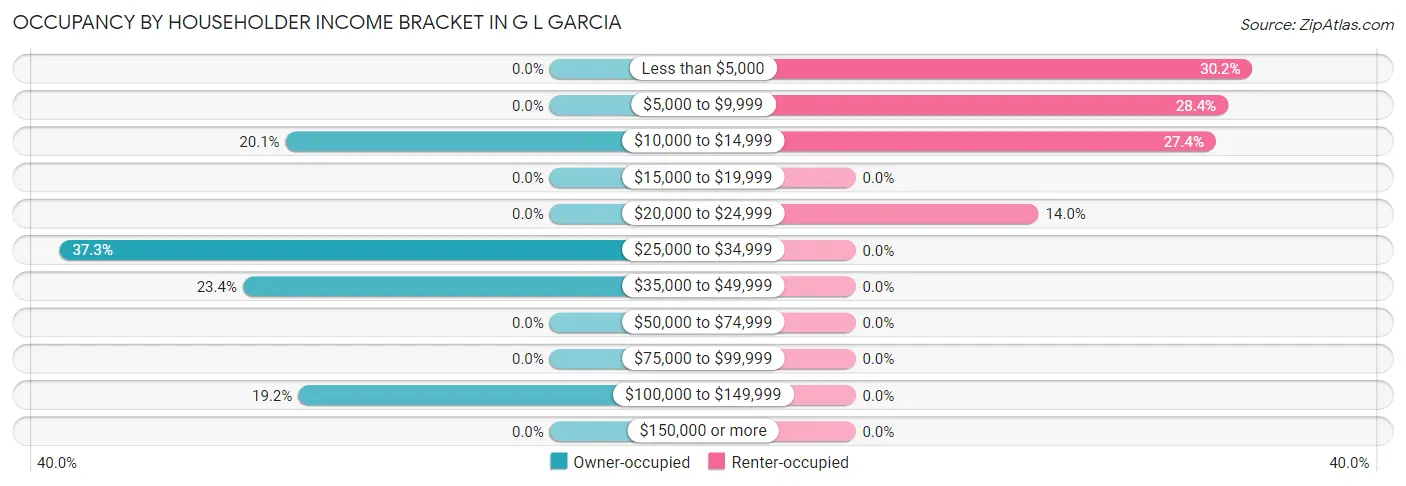
| Income Bracket | Owner-occupied | Renter-occupied |
| Less than $5,000 | 0 (0.0%) | 65 (30.2%) |
| $5,000 to $9,999 | 0 (0.0%) | 61 (28.4%) |
| $10,000 to $14,999 | 62 (20.1%) | 59 (27.4%) |
| $15,000 to $19,999 | 0 (0.0%) | 0 (0.0%) |
| $20,000 to $24,999 | 0 (0.0%) | 30 (14.0%) |
| $25,000 to $34,999 | 115 (37.3%) | 0 (0.0%) |
| $35,000 to $49,999 | 72 (23.4%) | 0 (0.0%) |
| $50,000 to $74,999 | 0 (0.0%) | 0 (0.0%) |
| $75,000 to $99,999 | 0 (0.0%) | 0 (0.0%) |
| $100,000 to $149,999 | 59 (19.2%) | 0 (0.0%) |
| $150,000 or more | 0 (0.0%) | 0 (0.0%) |
| Total | 308 (100.0%) | 215 (100.0%) |
Monthly Housing Cost Tiers in G L Garcia
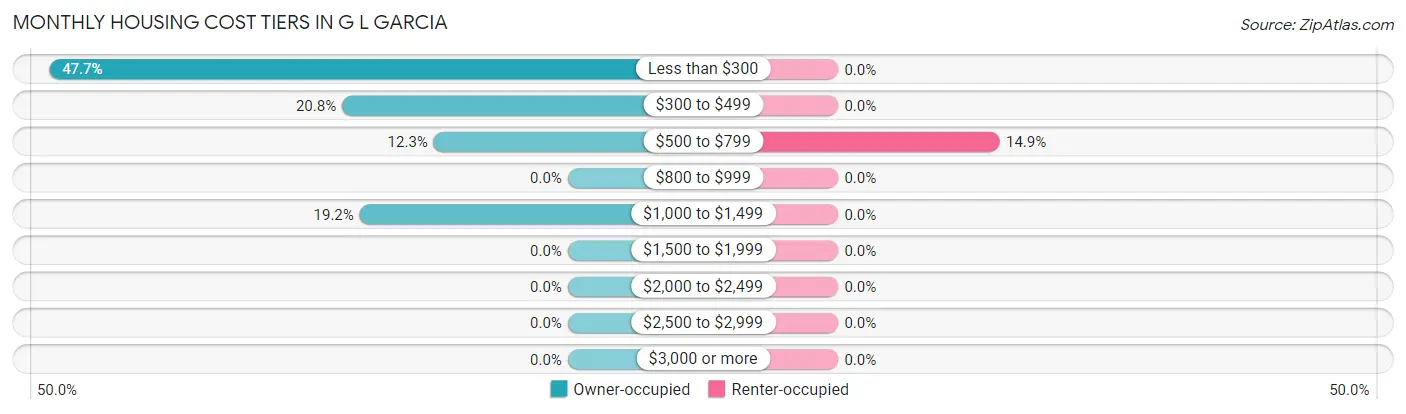
| Monthly Cost | Owner-occupied | Renter-occupied |
| Less than $300 | 147 (47.7%) | 0 (0.0%) |
| $300 to $499 | 64 (20.8%) | 0 (0.0%) |
| $500 to $799 | 38 (12.3%) | 32 (14.9%) |
| $800 to $999 | 0 (0.0%) | 0 (0.0%) |
| $1,000 to $1,499 | 59 (19.2%) | 0 (0.0%) |
| $1,500 to $1,999 | 0 (0.0%) | 0 (0.0%) |
| $2,000 to $2,499 | 0 (0.0%) | 0 (0.0%) |
| $2,500 to $2,999 | 0 (0.0%) | 0 (0.0%) |
| $3,000 or more | 0 (0.0%) | 0 (0.0%) |
| Total | 308 (100.0%) | 215 (100.0%) |
Physical Housing Characteristics in G L Garcia
Housing Structures in G L Garcia
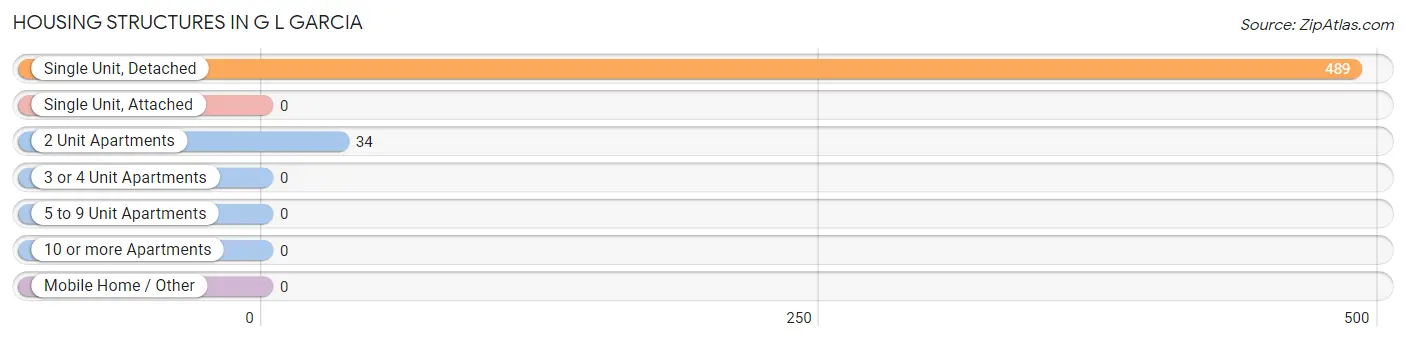
| Structure Type | # Housing Units | % Housing Units |
| Single Unit, Detached | 489 | 93.5% |
| Single Unit, Attached | 0 | 0.0% |
| 2 Unit Apartments | 34 | 6.5% |
| 3 or 4 Unit Apartments | 0 | 0.0% |
| 5 to 9 Unit Apartments | 0 | 0.0% |
| 10 or more Apartments | 0 | 0.0% |
| Mobile Home / Other | 0 | 0.0% |
| Total | 523 | 100.0% |
Housing Structures by Occupancy in G L Garcia
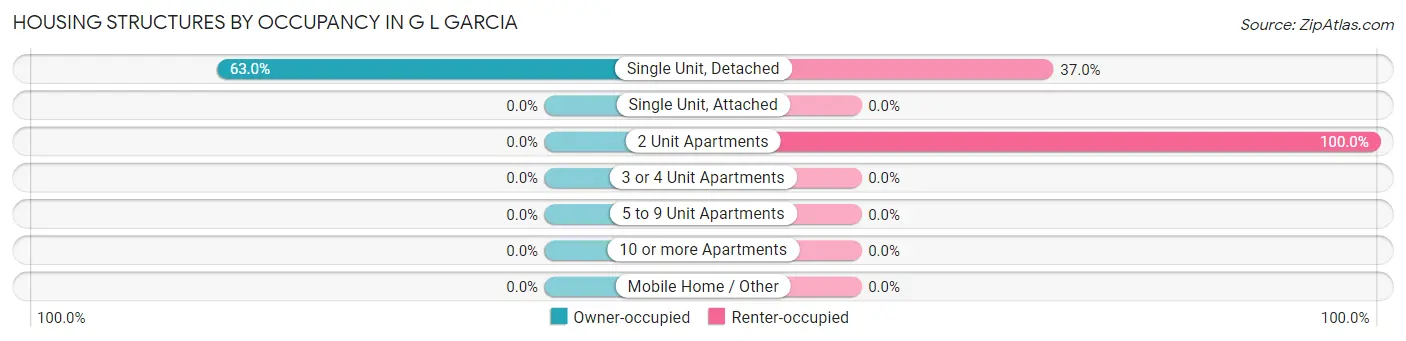
| Structure Type | Owner-occupied | Renter-occupied |
| Single Unit, Detached | 308 (63.0%) | 181 (37.0%) |
| Single Unit, Attached | 0 (0.0%) | 0 (0.0%) |
| 2 Unit Apartments | 0 (0.0%) | 34 (100.0%) |
| 3 or 4 Unit Apartments | 0 (0.0%) | 0 (0.0%) |
| 5 to 9 Unit Apartments | 0 (0.0%) | 0 (0.0%) |
| 10 or more Apartments | 0 (0.0%) | 0 (0.0%) |
| Mobile Home / Other | 0 (0.0%) | 0 (0.0%) |
| Total | 308 (58.9%) | 215 (41.1%) |
Housing Structures by Number of Rooms in G L Garcia
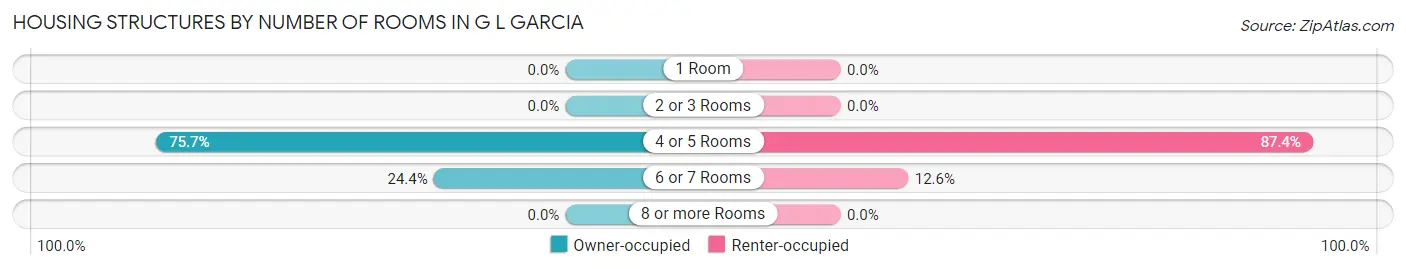
| Number of Rooms | Owner-occupied | Renter-occupied |
| 1 Room | 0 (0.0%) | 0 (0.0%) |
| 2 or 3 Rooms | 0 (0.0%) | 0 (0.0%) |
| 4 or 5 Rooms | 233 (75.6%) | 188 (87.4%) |
| 6 or 7 Rooms | 75 (24.3%) | 27 (12.6%) |
| 8 or more Rooms | 0 (0.0%) | 0 (0.0%) |
| Total | 308 (100.0%) | 215 (100.0%) |
Housing Structure by Heating Type in G L Garcia
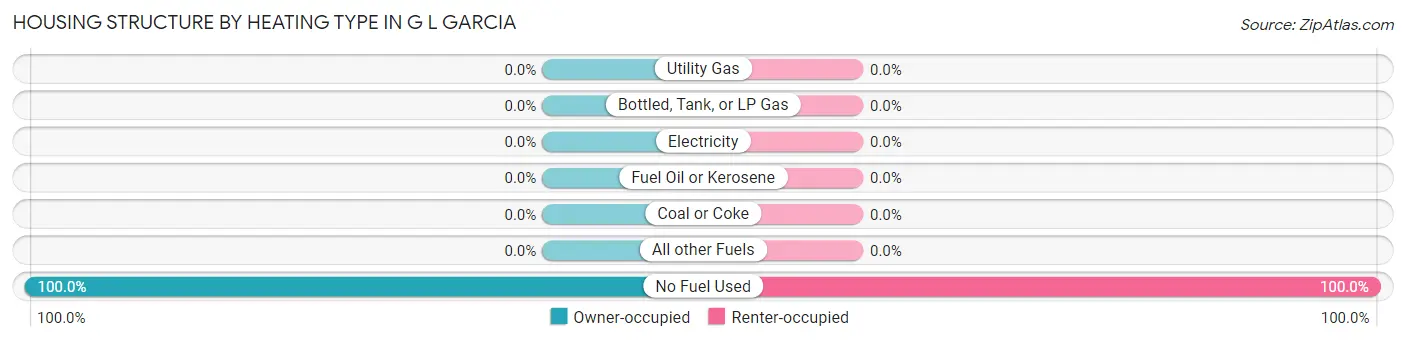
| Heating Type | Owner-occupied | Renter-occupied |
| Utility Gas | 0 (0.0%) | 0 (0.0%) |
| Bottled, Tank, or LP Gas | 0 (0.0%) | 0 (0.0%) |
| Electricity | 0 (0.0%) | 0 (0.0%) |
| Fuel Oil or Kerosene | 0 (0.0%) | 0 (0.0%) |
| Coal or Coke | 0 (0.0%) | 0 (0.0%) |
| All other Fuels | 0 (0.0%) | 0 (0.0%) |
| No Fuel Used | 308 (100.0%) | 215 (100.0%) |
| Total | 308 (100.0%) | 215 (100.0%) |
Household Vehicle Usage in G L Garcia
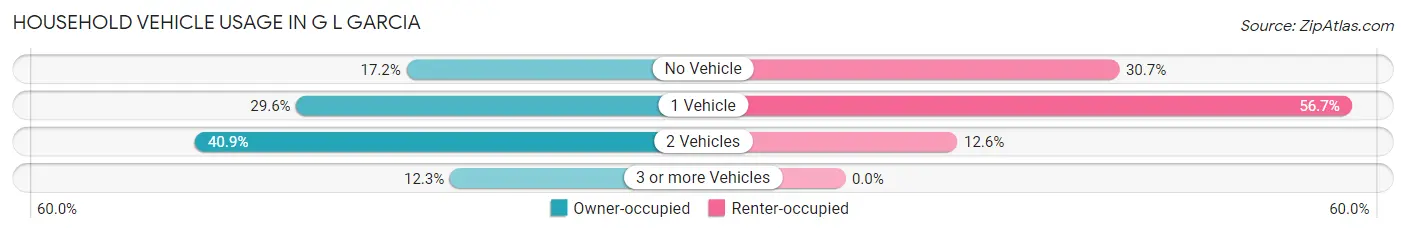
| Vehicles per Household | Owner-occupied | Renter-occupied |
| No Vehicle | 53 (17.2%) | 66 (30.7%) |
| 1 Vehicle | 91 (29.5%) | 122 (56.7%) |
| 2 Vehicles | 126 (40.9%) | 27 (12.6%) |
| 3 or more Vehicles | 38 (12.3%) | 0 (0.0%) |
| Total | 308 (100.0%) | 215 (100.0%) |
Real Estate & Mortgages in G L Garcia
Real Estate and Mortgage Overview in G L Garcia
| Characteristic | Without Mortgage | With Mortgage |
| Housing Units | 179 | 129 |
| Median Property Value | $79,900 | $146,400 |
| Median Household Income | $33,633 | $0 |
| Monthly Housing Costs | $124 | $0 |
| Real Estate Taxes | - | - |
Property Value by Mortgage Status in G L Garcia
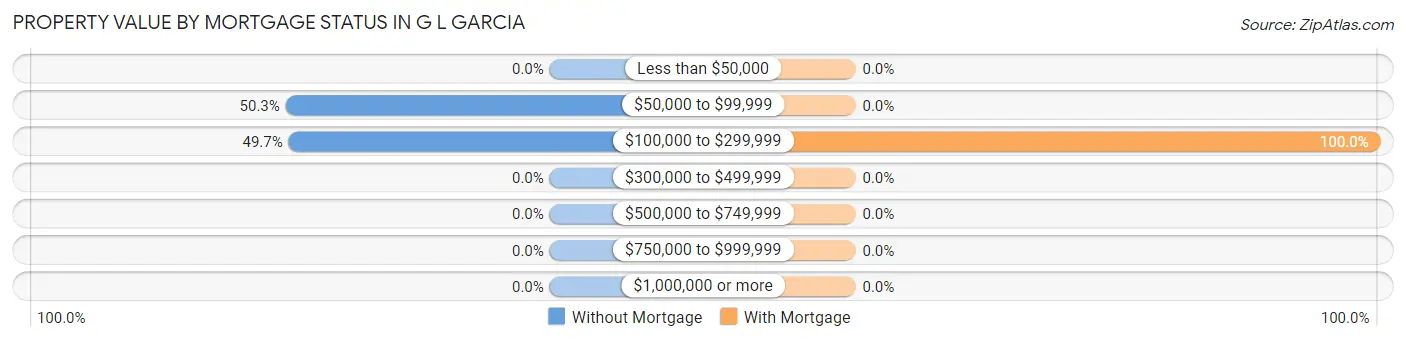
| Property Value | Without Mortgage | With Mortgage |
| Less than $50,000 | 0 (0.0%) | 0 (0.0%) |
| $50,000 to $99,999 | 90 (50.3%) | 0 (0.0%) |
| $100,000 to $299,999 | 89 (49.7%) | 129 (100.0%) |
| $300,000 to $499,999 | 0 (0.0%) | 0 (0.0%) |
| $500,000 to $749,999 | 0 (0.0%) | 0 (0.0%) |
| $750,000 to $999,999 | 0 (0.0%) | 0 (0.0%) |
| $1,000,000 or more | 0 (0.0%) | 0 (0.0%) |
| Total | 179 (100.0%) | 129 (100.0%) |
Household Income by Mortgage Status in G L Garcia
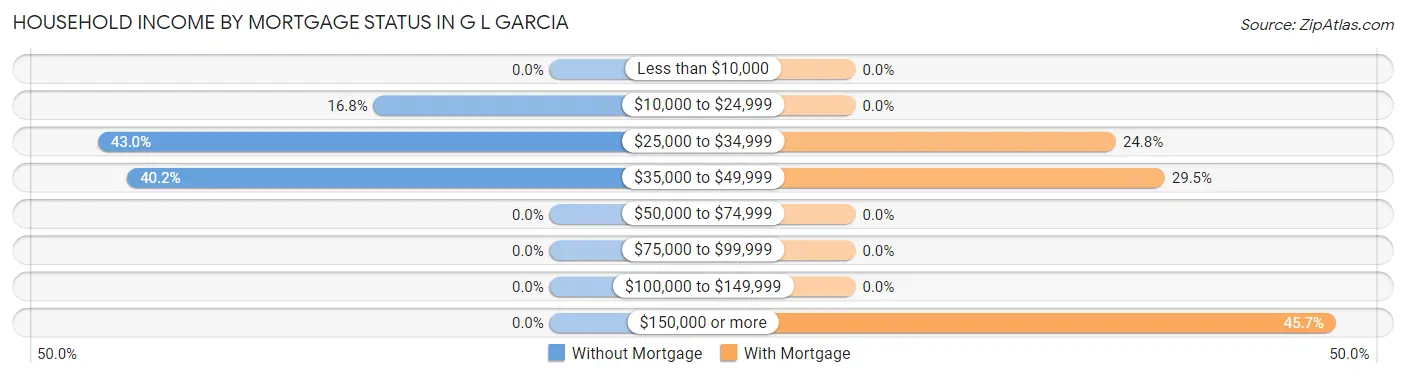
| Household Income | Without Mortgage | With Mortgage |
| Less than $10,000 | 0 (0.0%) | 0 (0.0%) |
| $10,000 to $24,999 | 30 (16.8%) | 0 (0.0%) |
| $25,000 to $34,999 | 77 (43.0%) | 32 (24.8%) |
| $35,000 to $49,999 | 72 (40.2%) | 38 (29.5%) |
| $50,000 to $74,999 | 0 (0.0%) | 0 (0.0%) |
| $75,000 to $99,999 | 0 (0.0%) | 0 (0.0%) |
| $100,000 to $149,999 | 0 (0.0%) | 0 (0.0%) |
| $150,000 or more | 0 (0.0%) | 59 (45.7%) |
| Total | 179 (100.0%) | 129 (100.0%) |
Property Value to Household Income Ratio in G L Garcia
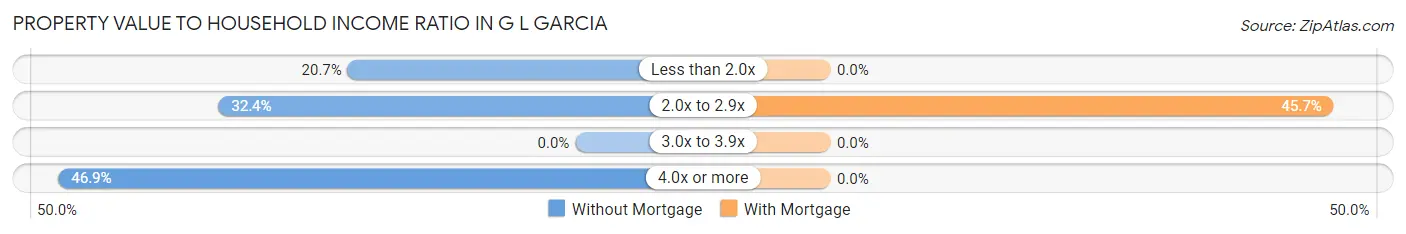
| Value-to-Income Ratio | Without Mortgage | With Mortgage |
| Less than 2.0x | 37 (20.7%) | 0 (0.0%) |
| 2.0x to 2.9x | 58 (32.4%) | 59 (45.7%) |
| 3.0x to 3.9x | 0 (0.0%) | 0 (0.0%) |
| 4.0x or more | 84 (46.9%) | 0 (0.0%) |
| Total | 179 (100.0%) | 129 (100.0%) |
Real Estate Taxes by Mortgage Status in G L Garcia
| Property Taxes | Without Mortgage | With Mortgage |
| Less than $800 | 0 (0.0%) | 0 (0.0%) |
| $800 to $1,499 | 0 (0.0%) | 0 (0.0%) |
| $800 to $1,499 | 0 (0.0%) | 0 (0.0%) |
| Total | 179 (100.0%) | 129 (100.0%) |
Health & Disability in G L Garcia
Health Insurance Coverage by Age in G L Garcia
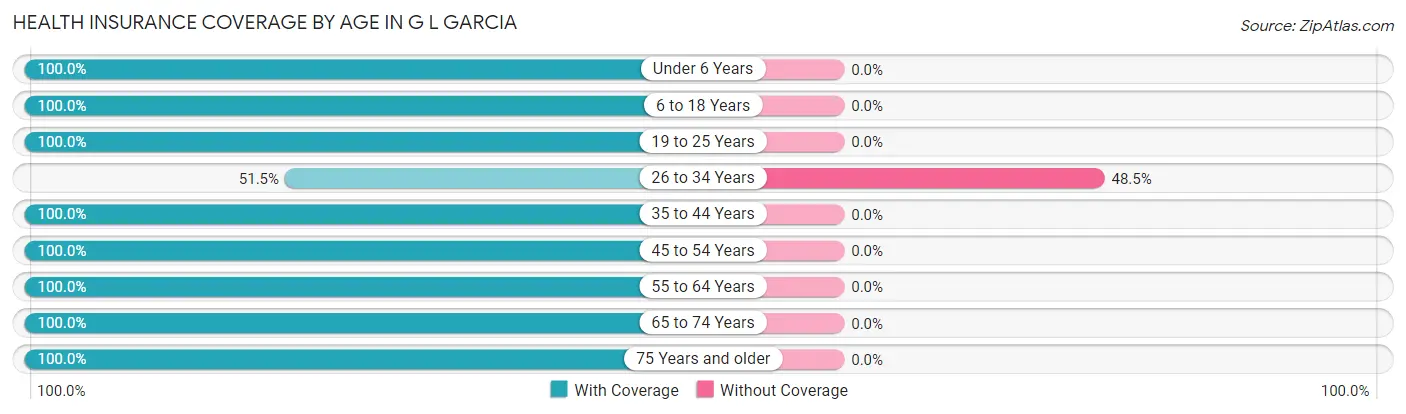
| Age Bracket | With Coverage | Without Coverage |
| Under 6 Years | 38 (100.0%) | 0 (0.0%) |
| 6 to 18 Years | 195 (100.0%) | 0 (0.0%) |
| 19 to 25 Years | 41 (100.0%) | 0 (0.0%) |
| 26 to 34 Years | 35 (51.5%) | 33 (48.5%) |
| 35 to 44 Years | 168 (100.0%) | 0 (0.0%) |
| 45 to 54 Years | 94 (100.0%) | 0 (0.0%) |
| 55 to 64 Years | 356 (100.0%) | 0 (0.0%) |
| 65 to 74 Years | 192 (100.0%) | 0 (0.0%) |
| 75 Years and older | 101 (100.0%) | 0 (0.0%) |
| Total | 1,220 (97.4%) | 33 (2.6%) |
Health Insurance Coverage by Citizenship Status in G L Garcia
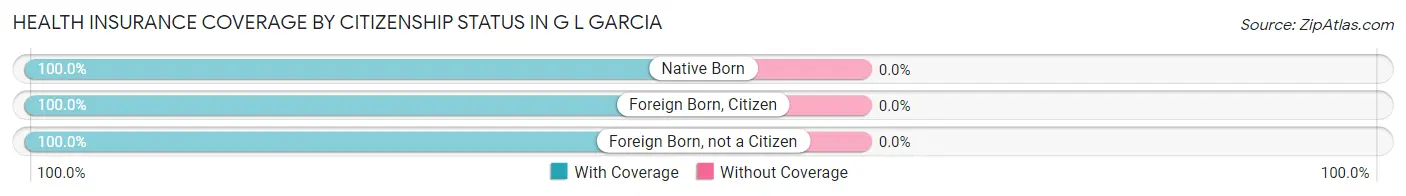
| Citizenship Status | With Coverage | Without Coverage |
| Native Born | 38 (100.0%) | 0 (0.0%) |
| Foreign Born, Citizen | 195 (100.0%) | 0 (0.0%) |
| Foreign Born, not a Citizen | 41 (100.0%) | 0 (0.0%) |
Health Insurance Coverage by Household Income in G L Garcia
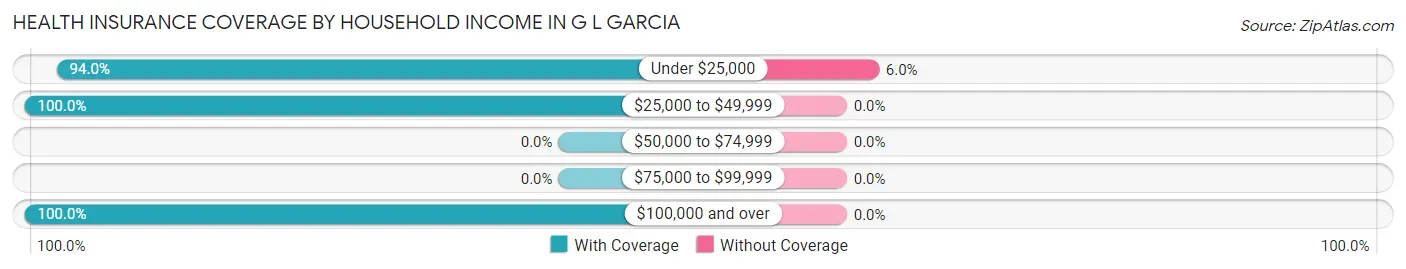
| Household Income | With Coverage | Without Coverage |
| Under $25,000 | 516 (94.0%) | 33 (6.0%) |
| $25,000 to $49,999 | 530 (100.0%) | 0 (0.0%) |
| $50,000 to $74,999 | 0 (0.0%) | 0 (0.0%) |
| $75,000 to $99,999 | 0 (0.0%) | 0 (0.0%) |
| $100,000 and over | 174 (100.0%) | 0 (0.0%) |
Public vs Private Health Insurance Coverage by Age in G L Garcia
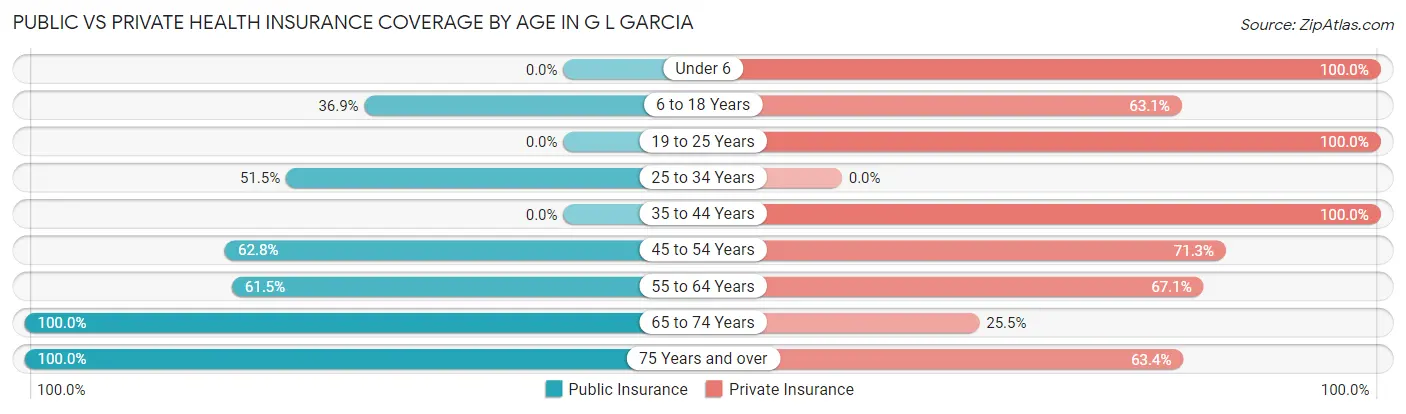
| Age Bracket | Public Insurance | Private Insurance |
| Under 6 | 0 (0.0%) | 38 (100.0%) |
| 6 to 18 Years | 72 (36.9%) | 123 (63.1%) |
| 19 to 25 Years | 0 (0.0%) | 41 (100.0%) |
| 25 to 34 Years | 35 (51.5%) | 0 (0.0%) |
| 35 to 44 Years | 0 (0.0%) | 168 (100.0%) |
| 45 to 54 Years | 59 (62.8%) | 67 (71.3%) |
| 55 to 64 Years | 219 (61.5%) | 239 (67.1%) |
| 65 to 74 Years | 192 (100.0%) | 49 (25.5%) |
| 75 Years and over | 101 (100.0%) | 64 (63.4%) |
| Total | 678 (54.1%) | 789 (63.0%) |
Disability Status by Sex by Age in G L Garcia
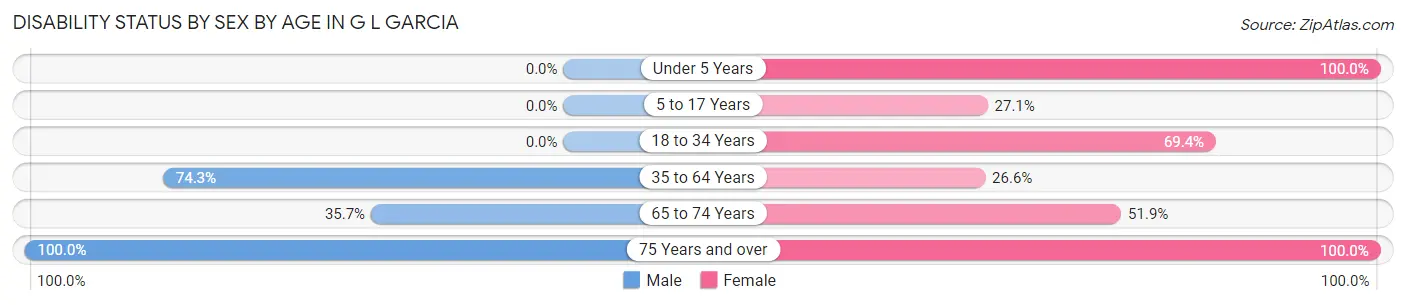
| Age Bracket | Male | Female |
| Under 5 Years | 0 (0.0%) | 38 (100.0%) |
| 5 to 17 Years | 0 (0.0%) | 36 (27.1%) |
| 18 to 34 Years | 0 (0.0%) | 75 (69.4%) |
| 35 to 64 Years | 194 (74.3%) | 95 (26.6%) |
| 65 to 74 Years | 30 (35.7%) | 56 (51.8%) |
| 75 Years and over | 71 (100.0%) | 30 (100.0%) |
Disability Class by Sex by Age in G L Garcia
Disability Class: Hearing Difficulty
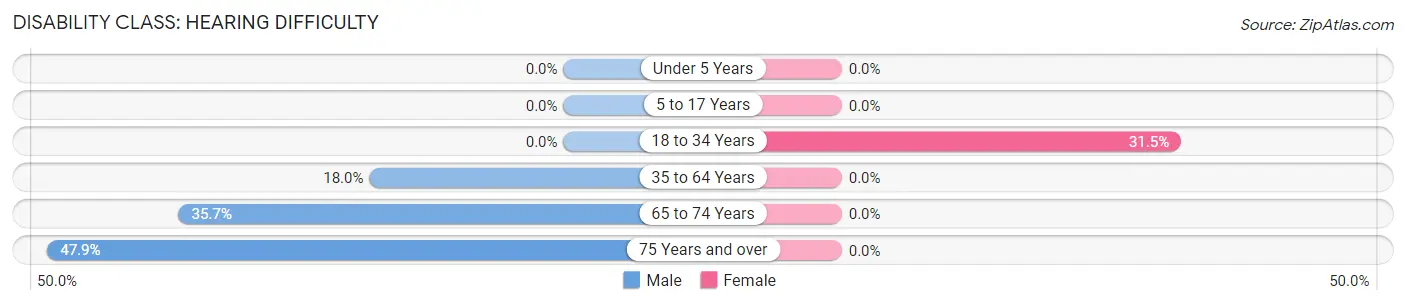
| Age Bracket | Male | Female |
| Under 5 Years | 0 (0.0%) | 0 (0.0%) |
| 5 to 17 Years | 0 (0.0%) | 0 (0.0%) |
| 18 to 34 Years | 0 (0.0%) | 34 (31.5%) |
| 35 to 64 Years | 47 (18.0%) | 0 (0.0%) |
| 65 to 74 Years | 30 (35.7%) | 0 (0.0%) |
| 75 Years and over | 34 (47.9%) | 0 (0.0%) |
Disability Class: Vision Difficulty
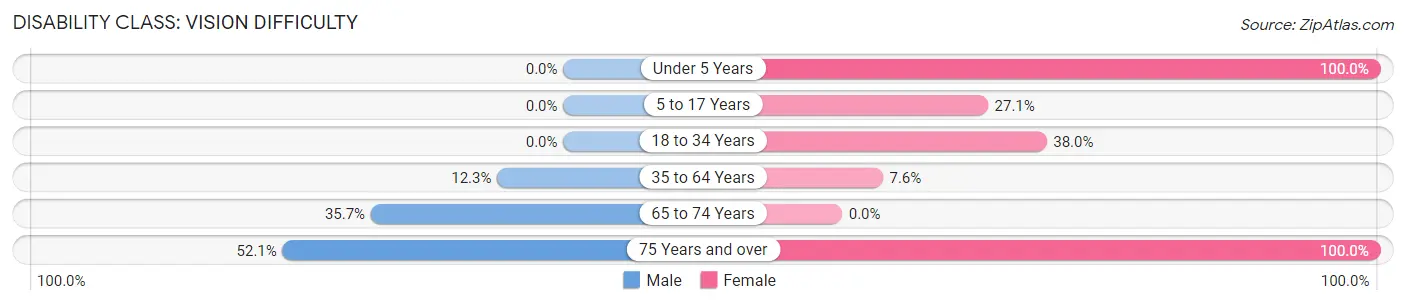
| Age Bracket | Male | Female |
| Under 5 Years | 0 (0.0%) | 38 (100.0%) |
| 5 to 17 Years | 0 (0.0%) | 36 (27.1%) |
| 18 to 34 Years | 0 (0.0%) | 41 (38.0%) |
| 35 to 64 Years | 32 (12.3%) | 27 (7.6%) |
| 65 to 74 Years | 30 (35.7%) | 0 (0.0%) |
| 75 Years and over | 37 (52.1%) | 30 (100.0%) |
Disability Class: Cognitive Difficulty
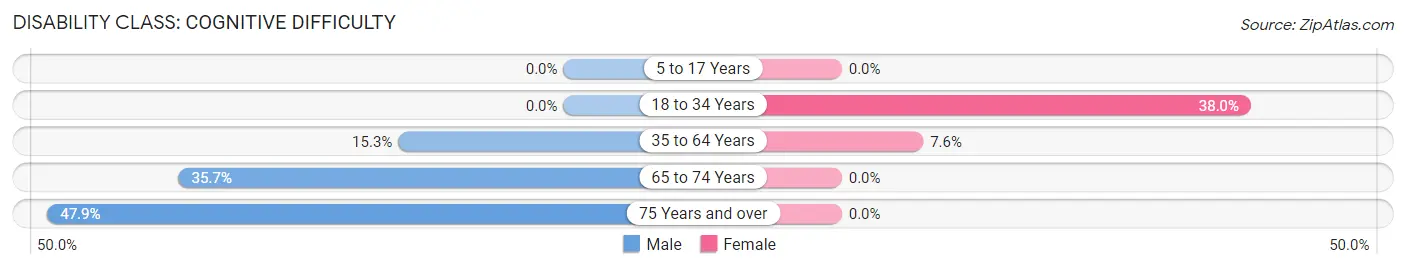
| Age Bracket | Male | Female |
| 5 to 17 Years | 0 (0.0%) | 0 (0.0%) |
| 18 to 34 Years | 0 (0.0%) | 41 (38.0%) |
| 35 to 64 Years | 40 (15.3%) | 27 (7.6%) |
| 65 to 74 Years | 30 (35.7%) | 0 (0.0%) |
| 75 Years and over | 34 (47.9%) | 0 (0.0%) |
Disability Class: Ambulatory Difficulty
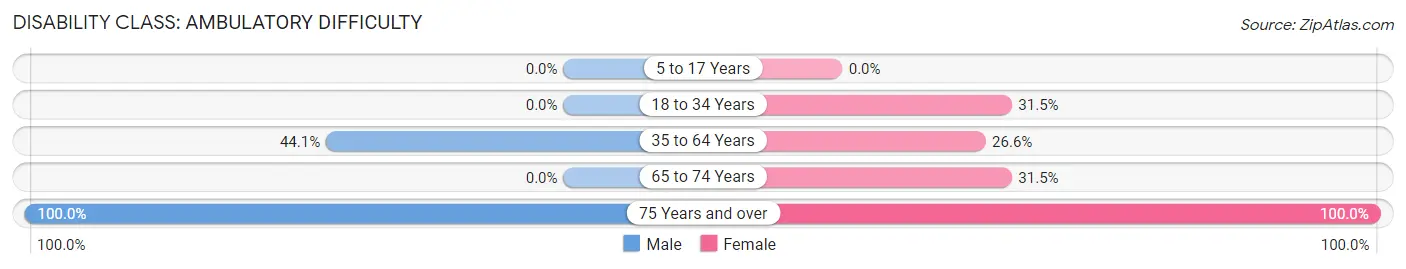
| Age Bracket | Male | Female |
| 5 to 17 Years | 0 (0.0%) | 0 (0.0%) |
| 18 to 34 Years | 0 (0.0%) | 34 (31.5%) |
| 35 to 64 Years | 115 (44.1%) | 95 (26.6%) |
| 65 to 74 Years | 0 (0.0%) | 34 (31.5%) |
| 75 Years and over | 71 (100.0%) | 30 (100.0%) |
Disability Class: Self-Care Difficulty
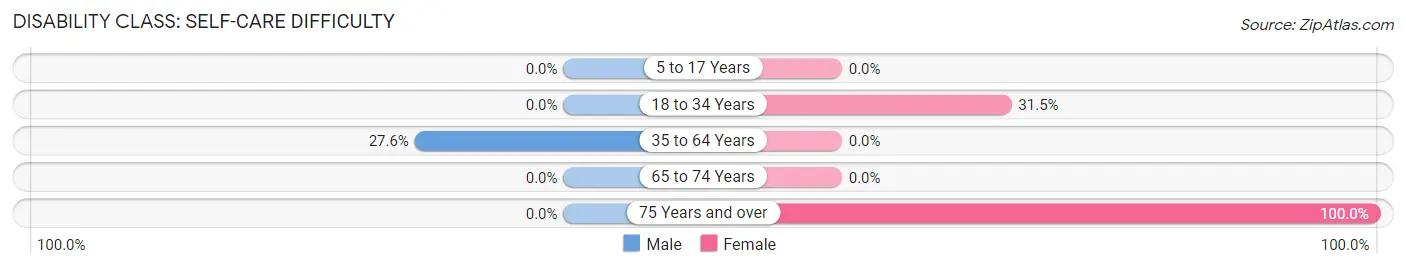
| Age Bracket | Male | Female |
| 5 to 17 Years | 0 (0.0%) | 0 (0.0%) |
| 18 to 34 Years | 0 (0.0%) | 34 (31.5%) |
| 35 to 64 Years | 72 (27.6%) | 0 (0.0%) |
| 65 to 74 Years | 0 (0.0%) | 0 (0.0%) |
| 75 Years and over | 0 (0.0%) | 30 (100.0%) |
Technology Access in G L Garcia
Computing Device Access in G L Garcia
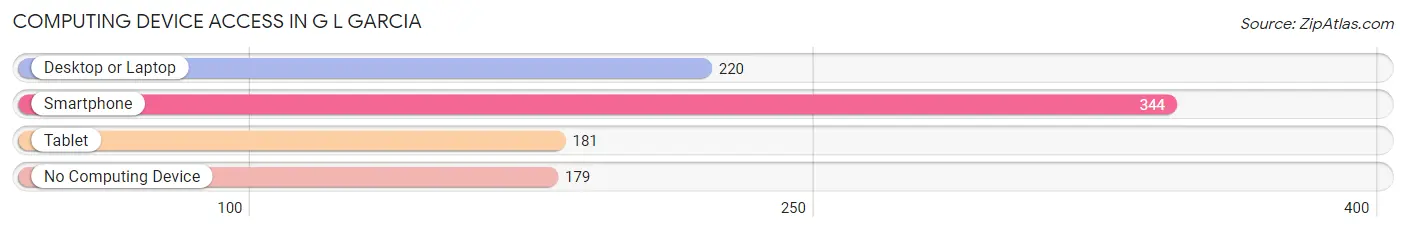
| Device Type | # Households | % Households |
| Desktop or Laptop | 220 | 42.1% |
| Smartphone | 344 | 65.8% |
| Tablet | 181 | 34.6% |
| No Computing Device | 179 | 34.2% |
| Total | 523 | 100.0% |
Internet Access in G L Garcia
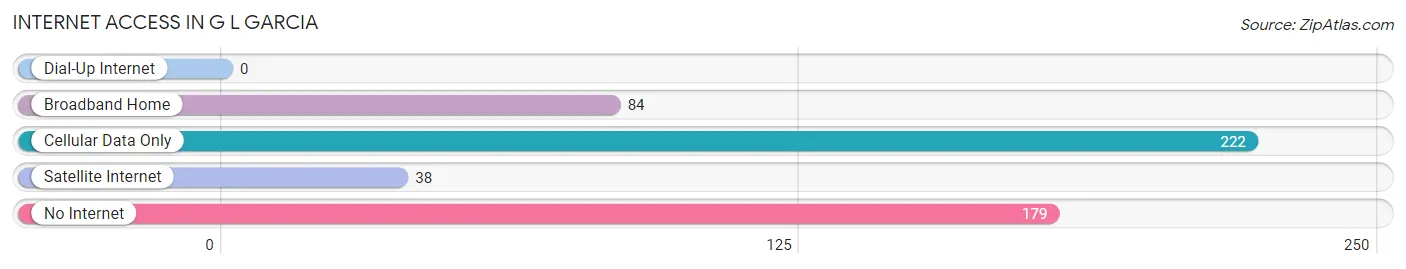
| Internet Type | # Households | % Households |
| Dial-Up Internet | 0 | 0.0% |
| Broadband Home | 84 | 16.1% |
| Cellular Data Only | 222 | 42.4% |
| Satellite Internet | 38 | 7.3% |
| No Internet | 179 | 34.2% |
| Total | 523 | 100.0% |
G L Garcia Summary
Puerto Rico is an unincorporated territory of the United States located in the northeastern Caribbean Sea. It is an archipelago that includes the main island of Puerto Rico and several smaller islands, such as Vieques, Culebra, and Mona. The total land area of Puerto Rico is 3,515 square miles, making it the third-largest island in the United States after Hawaii and Alaska. Puerto Rico is home to approximately 3.2 million people, making it the second-most populous island in the United States after Long Island.
History
Puerto Rico has a long and complex history. The island was originally inhabited by the Taíno people, who were later displaced by the Spanish when they arrived in the late 15th century. The Spanish established a colony on the island and began to import African slaves to work on the plantations. Puerto Rico remained a Spanish colony until 1898, when it was ceded to the United States as part of the Treaty of Paris.
In 1917, the Jones-Shafroth Act granted U.S. citizenship to all Puerto Ricans. In 1952, Puerto Rico became an unincorporated territory of the United States, and in 1976, the island was granted limited self-government. In 2017, Puerto Rico was devastated by Hurricane Maria, which caused widespread destruction and loss of life.
Geography
Puerto Rico is located in the northeastern Caribbean Sea, east of the Dominican Republic and west of the Virgin Islands. The main island of Puerto Rico is approximately 100 miles long and 35 miles wide. It is surrounded by smaller islands, including Vieques, Culebra, and Mona. The terrain of Puerto Rico is mostly mountainous, with the highest point being Cerro de Punta at 4,390 feet. The climate of Puerto Rico is tropical, with temperatures ranging from the mid-70s to the mid-80s Fahrenheit.
Economy
Puerto Rico has a mixed economy, with a large public sector and a smaller private sector. The island’s main industries are tourism, pharmaceuticals, and manufacturing. The government of Puerto Rico is the largest employer on the island, followed by the pharmaceutical industry. The island’s main exports are chemicals, electronics, and medical equipment.
Demographics
Puerto Rico is home to approximately 3.2 million people, making it the second-most populous island in the United States after Long Island. The population of Puerto Rico is predominantly of Hispanic or Latino origin, with approximately 75% of the population identifying as such. The island also has a significant African-American population, as well as smaller populations of other ethnicities, including White, Asian, and Native American. The official language of Puerto Rico is Spanish, although English is also widely spoken. The majority of the population is Roman Catholic, although there are also smaller populations of other religious groups, including Protestants, Jews, and Muslims.
Common Questions
What is Per Capita Income in G L Garcia?
Per Capita income in G L Garcia is $16,907.
What is the Median Family Income in G L Garcia?
Median Family Income in G L Garcia is $30,123.
What is the Median Household income in G L Garcia?
Median Household Income in G L Garcia is $21,208.
What is Inequality or Gini Index in G L Garcia?
Inequality or Gini Index in G L Garcia is 0.52.
What is the Total Population of G L Garcia?
Total Population of G L Garcia is 1,312.
What is the Total Male Population of G L Garcia?
Total Male Population of G L Garcia is 538.
What is the Total Female Population of G L Garcia?
Total Female Population of G L Garcia is 774.
What is the Ratio of Males per 100 Females in G L Garcia?
There are 69.51 Males per 100 Females in G L Garcia.
What is the Ratio of Females per 100 Males in G L Garcia?
There are 143.87 Females per 100 Males in G L Garcia.
What is the Median Population Age in G L Garcia?
Median Population Age in G L Garcia is 54.9 Years.
What is the Average Family Size in G L Garcia
Average Family Size in G L Garcia is 3.0 People.
What is the Average Household Size in G L Garcia
Average Household Size in G L Garcia is 2.5 People.
How Large is the Labor Force in G L Garcia?
There are 214 People in the Labor Forcein in G L Garcia.
What is the Percentage of People in the Labor Force in G L Garcia?
19.2% of People are in the Labor Force in G L Garcia.