El Ojo, PR Map & Demographics
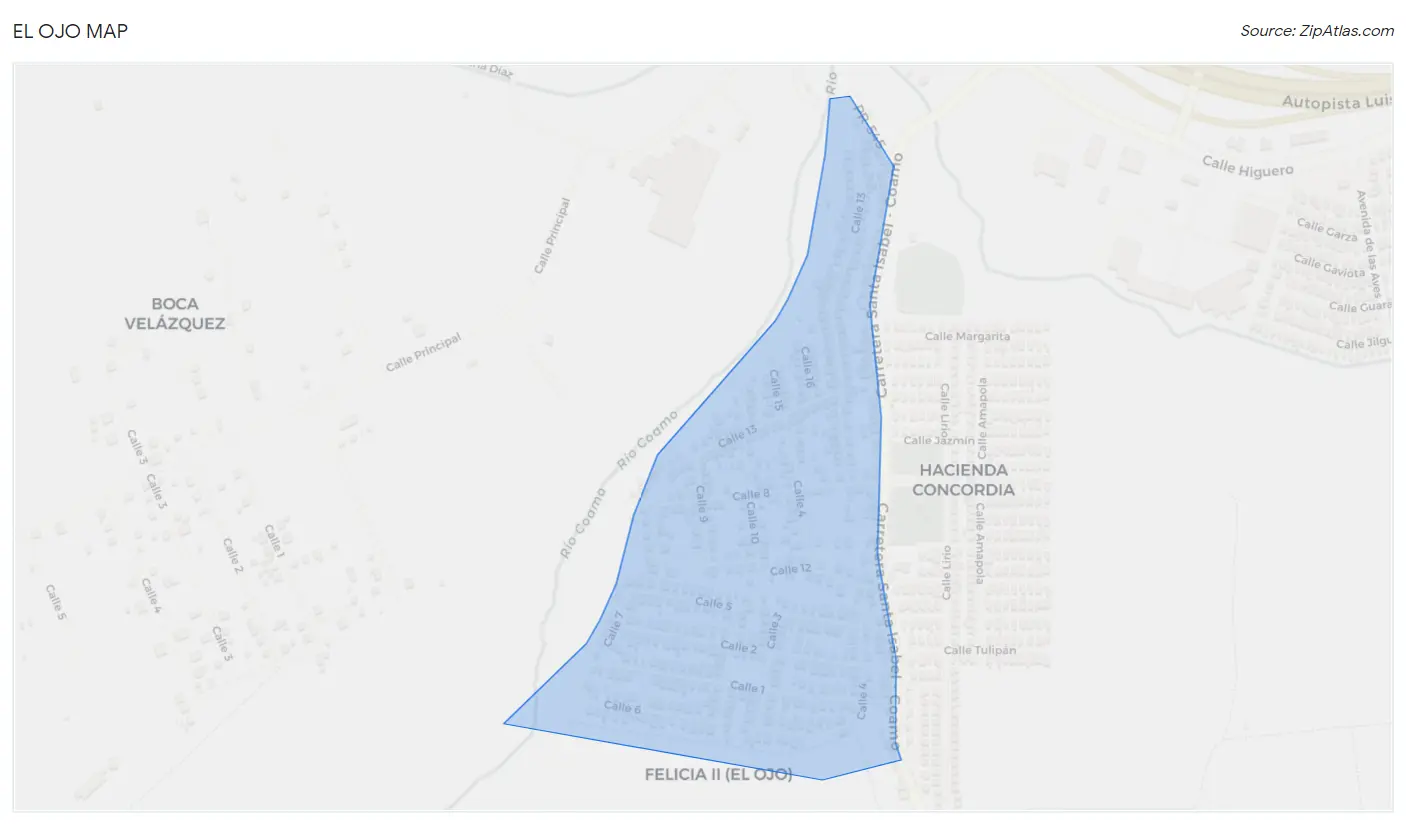
El Ojo Map
El Ojo Overview
$8,819
PER CAPITA INCOME
$30,222
AVG FAMILY INCOME
$24,886
AVG HOUSEHOLD INCOME
0.34
INEQUALITY / GINI INDEX
1,751
TOTAL POPULATION
782
MALE POPULATION
969
FEMALE POPULATION
80.70
MALES / 100 FEMALES
123.91
FEMALES / 100 MALES
48.9
MEDIAN AGE
4.7
AVG FAMILY SIZE
3.2
AVG HOUSEHOLD SIZE
669
LABOR FORCE [ PEOPLE ]
39.7%
PERCENT IN LABOR FORCE
Income in El Ojo
Income Overview in El Ojo
Per Capita Income in El Ojo is $8,819, while median incomes of families and households are $30,222 and $24,886 respectively.
| Characteristic | Number | Measure |
| Per Capita Income | 1,751 | $8,819 |
| Median Family Income | 274 | $30,222 |
| Mean Family Income | 274 | $29,287 |
| Median Household Income | 554 | $24,886 |
| Mean Household Income | 554 | $24,165 |
| Income Deficit | 274 | $0 |
| Wage / Income Gap (%) | 1,751 | 0.00% |
| Wage / Income Gap ($) | 1,751 | 100.00¢ per $1 |
| Gini / Inequality Index | 1,751 | 0.34 |
Earnings by Sex in El Ojo
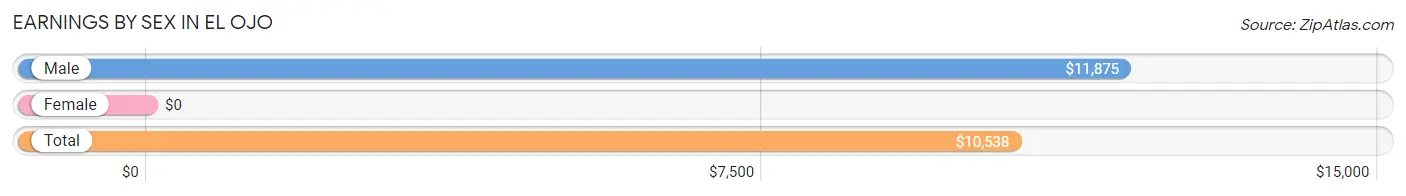
| Sex | Number | Average Earnings |
| Male | 470 (70.3%) | $11,875 |
| Female | 199 (29.7%) | $0 |
| Total | 669 (100.0%) | $10,538 |
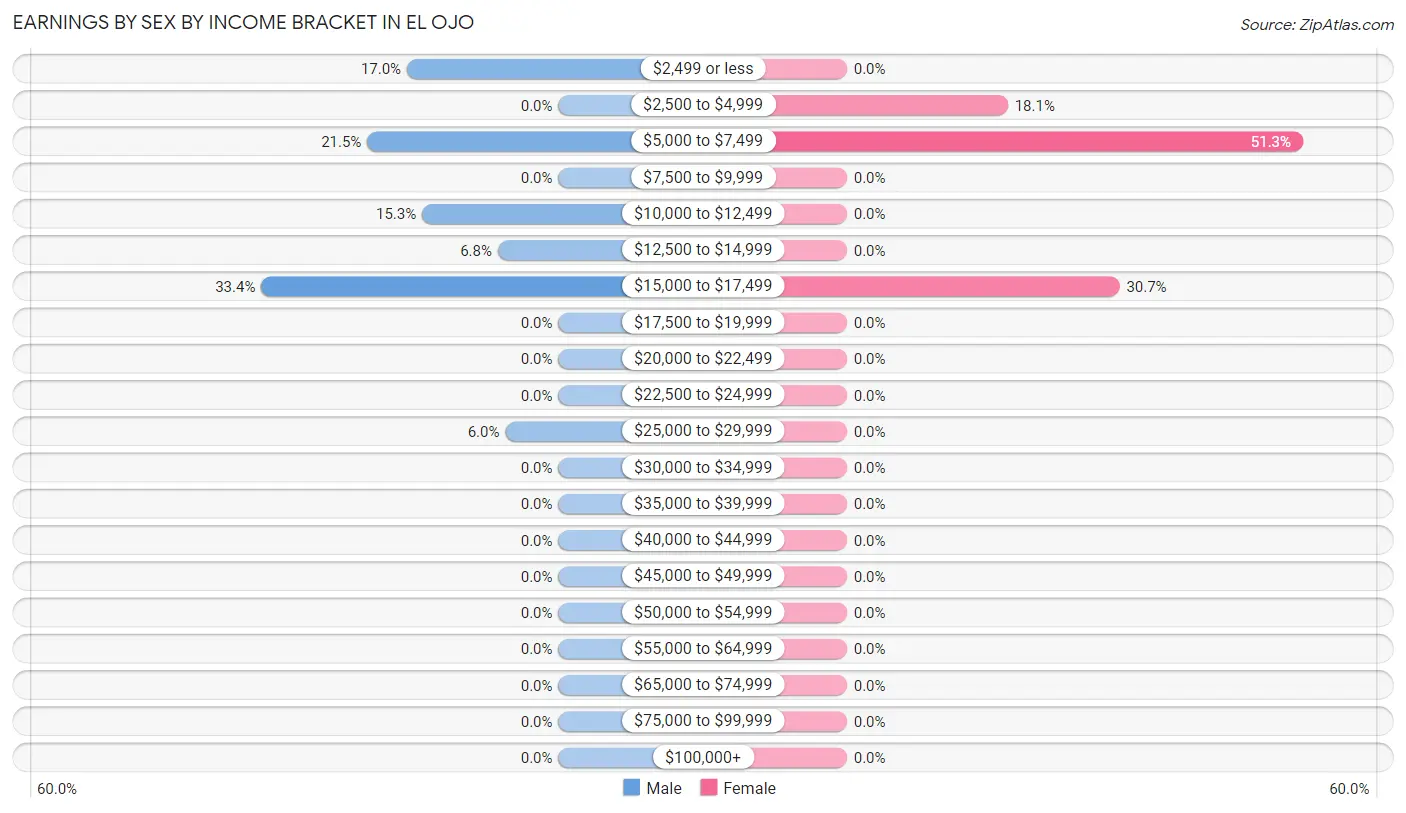
Earnings by Sex by Income Bracket in El Ojo
The most common earnings brackets in El Ojo are $15,000 to $17,499 for men (157 | 33.4%) and $5,000 to $7,499 for women (102 | 51.3%).
| Income | Male | Female |
| $2,499 or less | 80 (17.0%) | 0 (0.0%) |
| $2,500 to $4,999 | 0 (0.0%) | 36 (18.1%) |
| $5,000 to $7,499 | 101 (21.5%) | 102 (51.3%) |
| $7,500 to $9,999 | 0 (0.0%) | 0 (0.0%) |
| $10,000 to $12,499 | 72 (15.3%) | 0 (0.0%) |
| $12,500 to $14,999 | 32 (6.8%) | 0 (0.0%) |
| $15,000 to $17,499 | 157 (33.4%) | 61 (30.6%) |
| $17,500 to $19,999 | 0 (0.0%) | 0 (0.0%) |
| $20,000 to $22,499 | 0 (0.0%) | 0 (0.0%) |
| $22,500 to $24,999 | 0 (0.0%) | 0 (0.0%) |
| $25,000 to $29,999 | 28 (6.0%) | 0 (0.0%) |
| $30,000 to $34,999 | 0 (0.0%) | 0 (0.0%) |
| $35,000 to $39,999 | 0 (0.0%) | 0 (0.0%) |
| $40,000 to $44,999 | 0 (0.0%) | 0 (0.0%) |
| $45,000 to $49,999 | 0 (0.0%) | 0 (0.0%) |
| $50,000 to $54,999 | 0 (0.0%) | 0 (0.0%) |
| $55,000 to $64,999 | 0 (0.0%) | 0 (0.0%) |
| $65,000 to $74,999 | 0 (0.0%) | 0 (0.0%) |
| $75,000 to $99,999 | 0 (0.0%) | 0 (0.0%) |
| $100,000+ | 0 (0.0%) | 0 (0.0%) |
| Total | 470 (100.0%) | 199 (100.0%) |
Earnings by Sex by Educational Attainment in El Ojo
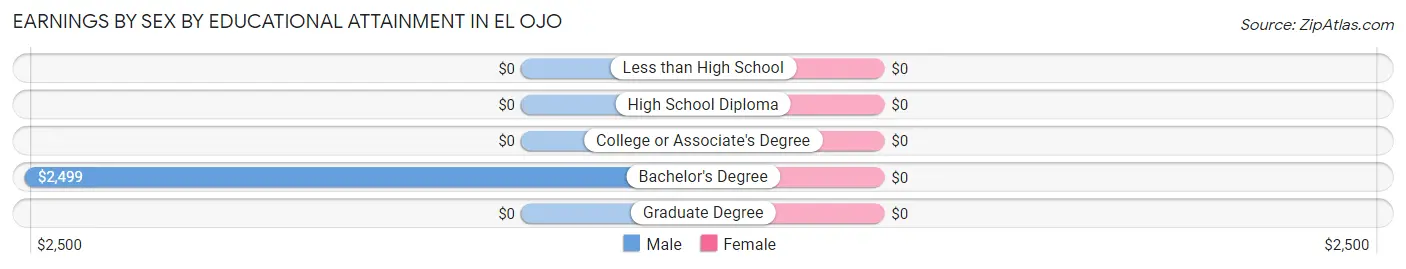
| Educational Attainment | Male Income | Female Income |
| Less than High School | - | - |
| High School Diploma | - | - |
| College or Associate's Degree | - | - |
| Bachelor's Degree | $2,499 | $0 |
| Graduate Degree | - | - |
| Total | $12,466 | $0 |
Family Income in El Ojo
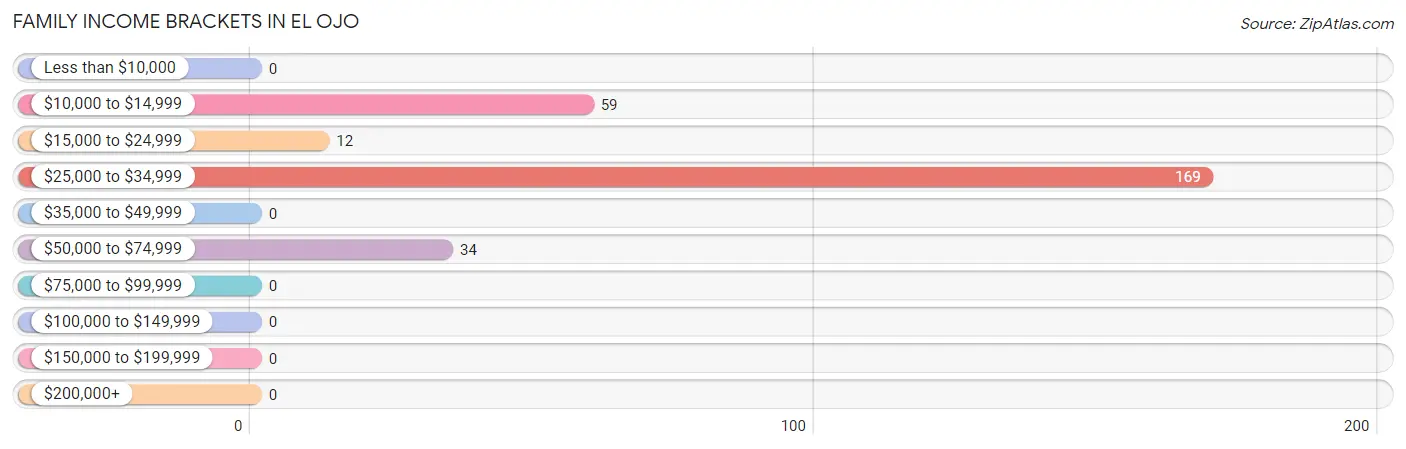
Family Income Brackets in El Ojo
According to the El Ojo family income data, there are 169 families falling into the $25,000 to $34,999 income range, which is the most common income bracket and makes up 61.7% of all families.
| Income Bracket | # Families | % Families |
| Less than $10,000 | 0 | 0.0% |
| $10,000 to $14,999 | 59 | 21.5% |
| $15,000 to $24,999 | 12 | 4.4% |
| $25,000 to $34,999 | 169 | 61.7% |
| $35,000 to $49,999 | 0 | 0.0% |
| $50,000 to $74,999 | 34 | 12.4% |
| $75,000 to $99,999 | 0 | 0.0% |
| $100,000 to $149,999 | 0 | 0.0% |
| $150,000 to $199,999 | 0 | 0.0% |
| $200,000+ | 0 | 0.0% |
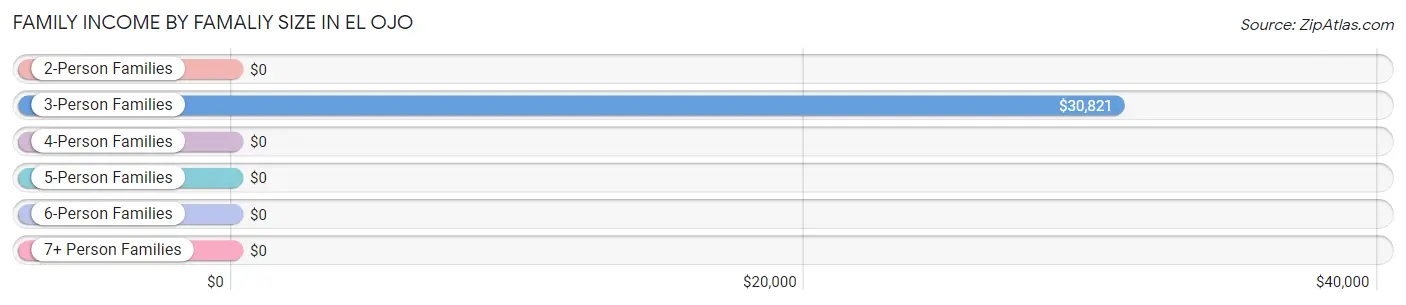
Family Income by Famaliy Size in El Ojo
3-person families (47 | 17.2%) account for the highest median family income in El Ojo with $30,821 per family, while 3-person families (47 | 17.2%) have the highest median income of $10,274 per family member.
| Income Bracket | # Families | Median Income |
| 2-Person Families | 95 (34.7%) | $0 |
| 3-Person Families | 47 (17.2%) | $30,821 |
| 4-Person Families | 98 (35.8%) | $0 |
| 5-Person Families | 0 (0.0%) | $0 |
| 6-Person Families | 0 (0.0%) | $0 |
| 7+ Person Families | 34 (12.4%) | $0 |
| Total | 274 (100.0%) | $30,222 |
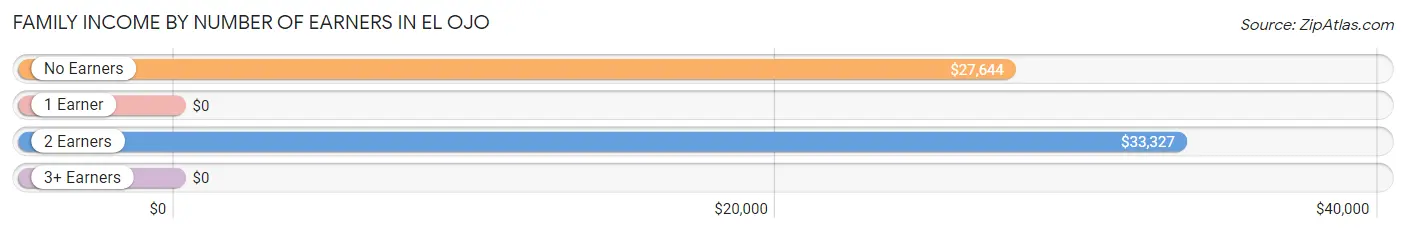
Family Income by Number of Earners in El Ojo
| Number of Earners | # Families | Median Income |
| No Earners | 69 (25.2%) | $27,644 |
| 1 Earner | 54 (19.7%) | $0 |
| 2 Earners | 151 (55.1%) | $33,327 |
| 3+ Earners | 0 (0.0%) | $0 |
| Total | 274 (100.0%) | $30,222 |
Household Income in El Ojo
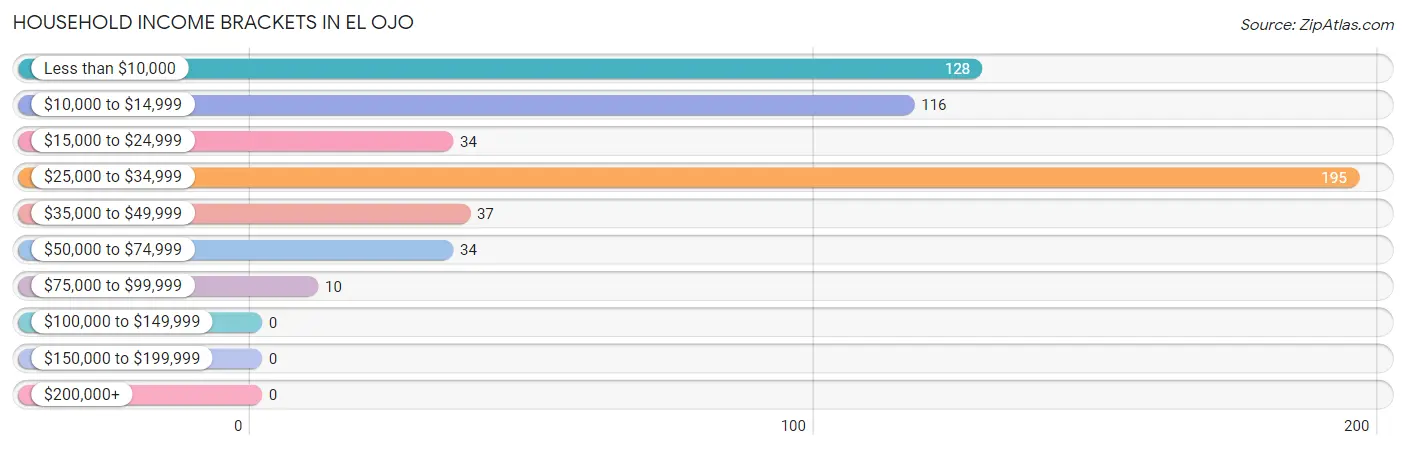
Household Income Brackets in El Ojo
With 195 households falling in the category, the $25,000 to $34,999 income range is the most frequent in El Ojo, accounting for 35.2% of all households.
| Income Bracket | # Households | % Households |
| Less than $10,000 | 128 | 23.1% |
| $10,000 to $14,999 | 116 | 20.9% |
| $15,000 to $24,999 | 34 | 6.1% |
| $25,000 to $34,999 | 195 | 35.2% |
| $35,000 to $49,999 | 37 | 6.7% |
| $50,000 to $74,999 | 34 | 6.1% |
| $75,000 to $99,999 | 10 | 1.8% |
| $100,000 to $149,999 | 0 | 0.0% |
| $150,000 to $199,999 | 0 | 0.0% |
| $200,000+ | 0 | 0.0% |
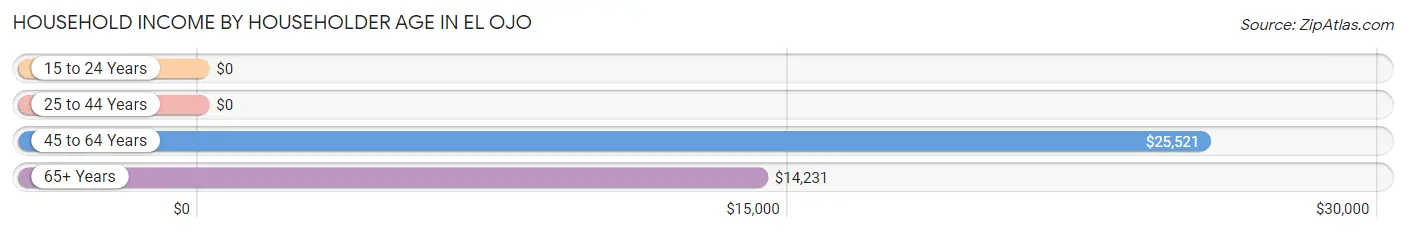
Household Income by Householder Age in El Ojo
The median household income in El Ojo is $24,886, with the highest median household income of $25,521 found in the 45 to 64 years age bracket for the primary householder. A total of 163 households (29.4%) fall into this category.
| Income Bracket | # Households | Median Income |
| 15 to 24 Years | 0 (0.0%) | $0 |
| 25 to 44 Years | 99 (17.9%) | $0 |
| 45 to 64 Years | 163 (29.4%) | $25,521 |
| 65+ Years | 292 (52.7%) | $14,231 |
| Total | 554 (100.0%) | $24,886 |
Poverty in El Ojo
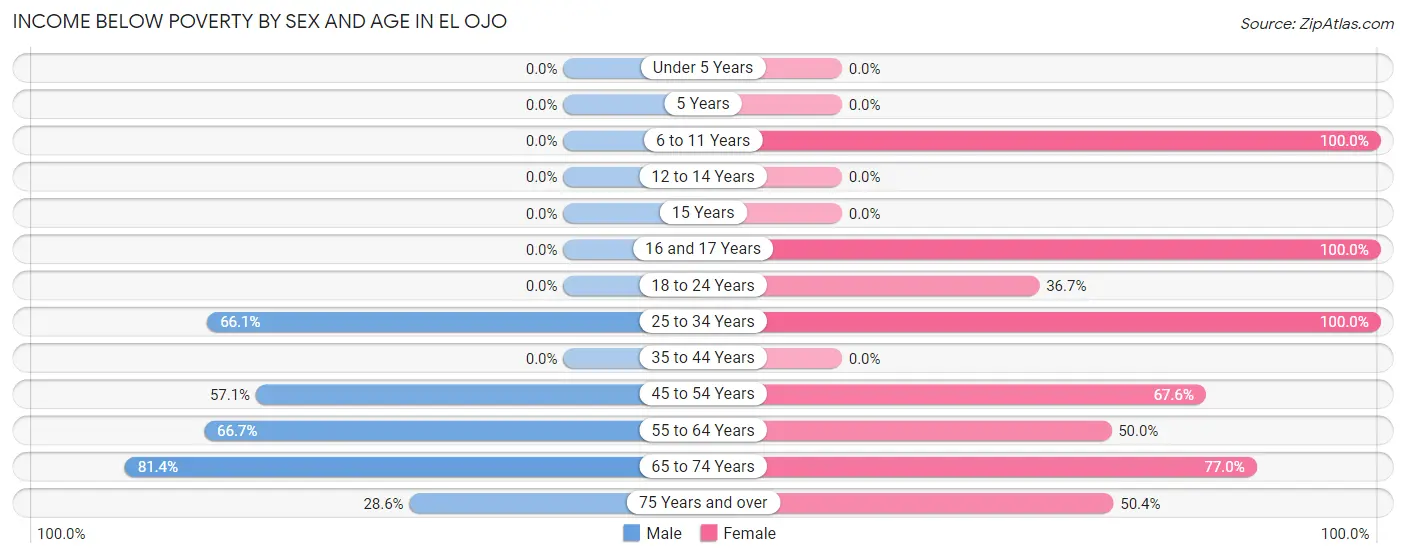
Income Below Poverty by Sex and Age in El Ojo
With 45.3% poverty level for males and 57.3% for females among the residents of El Ojo, 65 to 74 year old males and 6 to 11 year old females are the most vulnerable to poverty, with 70 males (81.4%) and 25 females (100.0%) in their respective age groups living below the poverty level.
| Age Bracket | Male | Female |
| Under 5 Years | 0 (0.0%) | 0 (0.0%) |
| 5 Years | 0 (0.0%) | 0 (0.0%) |
| 6 to 11 Years | 0 (0.0%) | 25 (100.0%) |
| 12 to 14 Years | 0 (0.0%) | 0 (0.0%) |
| 15 Years | 0 (0.0%) | 0 (0.0%) |
| 16 and 17 Years | 0 (0.0%) | 35 (100.0%) |
| 18 to 24 Years | 0 (0.0%) | 59 (36.6%) |
| 25 to 34 Years | 117 (66.1%) | 30 (100.0%) |
| 35 to 44 Years | 0 (0.0%) | 0 (0.0%) |
| 45 to 54 Years | 101 (57.1%) | 102 (67.5%) |
| 55 to 64 Years | 38 (66.7%) | 36 (50.0%) |
| 65 to 74 Years | 70 (81.4%) | 204 (77.0%) |
| 75 Years and over | 28 (28.6%) | 64 (50.4%) |
| Total | 354 (45.3%) | 555 (57.3%) |
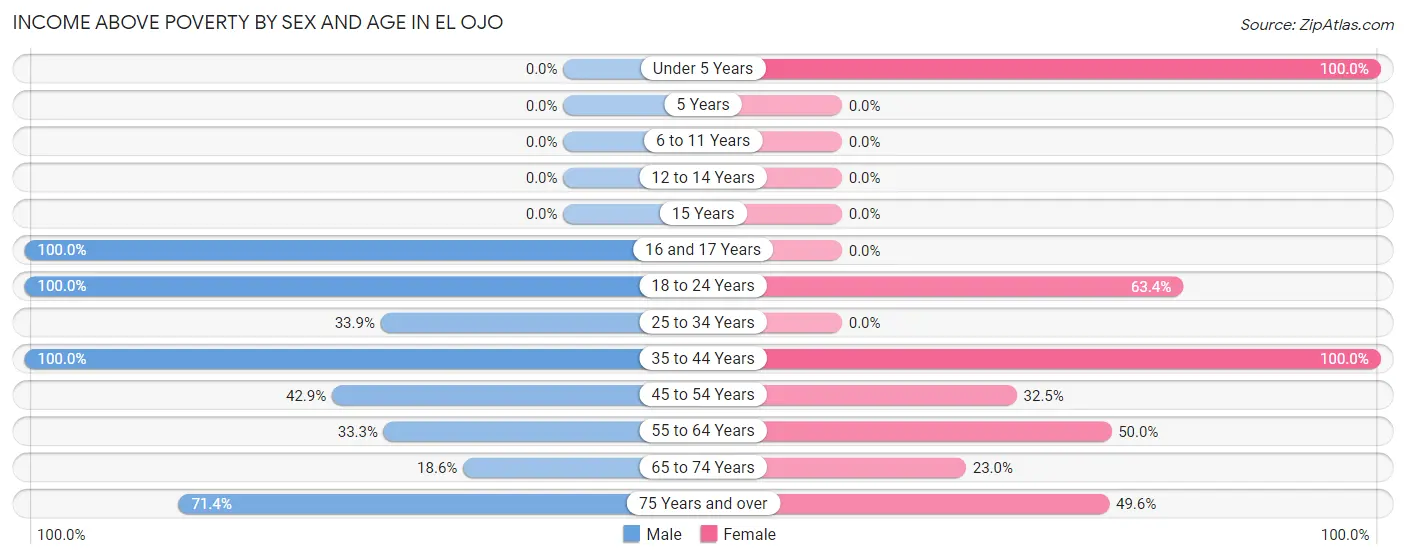
Income Above Poverty by Sex and Age in El Ojo
According to the poverty statistics in El Ojo, males aged 16 and 17 years and females aged under 5 years are the age groups that are most secure financially, with 100.0% of males and 100.0% of females in these age groups living above the poverty line.
| Age Bracket | Male | Female |
| Under 5 Years | 0 (0.0%) | 42 (100.0%) |
| 5 Years | 0 (0.0%) | 0 (0.0%) |
| 6 to 11 Years | 0 (0.0%) | 0 (0.0%) |
| 12 to 14 Years | 0 (0.0%) | 0 (0.0%) |
| 15 Years | 0 (0.0%) | 0 (0.0%) |
| 16 and 17 Years | 90 (100.0%) | 0 (0.0%) |
| 18 to 24 Years | 35 (100.0%) | 102 (63.3%) |
| 25 to 34 Years | 60 (33.9%) | 0 (0.0%) |
| 35 to 44 Years | 62 (100.0%) | 61 (100.0%) |
| 45 to 54 Years | 76 (42.9%) | 49 (32.5%) |
| 55 to 64 Years | 19 (33.3%) | 36 (50.0%) |
| 65 to 74 Years | 16 (18.6%) | 61 (23.0%) |
| 75 Years and over | 70 (71.4%) | 63 (49.6%) |
| Total | 428 (54.7%) | 414 (42.7%) |
Income Below Poverty Among Married-Couple Families in El Ojo
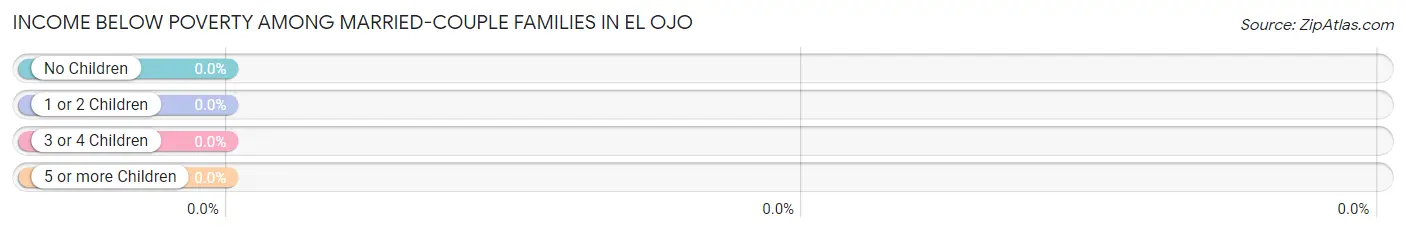
| Children | Above Poverty | Below Poverty |
| No Children | 61 (100.0%) | 0 (0.0%) |
| 1 or 2 Children | 96 (100.0%) | 0 (0.0%) |
| 3 or 4 Children | 0 (0.0%) | 0 (0.0%) |
| 5 or more Children | 0 (0.0%) | 0 (0.0%) |
| Total | 157 (100.0%) | 0 (0.0%) |
Income Below Poverty Among Single-Parent Households in El Ojo
According to the poverty data in El Ojo, 100.0% or 38 single-father households and 87.3% or 69 single-mother households are living below the poverty line. Among single-father households, those with no children have the highest poverty rate, with 38 households (100.0%) experiencing poverty. Likewise, among single-mother households, those with 1 or 2 children have the highest poverty rate, with 33 households (100.0%) falling below the poverty line.
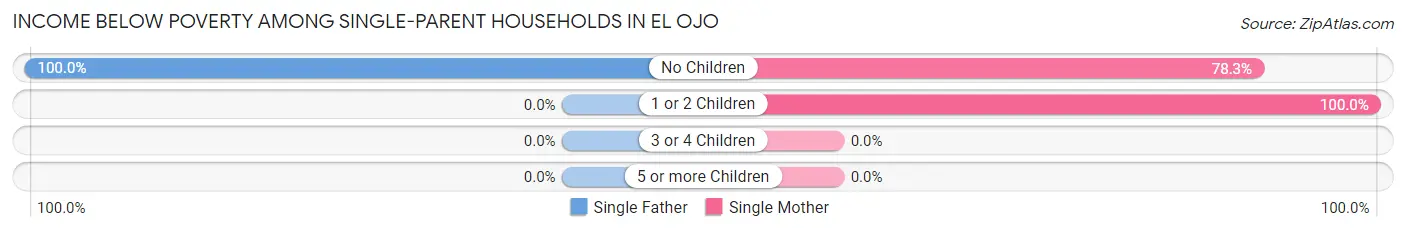
| Children | Single Father | Single Mother |
| No Children | 38 (100.0%) | 36 (78.3%) |
| 1 or 2 Children | 0 (0.0%) | 33 (100.0%) |
| 3 or 4 Children | 0 (0.0%) | 0 (0.0%) |
| 5 or more Children | 0 (0.0%) | 0 (0.0%) |
| Total | 38 (100.0%) | 69 (87.3%) |
Income Below Poverty Among Married-Couple vs Single-Parent Households in El Ojo
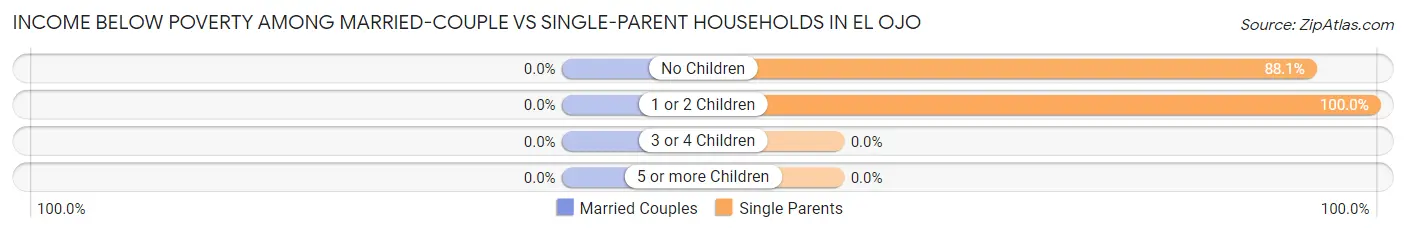
| Children | Married-Couple Families | Single-Parent Households |
| No Children | 0 (0.0%) | 74 (88.1%) |
| 1 or 2 Children | 0 (0.0%) | 33 (100.0%) |
| 3 or 4 Children | 0 (0.0%) | 0 (0.0%) |
| 5 or more Children | 0 (0.0%) | 0 (0.0%) |
| Total | 0 (0.0%) | 107 (91.4%) |
Race in El Ojo
The most populous races in El Ojo are Hispanic or Latino (1,751 | 100.0%), Two or more Races (1,207 | 68.9%), and Black / African American (304 | 17.4%).
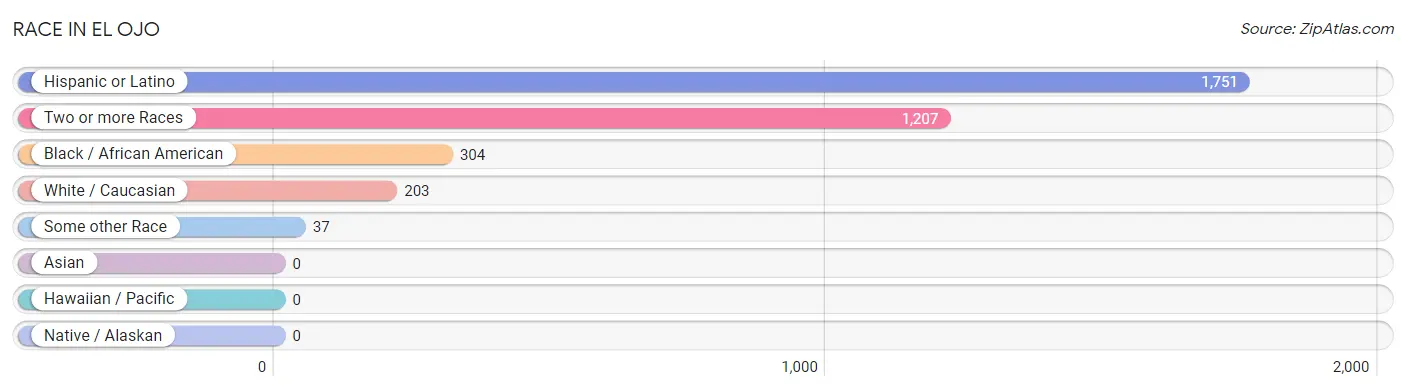
| Race | # Population | % Population |
| Asian | 0 | 0.0% |
| Black / African American | 304 | 17.4% |
| Hawaiian / Pacific | 0 | 0.0% |
| Hispanic or Latino | 1,751 | 100.0% |
| Native / Alaskan | 0 | 0.0% |
| White / Caucasian | 203 | 11.6% |
| Two or more Races | 1,207 | 68.9% |
| Some other Race | 37 | 2.1% |
| Total | 1,751 | 100.0% |
Ancestry in El Ojo
The most populous ancestries reported in El Ojo are Puerto Rican (1,751 | 100.0%), and Korean (175 | 10.0%), together accounting for 110.0% of all El Ojo residents.
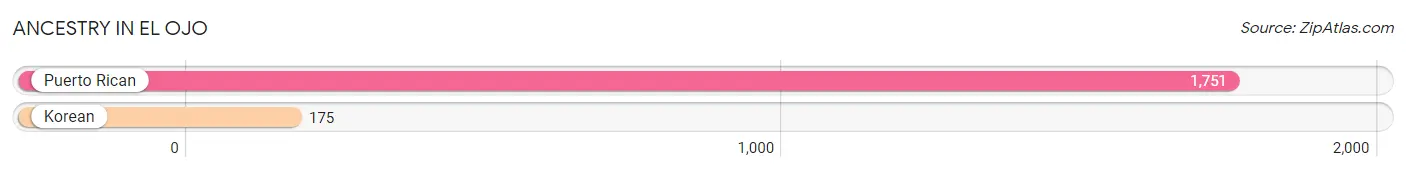
| Ancestry | # Population | % Population |
| Korean | 175 | 10.0% |
| Puerto Rican | 1,751 | 100.0% | View All 2 Rows |
Immigrants in El Ojo

| Immigration Origin | # Population | % Population | View All 0 Rows |
Sex and Age in El Ojo
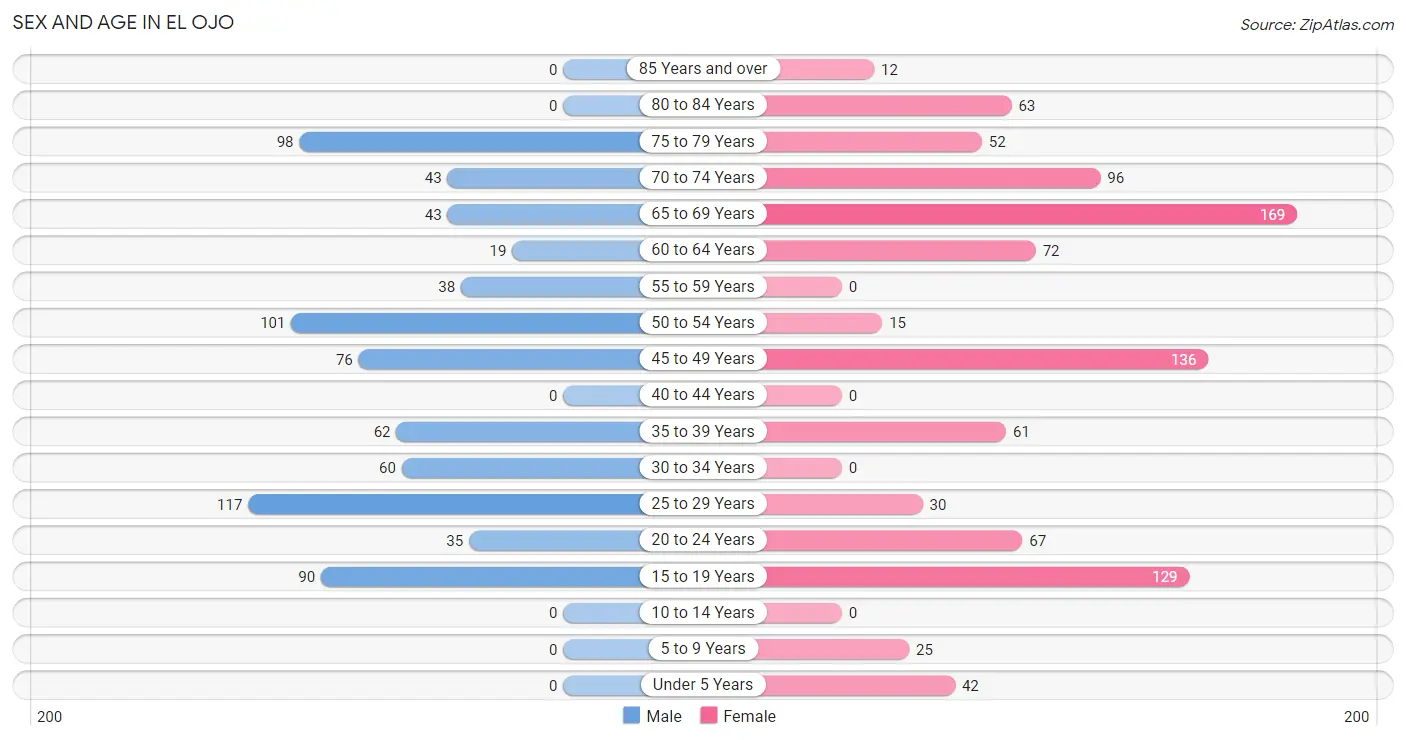
Sex and Age in El Ojo
The most populous age groups in El Ojo are 25 to 29 Years (117 | 15.0%) for men and 65 to 69 Years (169 | 17.4%) for women.
| Age Bracket | Male | Female |
| Under 5 Years | 0 (0.0%) | 42 (4.3%) |
| 5 to 9 Years | 0 (0.0%) | 25 (2.6%) |
| 10 to 14 Years | 0 (0.0%) | 0 (0.0%) |
| 15 to 19 Years | 90 (11.5%) | 129 (13.3%) |
| 20 to 24 Years | 35 (4.5%) | 67 (6.9%) |
| 25 to 29 Years | 117 (15.0%) | 30 (3.1%) |
| 30 to 34 Years | 60 (7.7%) | 0 (0.0%) |
| 35 to 39 Years | 62 (7.9%) | 61 (6.3%) |
| 40 to 44 Years | 0 (0.0%) | 0 (0.0%) |
| 45 to 49 Years | 76 (9.7%) | 136 (14.0%) |
| 50 to 54 Years | 101 (12.9%) | 15 (1.5%) |
| 55 to 59 Years | 38 (4.9%) | 0 (0.0%) |
| 60 to 64 Years | 19 (2.4%) | 72 (7.4%) |
| 65 to 69 Years | 43 (5.5%) | 169 (17.4%) |
| 70 to 74 Years | 43 (5.5%) | 96 (9.9%) |
| 75 to 79 Years | 98 (12.5%) | 52 (5.4%) |
| 80 to 84 Years | 0 (0.0%) | 63 (6.5%) |
| 85 Years and over | 0 (0.0%) | 12 (1.2%) |
| Total | 782 (100.0%) | 969 (100.0%) |
Families and Households in El Ojo
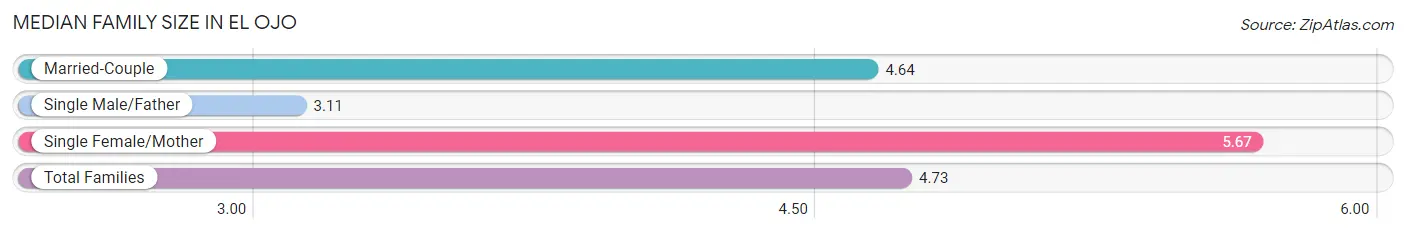
Median Family Size in El Ojo
The median family size in El Ojo is 4.73 persons per family, with single female/mother families (79 | 28.8%) accounting for the largest median family size of 5.67 persons per family. On the other hand, single male/father families (38 | 13.9%) represent the smallest median family size with 3.11 persons per family.
| Family Type | # Families | Family Size |
| Married-Couple | 157 (57.3%) | 4.64 |
| Single Male/Father | 38 (13.9%) | 3.11 |
| Single Female/Mother | 79 (28.8%) | 5.67 |
| Total Families | 274 (100.0%) | 4.73 |
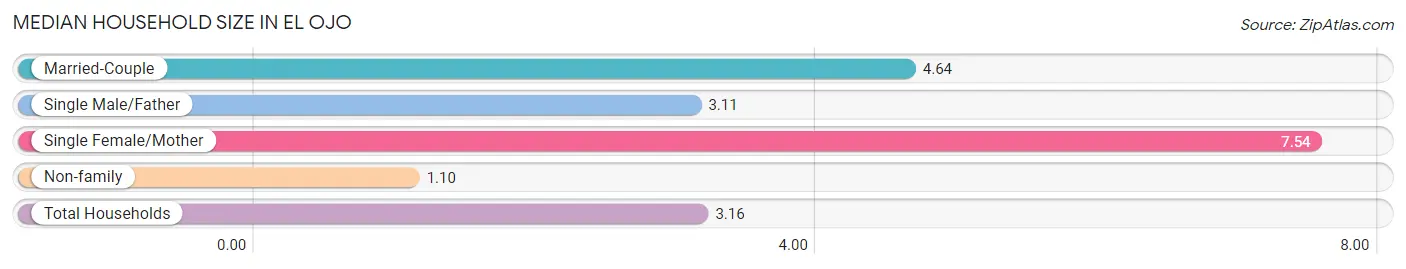
Median Household Size in El Ojo
The median household size in El Ojo is 3.16 persons per household, with single female/mother households (79 | 14.3%) accounting for the largest median household size of 7.54 persons per household. non-family households (280 | 50.5%) represent the smallest median household size with 1.10 persons per household.
| Household Type | # Households | Household Size |
| Married-Couple | 157 (28.3%) | 4.64 |
| Single Male/Father | 38 (6.9%) | 3.11 |
| Single Female/Mother | 79 (14.3%) | 7.54 |
| Non-family | 280 (50.5%) | 1.10 |
| Total Households | 554 (100.0%) | 3.16 |
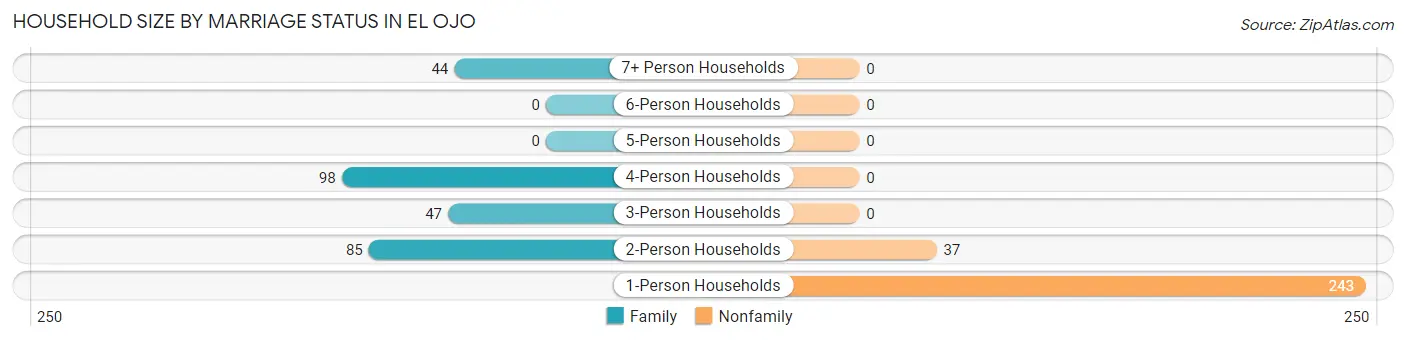
Household Size by Marriage Status in El Ojo
Out of a total of 554 households in El Ojo, 274 (49.5%) are family households, while 280 (50.5%) are nonfamily households. The most numerous type of family households are 4-person households, comprising 98, and the most common type of nonfamily households are 1-person households, comprising 243.
| Household Size | Family Households | Nonfamily Households |
| 1-Person Households | - | 243 (43.9%) |
| 2-Person Households | 85 (15.3%) | 37 (6.7%) |
| 3-Person Households | 47 (8.5%) | 0 (0.0%) |
| 4-Person Households | 98 (17.7%) | 0 (0.0%) |
| 5-Person Households | 0 (0.0%) | 0 (0.0%) |
| 6-Person Households | 0 (0.0%) | 0 (0.0%) |
| 7+ Person Households | 44 (7.9%) | 0 (0.0%) |
| Total | 274 (49.5%) | 280 (50.5%) |
Female Fertility in El Ojo
Fertility by Age in El Ojo
Average fertility rate in El Ojo is 83.0 births per 1,000 women. Women in the age bracket of 15 to 19 years have the highest fertility rate with 271.0 births per 1,000 women. Women in the age bracket of 15 to 19 years acount for 100.0% of all women with births.
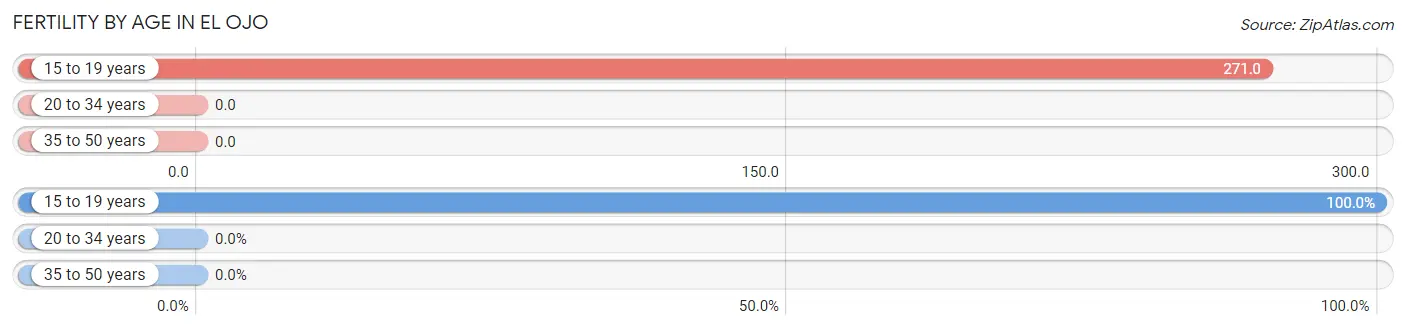
| Age Bracket | Women with Births | Births / 1,000 Women |
| 15 to 19 years | 35 (100.0%) | 271.0 |
| 20 to 34 years | 0 (0.0%) | 0.0 |
| 35 to 50 years | 0 (0.0%) | 0.0 |
| Total | 35 (100.0%) | 83.0 |
Fertility by Age by Marriage Status in El Ojo
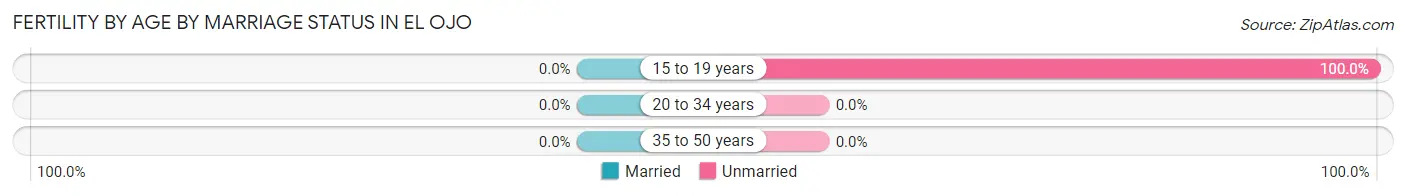
| Age Bracket | Married | Unmarried |
| 15 to 19 years | 0 (0.0%) | 35 (100.0%) |
| 20 to 34 years | 0 (0.0%) | 0 (0.0%) |
| 35 to 50 years | 0 (0.0%) | 0 (0.0%) |
| Total | 0 (0.0%) | 35 (100.0%) |
Fertility by Education in El Ojo
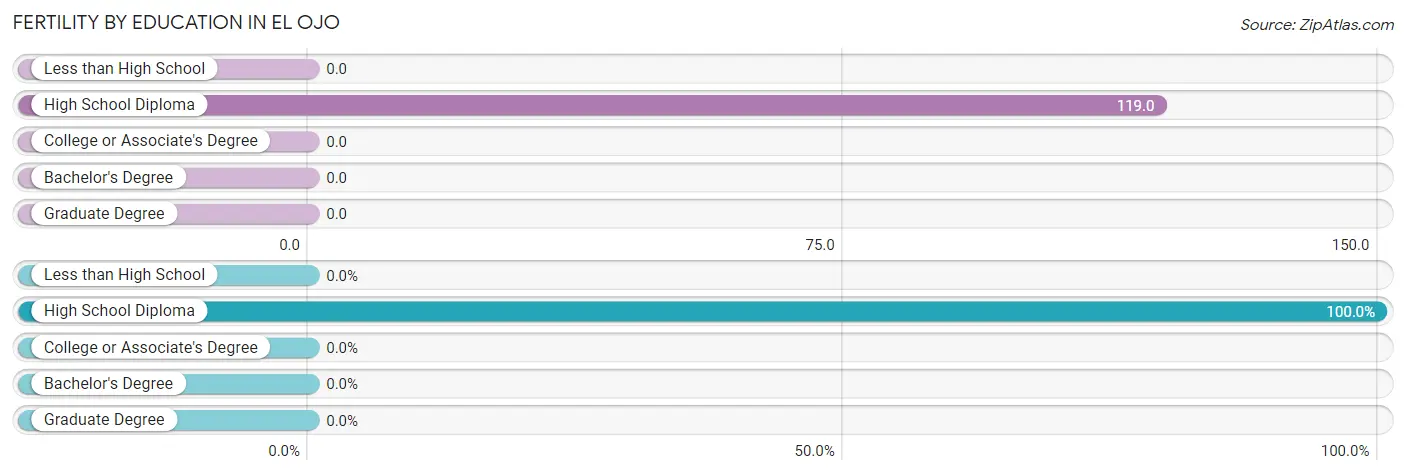
| Educational Attainment | Women with Births | Births / 1,000 Women |
| Less than High School | 0 (0.0%) | 0.0 |
| High School Diploma | 35 (100.0%) | 119.0 |
| College or Associate's Degree | 0 (0.0%) | 0.0 |
| Bachelor's Degree | 0 (0.0%) | 0.0 |
| Graduate Degree | 0 (0.0%) | 0.0 |
| Total | 35 (100.0%) | 83.0 |
Fertility by Education by Marriage Status in El Ojo
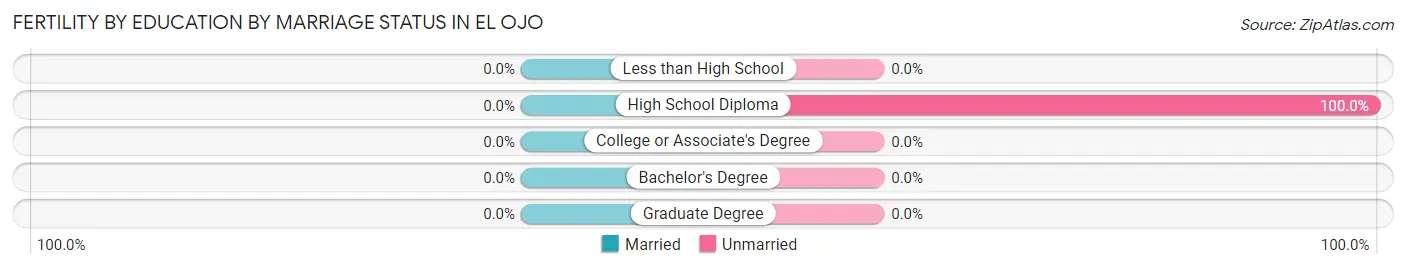
| Educational Attainment | Married | Unmarried |
| Less than High School | 0 (0.0%) | 0 (0.0%) |
| High School Diploma | 0 (0.0%) | 35 (100.0%) |
| College or Associate's Degree | 0 (0.0%) | 0 (0.0%) |
| Bachelor's Degree | 0 (0.0%) | 0 (0.0%) |
| Graduate Degree | 0 (0.0%) | 0 (0.0%) |
| Total | 0 (0.0%) | 35 (100.0%) |
Employment Characteristics in El Ojo
Employment by Class of Employer in El Ojo
Among the 390 employed individuals in El Ojo, private company employees (300 | 76.9%), and local government employees (90 | 23.1%) make up the most common classes of employment.
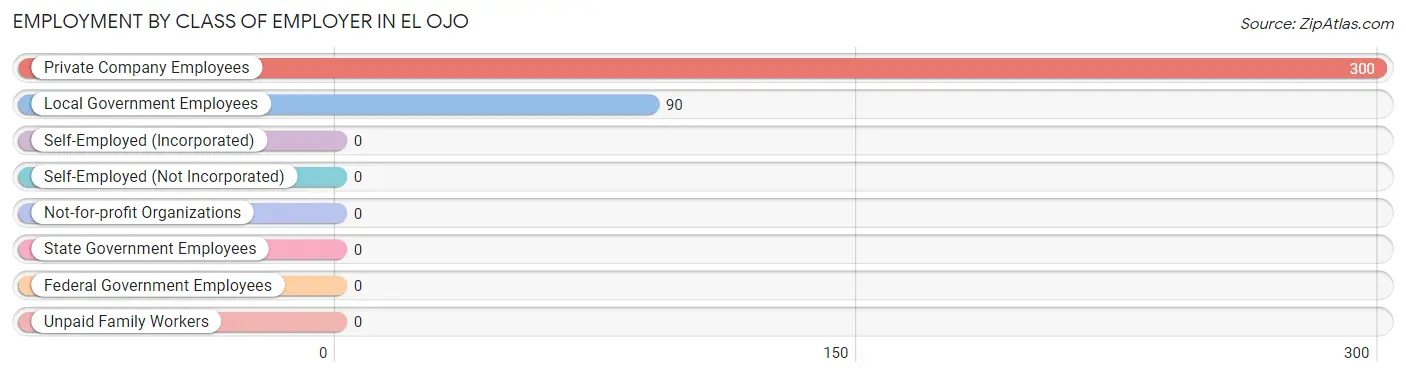
| Employer Class | # Employees | % Employees |
| Private Company Employees | 300 | 76.9% |
| Self-Employed (Incorporated) | 0 | 0.0% |
| Self-Employed (Not Incorporated) | 0 | 0.0% |
| Not-for-profit Organizations | 0 | 0.0% |
| Local Government Employees | 90 | 23.1% |
| State Government Employees | 0 | 0.0% |
| Federal Government Employees | 0 | 0.0% |
| Unpaid Family Workers | 0 | 0.0% |
| Total | 390 | 100.0% |
Employment Status by Age in El Ojo
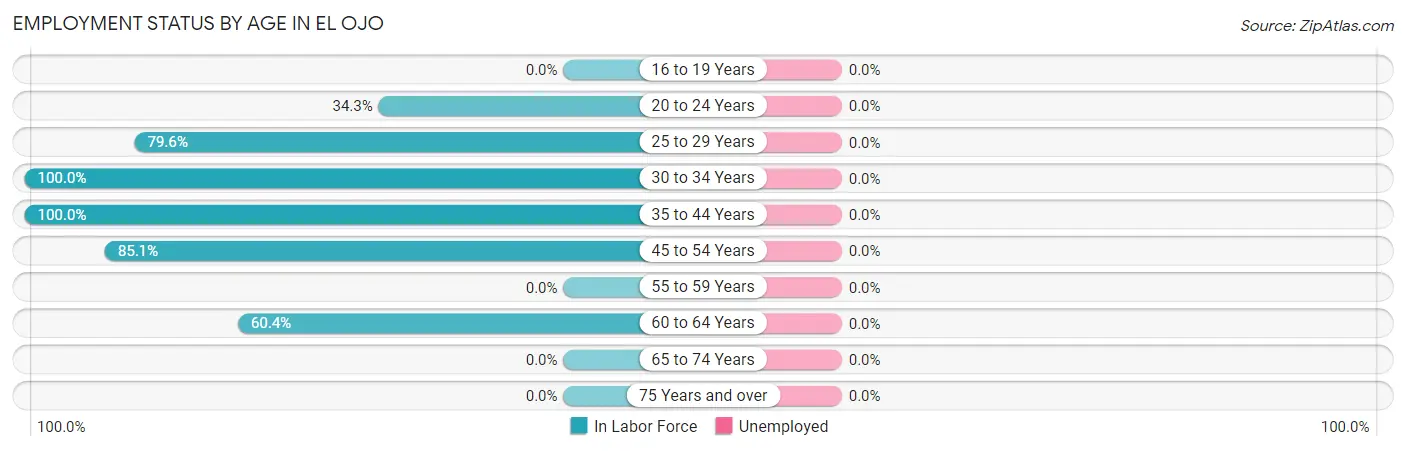
| Age Bracket | In Labor Force | Unemployed |
| 16 to 19 Years | 0 (0.0%) | 0 (0.0%) |
| 20 to 24 Years | 35 (34.3%) | 0 (0.0%) |
| 25 to 29 Years | 117 (79.6%) | 0 (0.0%) |
| 30 to 34 Years | 60 (100.0%) | 0 (0.0%) |
| 35 to 44 Years | 123 (100.0%) | 0 (0.0%) |
| 45 to 54 Years | 279 (85.1%) | 0 (0.0%) |
| 55 to 59 Years | 0 (0.0%) | 0 (0.0%) |
| 60 to 64 Years | 55 (60.4%) | 0 (0.0%) |
| 65 to 74 Years | 0 (0.0%) | 0 (0.0%) |
| 75 Years and over | 0 (0.0%) | 0 (0.0%) |
| Total | 669 (39.7%) | 0 (0.0%) |
Employment Status by Educational Attainment in El Ojo

| Educational Attainment | In Labor Force | Unemployed |
| Less than High School | 38 (100.0%) | 0 (0.0%) |
| High School Diploma | 292 (78.7%) | 0 (0.0%) |
| College / Associate Degree | 159 (81.5%) | 0 (0.0%) |
| Bachelor's Degree or higher | 145 (79.2%) | 0 (0.0%) |
| Total | 634 (80.6%) | 0 (0.0%) |
Employment Occupations by Sex in El Ojo
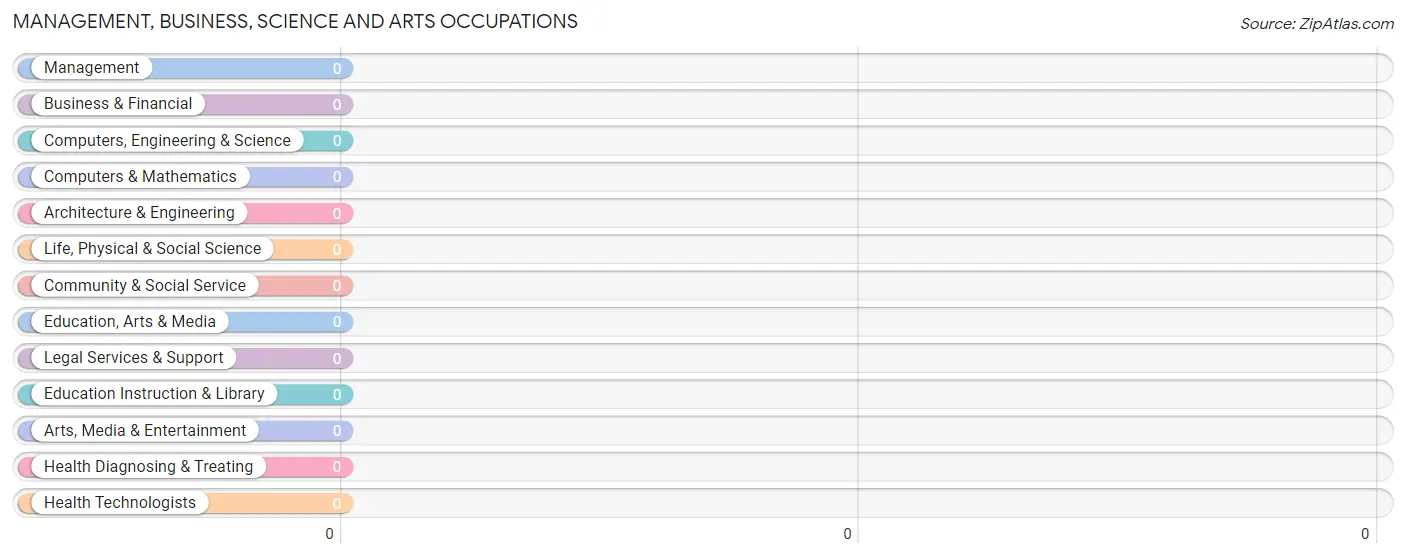
Management, Business, Science and Arts Occupations
Management, Business, Science and Arts Occupations by Sex
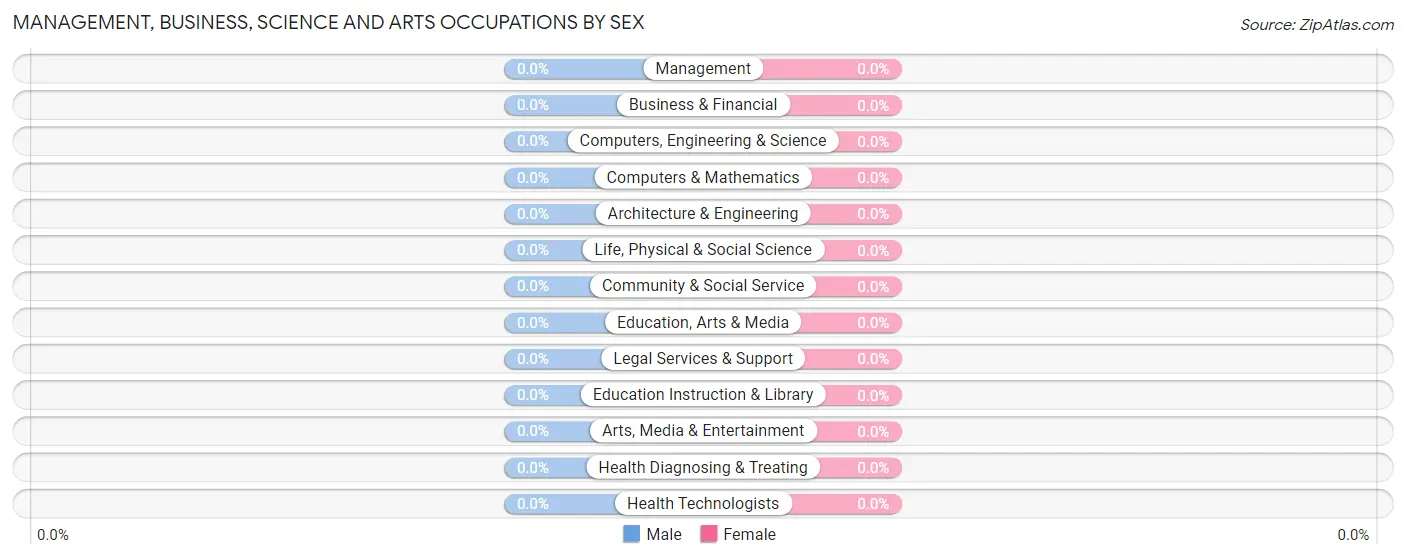
| Occupation | Male | Female |
| Management | 0 (0.0%) | 0 (0.0%) |
| Business & Financial | 0 (0.0%) | 0 (0.0%) |
| Computers, Engineering & Science | 0 (0.0%) | 0 (0.0%) |
| Computers & Mathematics | 0 (0.0%) | 0 (0.0%) |
| Architecture & Engineering | 0 (0.0%) | 0 (0.0%) |
| Life, Physical & Social Science | 0 (0.0%) | 0 (0.0%) |
| Community & Social Service | 0 (0.0%) | 0 (0.0%) |
| Education, Arts & Media | 0 (0.0%) | 0 (0.0%) |
| Legal Services & Support | 0 (0.0%) | 0 (0.0%) |
| Education Instruction & Library | 0 (0.0%) | 0 (0.0%) |
| Arts, Media & Entertainment | 0 (0.0%) | 0 (0.0%) |
| Health Diagnosing & Treating | 0 (0.0%) | 0 (0.0%) |
| Health Technologists | 0 (0.0%) | 0 (0.0%) |
| Total (Category) | 0 (0.0%) | 0 (0.0%) |
| Total (Overall) | 470 (70.3%) | 199 (29.7%) |
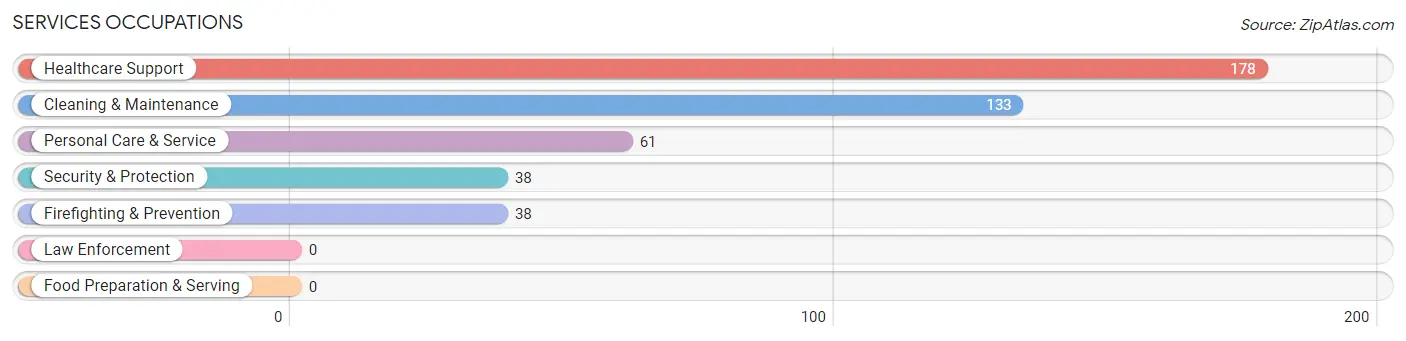
Services Occupations
The most common Services occupations in El Ojo are Healthcare Support (178 | 26.6%), Cleaning & Maintenance (133 | 19.9%), Personal Care & Service (61 | 9.1%), Security & Protection (38 | 5.7%), and Firefighting & Prevention (38 | 5.7%).
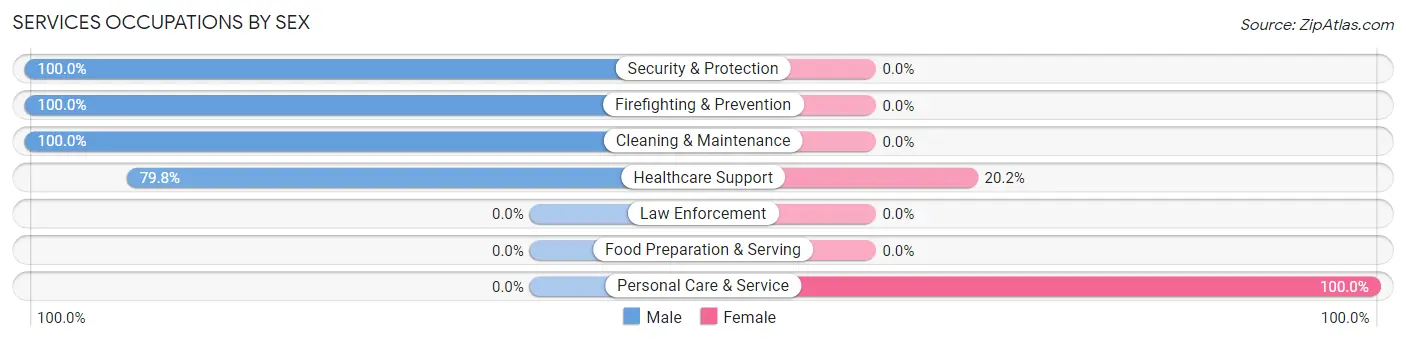
Services Occupations by Sex
Within the Services occupations in El Ojo, the most male-oriented occupations are Security & Protection (100.0%), Firefighting & Prevention (100.0%), and Cleaning & Maintenance (100.0%), while the most female-oriented occupations are Personal Care & Service (100.0%), and Healthcare Support (20.2%).
| Occupation | Male | Female |
| Healthcare Support | 142 (79.8%) | 36 (20.2%) |
| Security & Protection | 38 (100.0%) | 0 (0.0%) |
| Firefighting & Prevention | 38 (100.0%) | 0 (0.0%) |
| Law Enforcement | 0 (0.0%) | 0 (0.0%) |
| Food Preparation & Serving | 0 (0.0%) | 0 (0.0%) |
| Cleaning & Maintenance | 133 (100.0%) | 0 (0.0%) |
| Personal Care & Service | 0 (0.0%) | 61 (100.0%) |
| Total (Category) | 313 (76.3%) | 97 (23.7%) |
| Total (Overall) | 470 (70.3%) | 199 (29.7%) |
Sales and Office Occupations
The most common Sales and Office occupations in El Ojo are Office & Administration (102 | 15.2%), and Sales & Related (65 | 9.7%).

Sales and Office Occupations by Sex

| Occupation | Male | Female |
| Sales & Related | 65 (100.0%) | 0 (0.0%) |
| Office & Administration | 0 (0.0%) | 102 (100.0%) |
| Total (Category) | 65 (38.9%) | 102 (61.1%) |
| Total (Overall) | 470 (70.3%) | 199 (29.7%) |
Natural Resources, Construction and Maintenance Occupations
The most common Natural Resources, Construction and Maintenance occupations in El Ojo are , and Farming, Fishing & Forestry (35 | 5.2%).

Natural Resources, Construction and Maintenance Occupations by Sex

| Occupation | Male | Female |
| Farming, Fishing & Forestry | 35 (100.0%) | 0 (0.0%) |
| Construction & Extraction | 0 (0.0%) | 0 (0.0%) |
| Installation, Maintenance & Repair | 0 (0.0%) | 0 (0.0%) |
| Total (Category) | 35 (100.0%) | 0 (0.0%) |
| Total (Overall) | 470 (70.3%) | 199 (29.7%) |
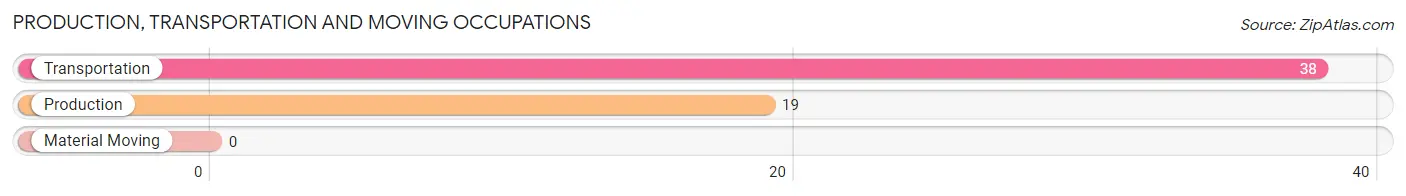
Production, Transportation and Moving Occupations
The most common Production, Transportation and Moving occupations in El Ojo are Transportation (38 | 5.7%), and Production (19 | 2.8%).
Production, Transportation and Moving Occupations by Sex

| Occupation | Male | Female |
| Production | 19 (100.0%) | 0 (0.0%) |
| Transportation | 38 (100.0%) | 0 (0.0%) |
| Material Moving | 0 (0.0%) | 0 (0.0%) |
| Total (Category) | 57 (100.0%) | 0 (0.0%) |
| Total (Overall) | 470 (70.3%) | 199 (29.7%) |
Employment Industries by Sex in El Ojo
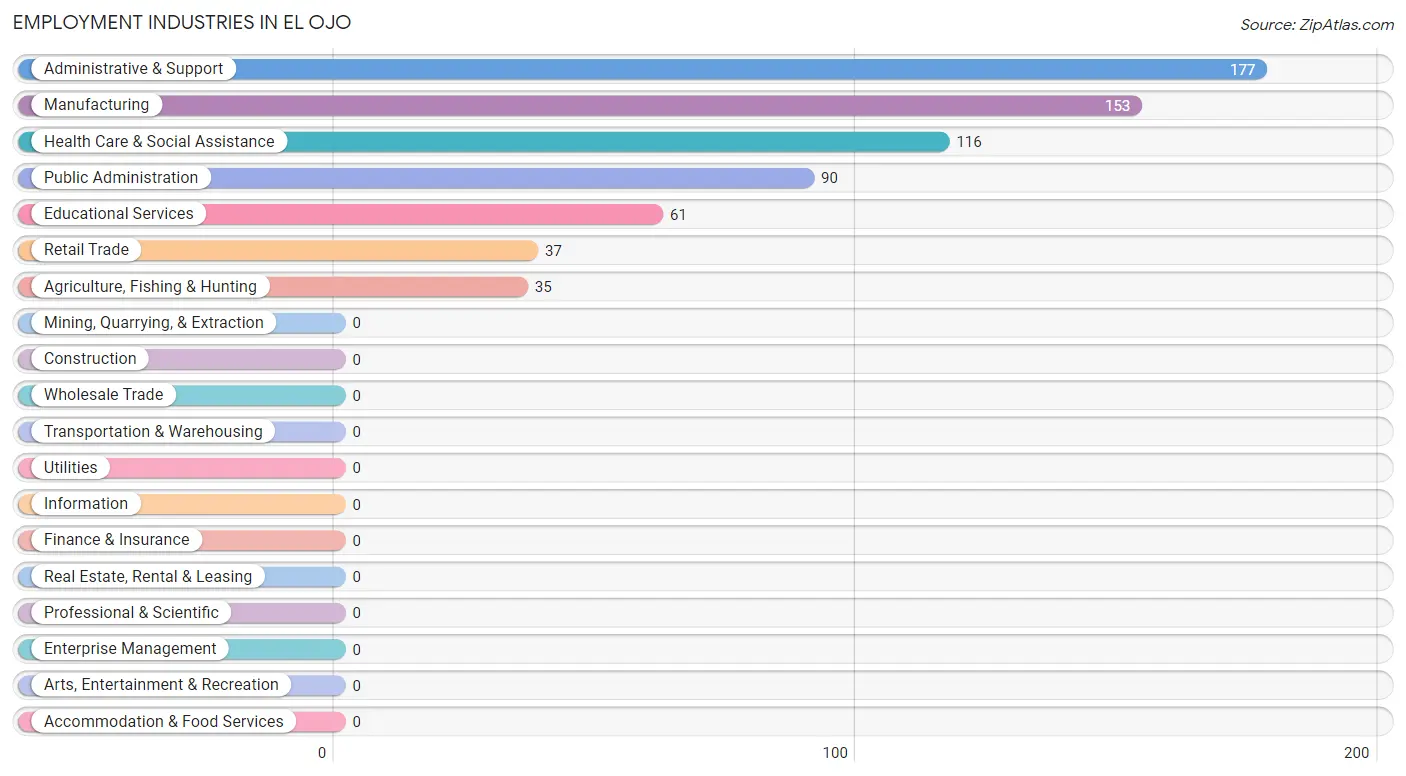
Employment Industries in El Ojo
The major employment industries in El Ojo include Administrative & Support (177 | 26.5%), Manufacturing (153 | 22.9%), Health Care & Social Assistance (116 | 17.3%), Public Administration (90 | 13.5%), and Educational Services (61 | 9.1%).
Employment Industries by Sex in El Ojo
The El Ojo industries that see more men than women are Agriculture, Fishing & Hunting (100.0%), Retail Trade (100.0%), and Administrative & Support (100.0%), whereas the industries that tend to have a higher number of women are Educational Services (100.0%), Manufacturing (66.7%), and Health Care & Social Assistance (31.0%).
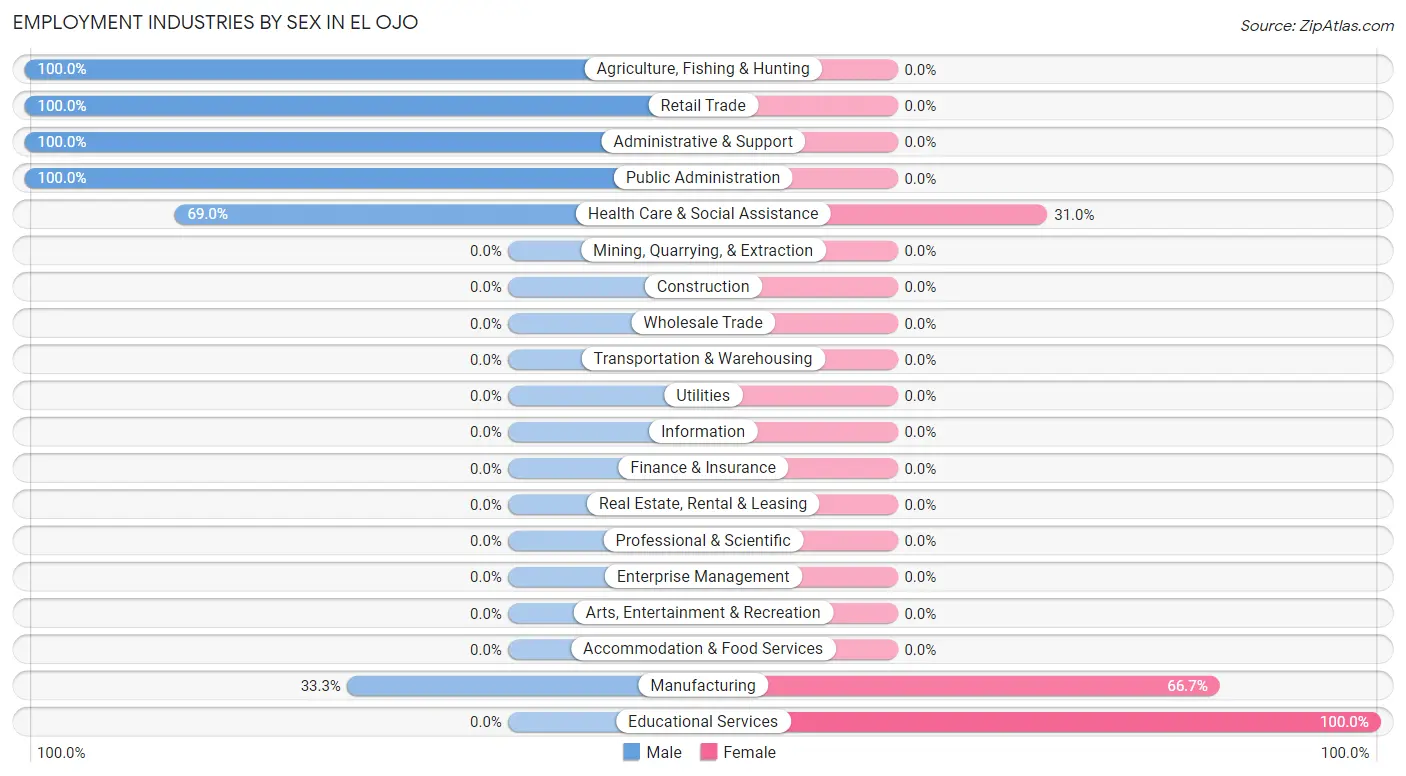
| Industry | Male | Female |
| Agriculture, Fishing & Hunting | 35 (100.0%) | 0 (0.0%) |
| Mining, Quarrying, & Extraction | 0 (0.0%) | 0 (0.0%) |
| Construction | 0 (0.0%) | 0 (0.0%) |
| Manufacturing | 51 (33.3%) | 102 (66.7%) |
| Wholesale Trade | 0 (0.0%) | 0 (0.0%) |
| Retail Trade | 37 (100.0%) | 0 (0.0%) |
| Transportation & Warehousing | 0 (0.0%) | 0 (0.0%) |
| Utilities | 0 (0.0%) | 0 (0.0%) |
| Information | 0 (0.0%) | 0 (0.0%) |
| Finance & Insurance | 0 (0.0%) | 0 (0.0%) |
| Real Estate, Rental & Leasing | 0 (0.0%) | 0 (0.0%) |
| Professional & Scientific | 0 (0.0%) | 0 (0.0%) |
| Enterprise Management | 0 (0.0%) | 0 (0.0%) |
| Administrative & Support | 177 (100.0%) | 0 (0.0%) |
| Educational Services | 0 (0.0%) | 61 (100.0%) |
| Health Care & Social Assistance | 80 (69.0%) | 36 (31.0%) |
| Arts, Entertainment & Recreation | 0 (0.0%) | 0 (0.0%) |
| Accommodation & Food Services | 0 (0.0%) | 0 (0.0%) |
| Public Administration | 90 (100.0%) | 0 (0.0%) |
| Total | 470 (70.3%) | 199 (29.7%) |
Education in El Ojo
School Enrollment in El Ojo
The most common levels of schooling among the 215 students in El Ojo are college / undergraduate (126 | 58.6%), high school (54 | 25.1%), and elementary school (25 | 11.6%).
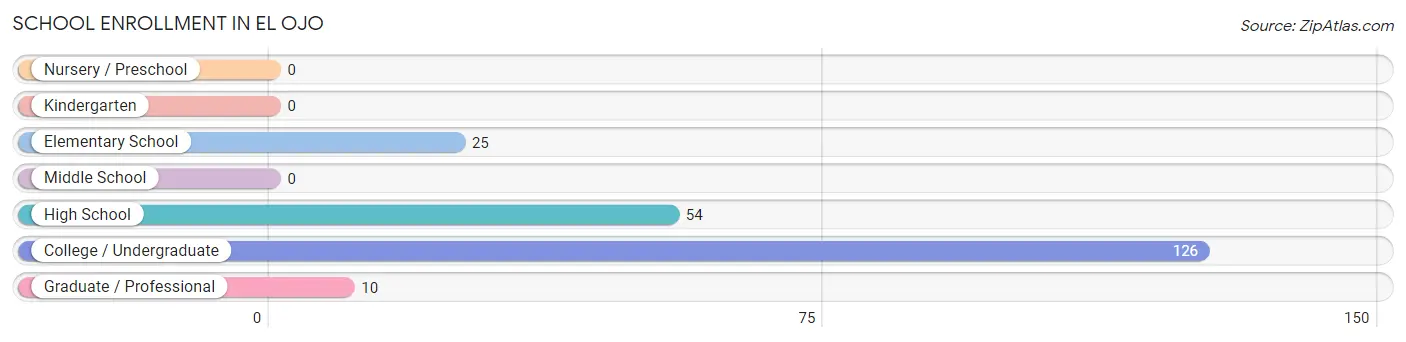
| School Level | # Students | % Students |
| Nursery / Preschool | 0 | 0.0% |
| Kindergarten | 0 | 0.0% |
| Elementary School | 25 | 11.6% |
| Middle School | 0 | 0.0% |
| High School | 54 | 25.1% |
| College / Undergraduate | 126 | 58.6% |
| Graduate / Professional | 10 | 4.6% |
| Total | 215 | 100.0% |
School Enrollment by Age by Funding Source in El Ojo
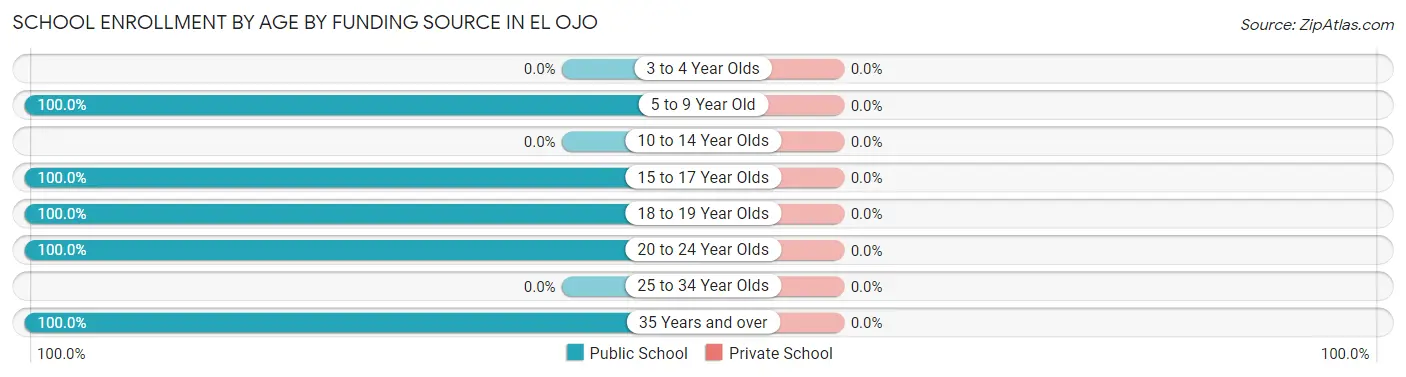
| Age Bracket | Public School | Private School |
| 3 to 4 Year Olds | 0 (0.0%) | 0 (0.0%) |
| 5 to 9 Year Old | 25 (100.0%) | 0 (0.0%) |
| 10 to 14 Year Olds | 0 (0.0%) | 0 (0.0%) |
| 15 to 17 Year Olds | 54 (100.0%) | 0 (0.0%) |
| 18 to 19 Year Olds | 59 (100.0%) | 0 (0.0%) |
| 20 to 24 Year Olds | 67 (100.0%) | 0 (0.0%) |
| 25 to 34 Year Olds | 0 (0.0%) | 0 (0.0%) |
| 35 Years and over | 10 (100.0%) | 0 (0.0%) |
| Total | 215 (100.0%) | 0 (0.0%) |
Educational Attainment by Field of Study in El Ojo
Business (143 | 59.6%), social sciences (52 | 21.7%), and arts & humanities (45 | 18.8%) are the most common fields of study among 240 individuals in El Ojo who have obtained a bachelor's degree or higher.
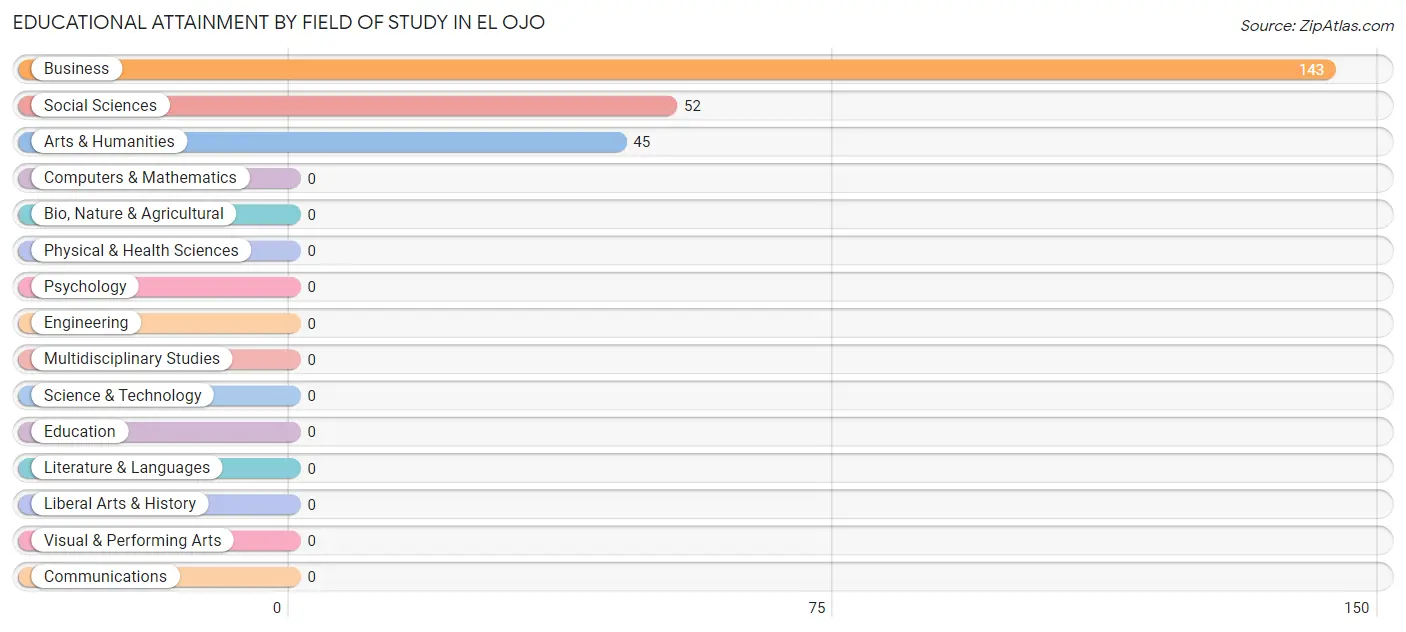
| Field of Study | # Graduates | % Graduates |
| Computers & Mathematics | 0 | 0.0% |
| Bio, Nature & Agricultural | 0 | 0.0% |
| Physical & Health Sciences | 0 | 0.0% |
| Psychology | 0 | 0.0% |
| Social Sciences | 52 | 21.7% |
| Engineering | 0 | 0.0% |
| Multidisciplinary Studies | 0 | 0.0% |
| Science & Technology | 0 | 0.0% |
| Business | 143 | 59.6% |
| Education | 0 | 0.0% |
| Literature & Languages | 0 | 0.0% |
| Liberal Arts & History | 0 | 0.0% |
| Visual & Performing Arts | 0 | 0.0% |
| Communications | 0 | 0.0% |
| Arts & Humanities | 45 | 18.8% |
| Total | 240 | 100.0% |
Transportation & Commute in El Ojo
Vehicle Availability by Sex in El Ojo
The most prevalent vehicle ownership categories in El Ojo are males with 2 vehicles (128, accounting for 50.8%) and females with 2 vehicles (102, making up 92.7%).
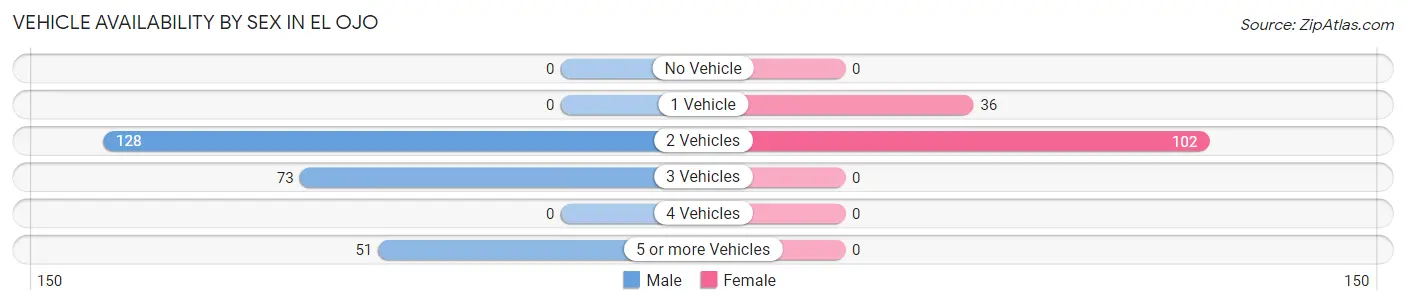
| Vehicles Available | Male | Female |
| No Vehicle | 0 (0.0%) | 0 (0.0%) |
| 1 Vehicle | 0 (0.0%) | 36 (26.1%) |
| 2 Vehicles | 128 (50.8%) | 102 (73.9%) |
| 3 Vehicles | 73 (29.0%) | 0 (0.0%) |
| 4 Vehicles | 0 (0.0%) | 0 (0.0%) |
| 5 or more Vehicles | 51 (20.2%) | 0 (0.0%) |
| Total | 252 (100.0%) | 138 (100.0%) |
Commute Time in El Ojo
The most frequently occuring commute durations in El Ojo are 10 to 14 minutes (171 commuters, 43.9%), 5 to 9 minutes (102 commuters, 26.2%), and 30 to 34 minutes (51 commuters, 13.1%).
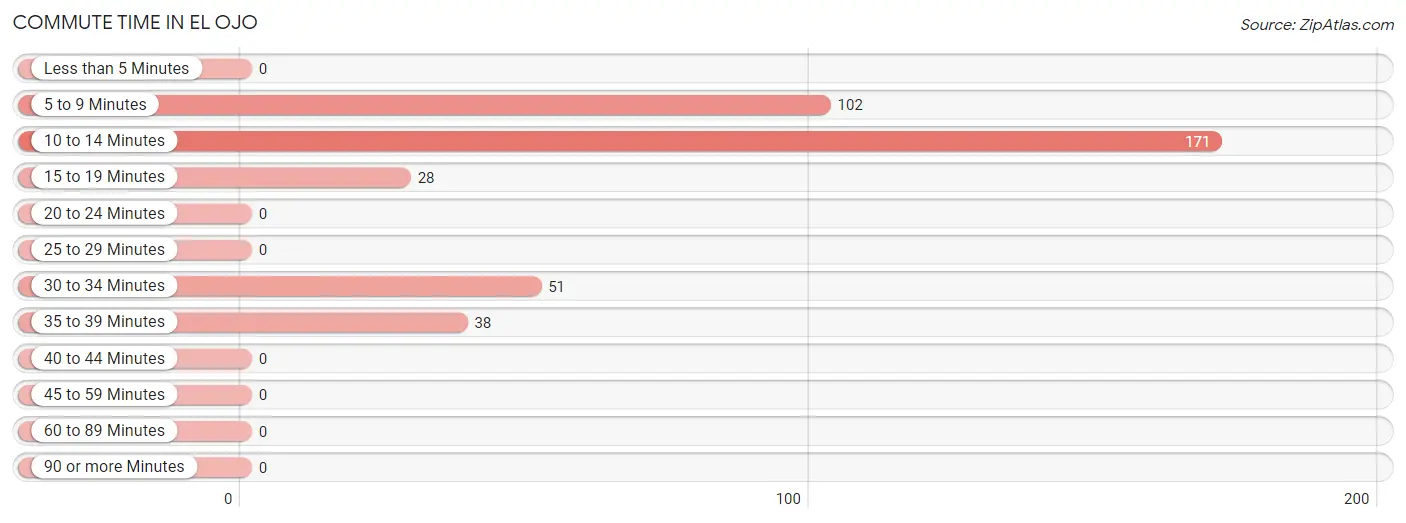
| Commute Time | # Commuters | % Commuters |
| Less than 5 Minutes | 0 | 0.0% |
| 5 to 9 Minutes | 102 | 26.2% |
| 10 to 14 Minutes | 171 | 43.9% |
| 15 to 19 Minutes | 28 | 7.2% |
| 20 to 24 Minutes | 0 | 0.0% |
| 25 to 29 Minutes | 0 | 0.0% |
| 30 to 34 Minutes | 51 | 13.1% |
| 35 to 39 Minutes | 38 | 9.7% |
| 40 to 44 Minutes | 0 | 0.0% |
| 45 to 59 Minutes | 0 | 0.0% |
| 60 to 89 Minutes | 0 | 0.0% |
| 90 or more Minutes | 0 | 0.0% |
Commute Time by Sex in El Ojo
The most common commute times in El Ojo are 10 to 14 minutes (135 commuters, 53.6%) for males and 5 to 9 minutes (102 commuters, 73.9%) for females.
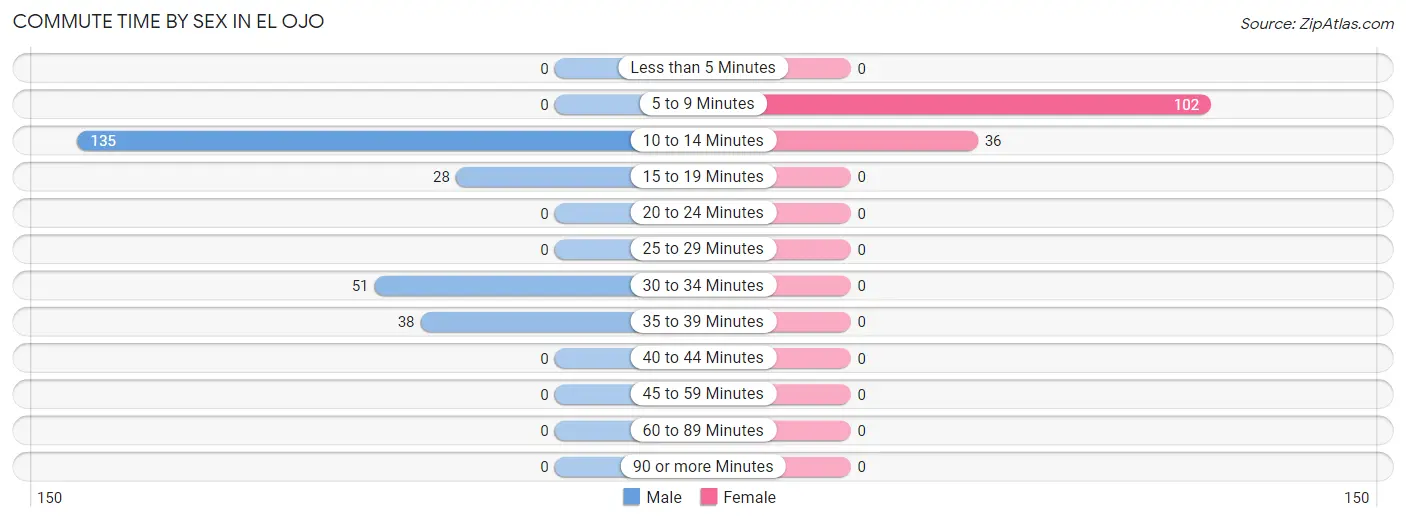
| Commute Time | Male | Female |
| Less than 5 Minutes | 0 (0.0%) | 0 (0.0%) |
| 5 to 9 Minutes | 0 (0.0%) | 102 (73.9%) |
| 10 to 14 Minutes | 135 (53.6%) | 36 (26.1%) |
| 15 to 19 Minutes | 28 (11.1%) | 0 (0.0%) |
| 20 to 24 Minutes | 0 (0.0%) | 0 (0.0%) |
| 25 to 29 Minutes | 0 (0.0%) | 0 (0.0%) |
| 30 to 34 Minutes | 51 (20.2%) | 0 (0.0%) |
| 35 to 39 Minutes | 38 (15.1%) | 0 (0.0%) |
| 40 to 44 Minutes | 0 (0.0%) | 0 (0.0%) |
| 45 to 59 Minutes | 0 (0.0%) | 0 (0.0%) |
| 60 to 89 Minutes | 0 (0.0%) | 0 (0.0%) |
| 90 or more Minutes | 0 (0.0%) | 0 (0.0%) |
Time of Departure to Work by Sex in El Ojo
The most frequent times of departure to work in El Ojo are 6:30 AM to 6:59 AM (129, 51.2%) for males and 12:00 AM to 4:59 AM (102, 73.9%) for females.
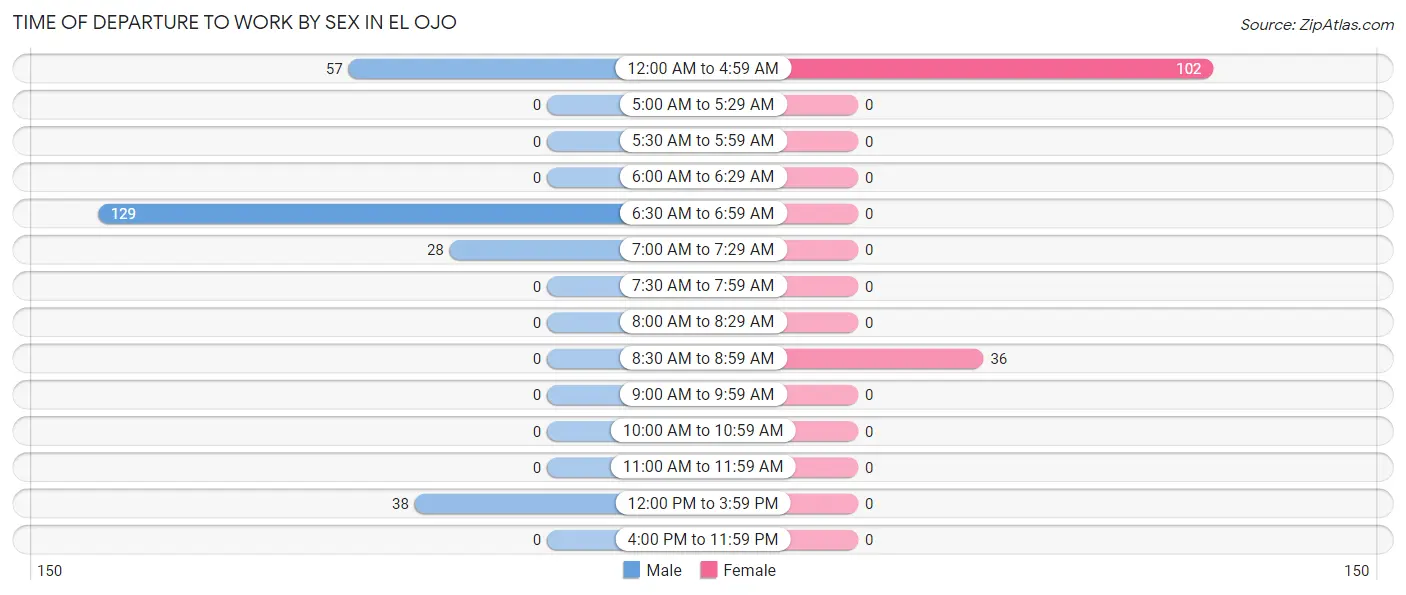
| Time of Departure | Male | Female |
| 12:00 AM to 4:59 AM | 57 (22.6%) | 102 (73.9%) |
| 5:00 AM to 5:29 AM | 0 (0.0%) | 0 (0.0%) |
| 5:30 AM to 5:59 AM | 0 (0.0%) | 0 (0.0%) |
| 6:00 AM to 6:29 AM | 0 (0.0%) | 0 (0.0%) |
| 6:30 AM to 6:59 AM | 129 (51.2%) | 0 (0.0%) |
| 7:00 AM to 7:29 AM | 28 (11.1%) | 0 (0.0%) |
| 7:30 AM to 7:59 AM | 0 (0.0%) | 0 (0.0%) |
| 8:00 AM to 8:29 AM | 0 (0.0%) | 0 (0.0%) |
| 8:30 AM to 8:59 AM | 0 (0.0%) | 36 (26.1%) |
| 9:00 AM to 9:59 AM | 0 (0.0%) | 0 (0.0%) |
| 10:00 AM to 10:59 AM | 0 (0.0%) | 0 (0.0%) |
| 11:00 AM to 11:59 AM | 0 (0.0%) | 0 (0.0%) |
| 12:00 PM to 3:59 PM | 38 (15.1%) | 0 (0.0%) |
| 4:00 PM to 11:59 PM | 0 (0.0%) | 0 (0.0%) |
| Total | 252 (100.0%) | 138 (100.0%) |
Housing Occupancy in El Ojo
Occupancy by Ownership in El Ojo
Of the total 554 dwellings in El Ojo, owner-occupied units account for 388 (70.0%), while renter-occupied units make up 166 (30.0%).
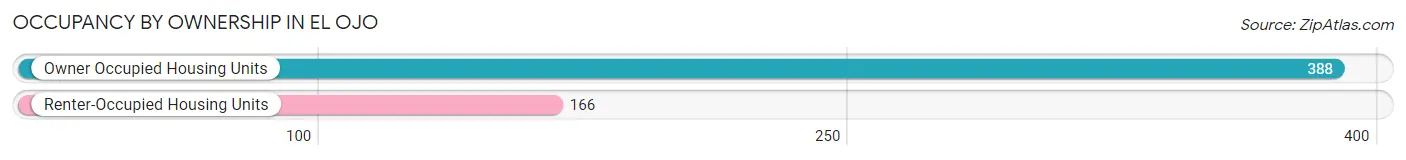
| Occupancy | # Housing Units | % Housing Units |
| Owner Occupied Housing Units | 388 | 70.0% |
| Renter-Occupied Housing Units | 166 | 30.0% |
| Total Occupied Housing Units | 554 | 100.0% |
Occupancy by Household Size in El Ojo
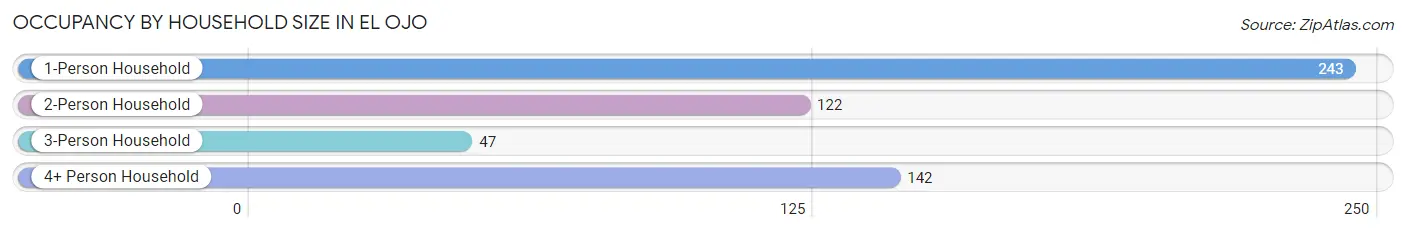
| Household Size | # Housing Units | % Housing Units |
| 1-Person Household | 243 | 43.9% |
| 2-Person Household | 122 | 22.0% |
| 3-Person Household | 47 | 8.5% |
| 4+ Person Household | 142 | 25.6% |
| Total Housing Units | 554 | 100.0% |
Occupancy by Ownership by Household Size in El Ojo
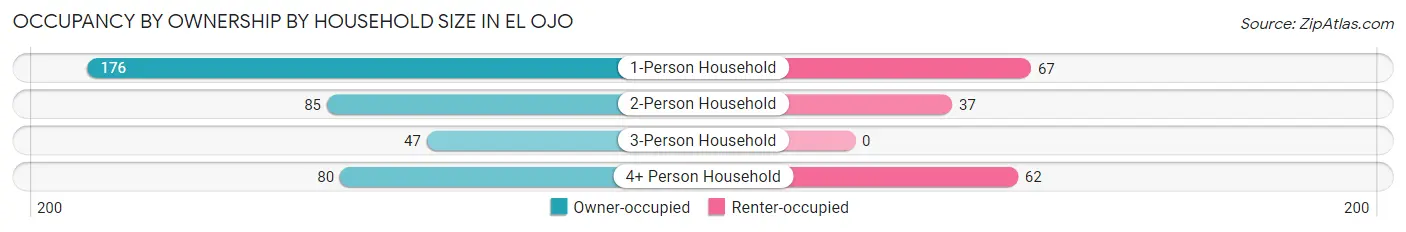
| Household Size | Owner-occupied | Renter-occupied |
| 1-Person Household | 176 (72.4%) | 67 (27.6%) |
| 2-Person Household | 85 (69.7%) | 37 (30.3%) |
| 3-Person Household | 47 (100.0%) | 0 (0.0%) |
| 4+ Person Household | 80 (56.3%) | 62 (43.7%) |
| Total Housing Units | 388 (70.0%) | 166 (30.0%) |
Occupancy by Educational Attainment in El Ojo
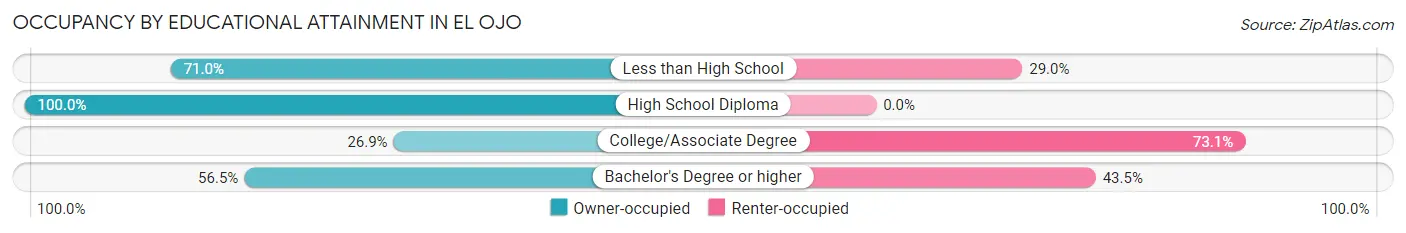
| Household Size | Owner-occupied | Renter-occupied |
| Less than High School | 76 (71.0%) | 31 (29.0%) |
| High School Diploma | 228 (100.0%) | 0 (0.0%) |
| College/Associate Degree | 36 (26.9%) | 98 (73.1%) |
| Bachelor's Degree or higher | 48 (56.5%) | 37 (43.5%) |
Occupancy by Age of Householder in El Ojo
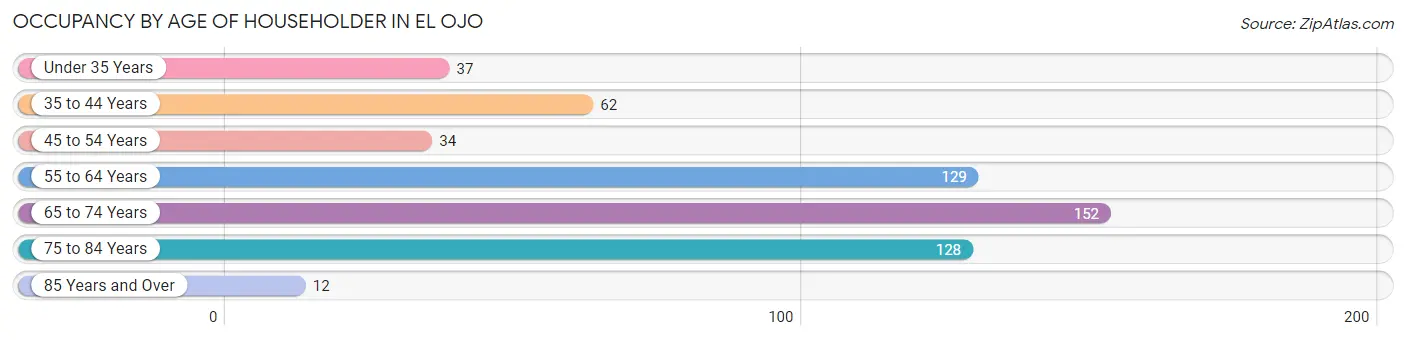
| Age Bracket | # Households | % Households |
| Under 35 Years | 37 | 6.7% |
| 35 to 44 Years | 62 | 11.2% |
| 45 to 54 Years | 34 | 6.1% |
| 55 to 64 Years | 129 | 23.3% |
| 65 to 74 Years | 152 | 27.4% |
| 75 to 84 Years | 128 | 23.1% |
| 85 Years and Over | 12 | 2.2% |
| Total | 554 | 100.0% |
Housing Finances in El Ojo
Median Income by Occupancy in El Ojo
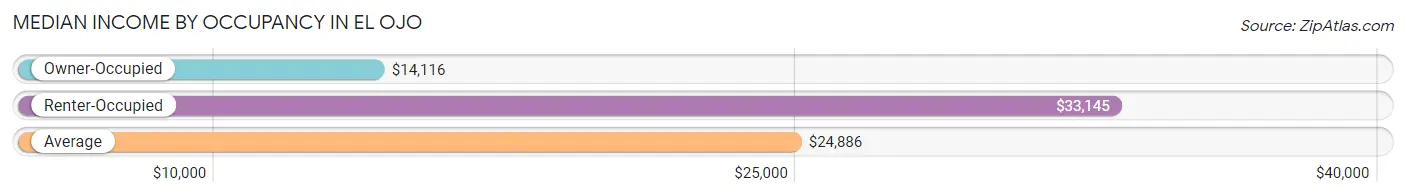
| Occupancy Type | # Households | Median Income |
| Owner-Occupied | 388 (70.0%) | $14,116 |
| Renter-Occupied | 166 (30.0%) | $33,145 |
| Average | 554 (100.0%) | $24,886 |
Occupancy by Householder Income Bracket in El Ojo
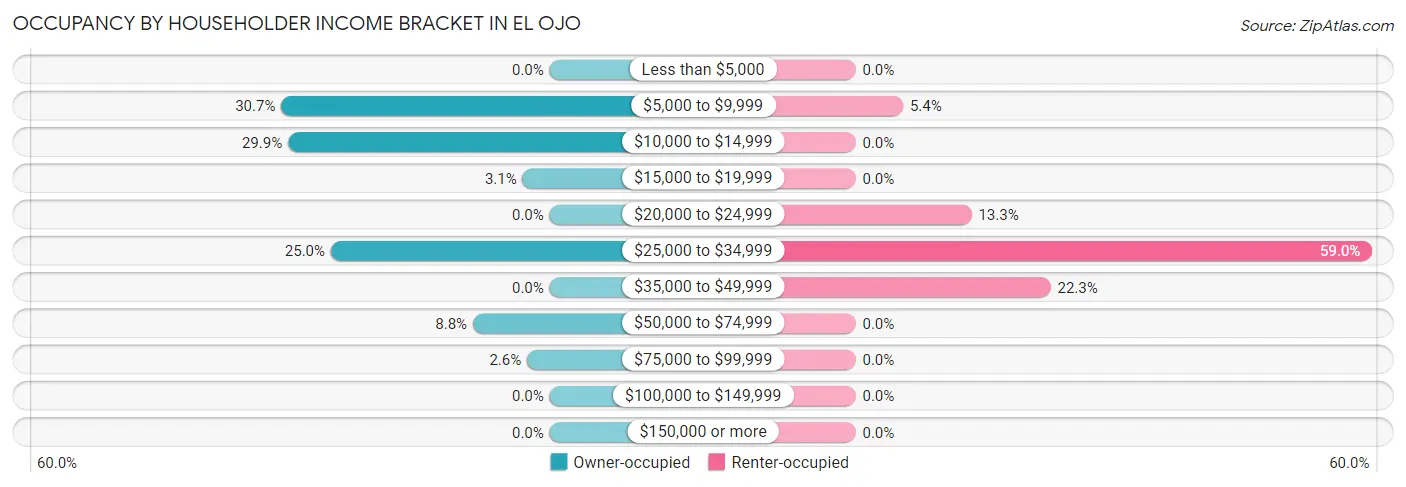
| Income Bracket | Owner-occupied | Renter-occupied |
| Less than $5,000 | 0 (0.0%) | 0 (0.0%) |
| $5,000 to $9,999 | 119 (30.7%) | 9 (5.4%) |
| $10,000 to $14,999 | 116 (29.9%) | 0 (0.0%) |
| $15,000 to $19,999 | 12 (3.1%) | 0 (0.0%) |
| $20,000 to $24,999 | 0 (0.0%) | 22 (13.3%) |
| $25,000 to $34,999 | 97 (25.0%) | 98 (59.0%) |
| $35,000 to $49,999 | 0 (0.0%) | 37 (22.3%) |
| $50,000 to $74,999 | 34 (8.8%) | 0 (0.0%) |
| $75,000 to $99,999 | 10 (2.6%) | 0 (0.0%) |
| $100,000 to $149,999 | 0 (0.0%) | 0 (0.0%) |
| $150,000 or more | 0 (0.0%) | 0 (0.0%) |
| Total | 388 (100.0%) | 166 (100.0%) |
Monthly Housing Cost Tiers in El Ojo
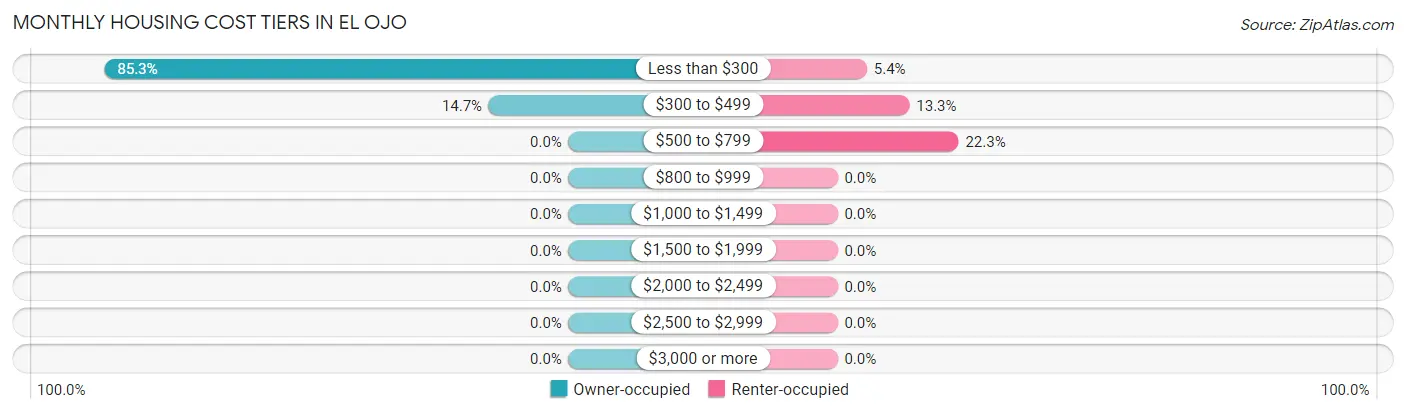
| Monthly Cost | Owner-occupied | Renter-occupied |
| Less than $300 | 331 (85.3%) | 9 (5.4%) |
| $300 to $499 | 57 (14.7%) | 22 (13.3%) |
| $500 to $799 | 0 (0.0%) | 37 (22.3%) |
| $800 to $999 | 0 (0.0%) | 0 (0.0%) |
| $1,000 to $1,499 | 0 (0.0%) | 0 (0.0%) |
| $1,500 to $1,999 | 0 (0.0%) | 0 (0.0%) |
| $2,000 to $2,499 | 0 (0.0%) | 0 (0.0%) |
| $2,500 to $2,999 | 0 (0.0%) | 0 (0.0%) |
| $3,000 or more | 0 (0.0%) | 0 (0.0%) |
| Total | 388 (100.0%) | 166 (100.0%) |
Physical Housing Characteristics in El Ojo
Housing Structures in El Ojo
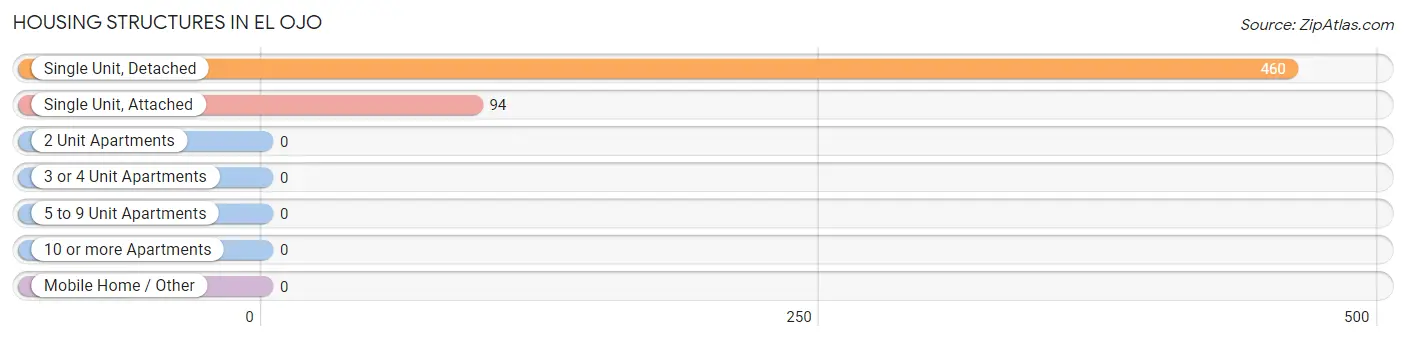
| Structure Type | # Housing Units | % Housing Units |
| Single Unit, Detached | 460 | 83.0% |
| Single Unit, Attached | 94 | 17.0% |
| 2 Unit Apartments | 0 | 0.0% |
| 3 or 4 Unit Apartments | 0 | 0.0% |
| 5 to 9 Unit Apartments | 0 | 0.0% |
| 10 or more Apartments | 0 | 0.0% |
| Mobile Home / Other | 0 | 0.0% |
| Total | 554 | 100.0% |
Housing Structures by Occupancy in El Ojo
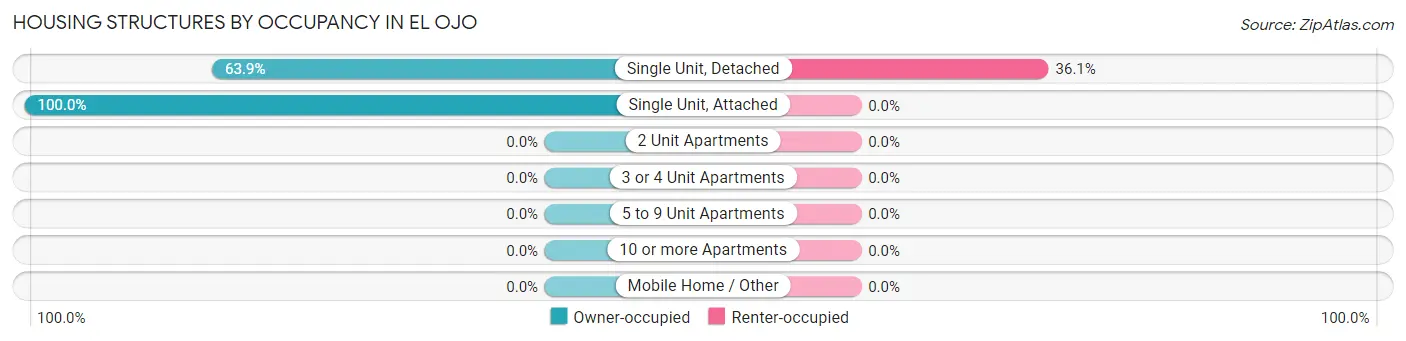
| Structure Type | Owner-occupied | Renter-occupied |
| Single Unit, Detached | 294 (63.9%) | 166 (36.1%) |
| Single Unit, Attached | 94 (100.0%) | 0 (0.0%) |
| 2 Unit Apartments | 0 (0.0%) | 0 (0.0%) |
| 3 or 4 Unit Apartments | 0 (0.0%) | 0 (0.0%) |
| 5 to 9 Unit Apartments | 0 (0.0%) | 0 (0.0%) |
| 10 or more Apartments | 0 (0.0%) | 0 (0.0%) |
| Mobile Home / Other | 0 (0.0%) | 0 (0.0%) |
| Total | 388 (70.0%) | 166 (30.0%) |
Housing Structures by Number of Rooms in El Ojo
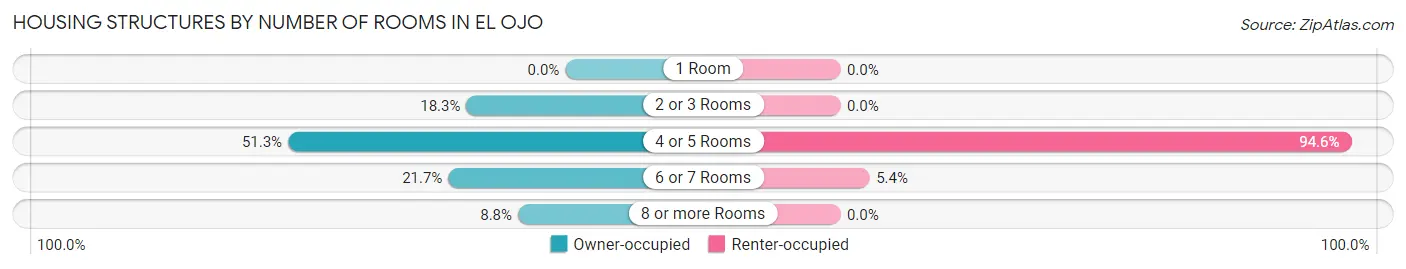
| Number of Rooms | Owner-occupied | Renter-occupied |
| 1 Room | 0 (0.0%) | 0 (0.0%) |
| 2 or 3 Rooms | 71 (18.3%) | 0 (0.0%) |
| 4 or 5 Rooms | 199 (51.3%) | 157 (94.6%) |
| 6 or 7 Rooms | 84 (21.6%) | 9 (5.4%) |
| 8 or more Rooms | 34 (8.8%) | 0 (0.0%) |
| Total | 388 (100.0%) | 166 (100.0%) |
Housing Structure by Heating Type in El Ojo
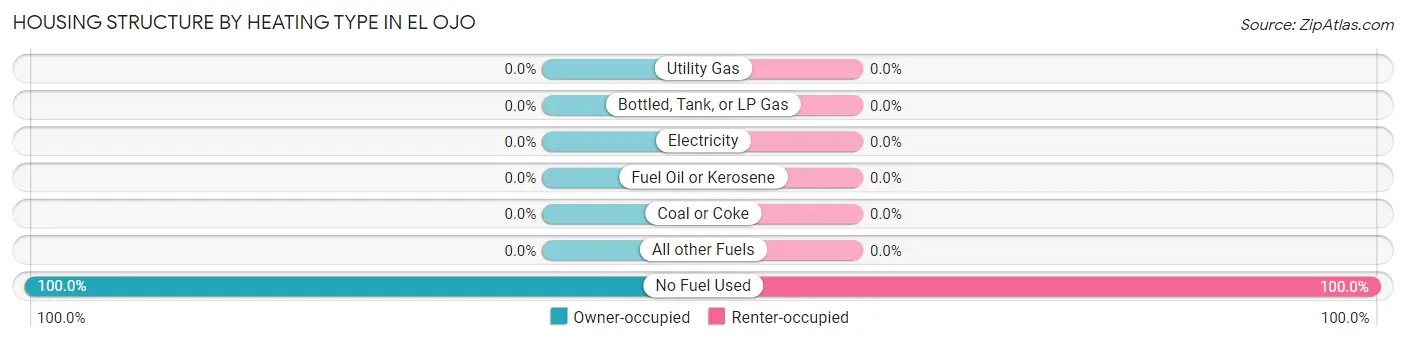
| Heating Type | Owner-occupied | Renter-occupied |
| Utility Gas | 0 (0.0%) | 0 (0.0%) |
| Bottled, Tank, or LP Gas | 0 (0.0%) | 0 (0.0%) |
| Electricity | 0 (0.0%) | 0 (0.0%) |
| Fuel Oil or Kerosene | 0 (0.0%) | 0 (0.0%) |
| Coal or Coke | 0 (0.0%) | 0 (0.0%) |
| All other Fuels | 0 (0.0%) | 0 (0.0%) |
| No Fuel Used | 388 (100.0%) | 166 (100.0%) |
| Total | 388 (100.0%) | 166 (100.0%) |
Household Vehicle Usage in El Ojo
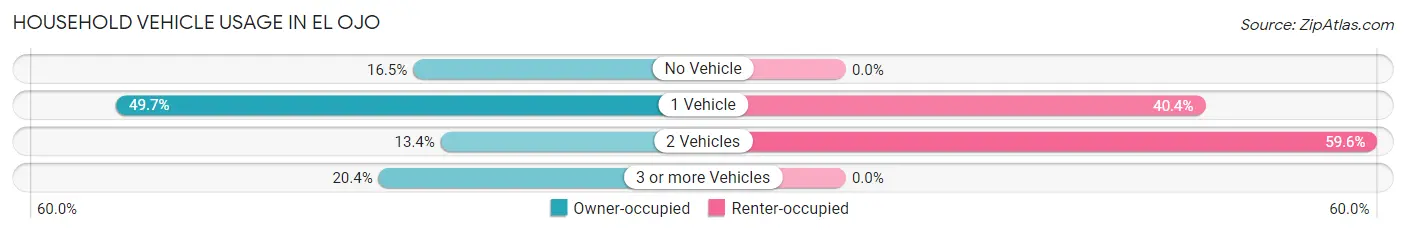
| Vehicles per Household | Owner-occupied | Renter-occupied |
| No Vehicle | 64 (16.5%) | 0 (0.0%) |
| 1 Vehicle | 193 (49.7%) | 67 (40.4%) |
| 2 Vehicles | 52 (13.4%) | 99 (59.6%) |
| 3 or more Vehicles | 79 (20.4%) | 0 (0.0%) |
| Total | 388 (100.0%) | 166 (100.0%) |
Real Estate & Mortgages in El Ojo
Real Estate and Mortgage Overview in El Ojo
| Characteristic | Without Mortgage | With Mortgage |
| Housing Units | 388 | 0 |
| Median Property Value | $96,900 | $0 |
| Median Household Income | $14,116 | $0 |
| Monthly Housing Costs | $174 | $0 |
| Real Estate Taxes | - | - |
Property Value by Mortgage Status in El Ojo
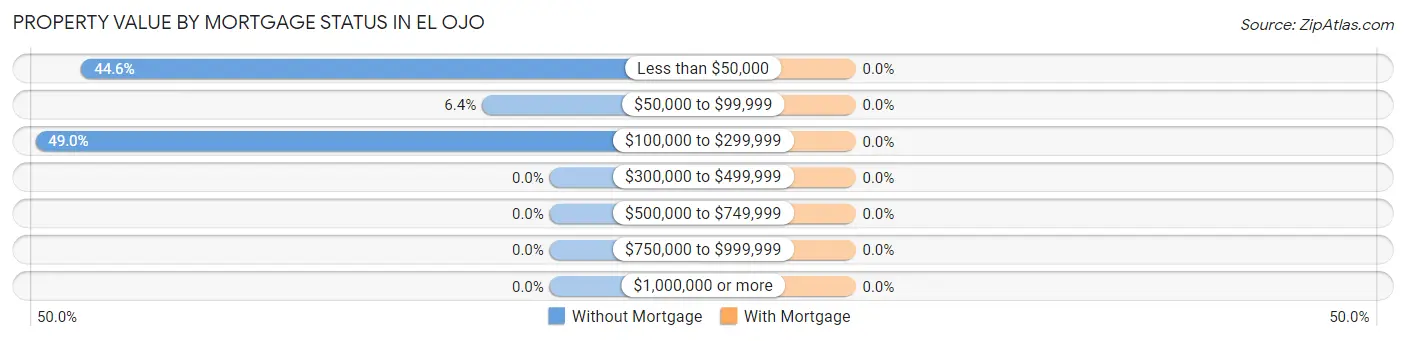
| Property Value | Without Mortgage | With Mortgage |
| Less than $50,000 | 173 (44.6%) | 0 (0.0%) |
| $50,000 to $99,999 | 25 (6.4%) | 0 (0.0%) |
| $100,000 to $299,999 | 190 (49.0%) | 0 (0.0%) |
| $300,000 to $499,999 | 0 (0.0%) | 0 (0.0%) |
| $500,000 to $749,999 | 0 (0.0%) | 0 (0.0%) |
| $750,000 to $999,999 | 0 (0.0%) | 0 (0.0%) |
| $1,000,000 or more | 0 (0.0%) | 0 (0.0%) |
| Total | 388 (100.0%) | 0 (0.0%) |
Household Income by Mortgage Status in El Ojo
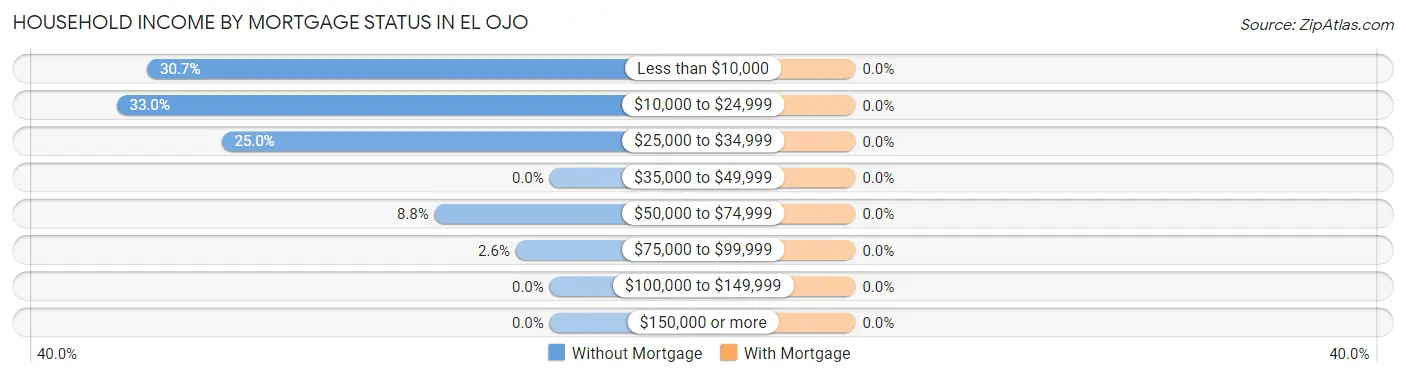
| Household Income | Without Mortgage | With Mortgage |
| Less than $10,000 | 119 (30.7%) | 0 (0.0%) |
| $10,000 to $24,999 | 128 (33.0%) | 0 (0.0%) |
| $25,000 to $34,999 | 97 (25.0%) | 0 (0.0%) |
| $35,000 to $49,999 | 0 (0.0%) | 0 (0.0%) |
| $50,000 to $74,999 | 34 (8.8%) | 0 (0.0%) |
| $75,000 to $99,999 | 10 (2.6%) | 0 (0.0%) |
| $100,000 to $149,999 | 0 (0.0%) | 0 (0.0%) |
| $150,000 or more | 0 (0.0%) | 0 (0.0%) |
| Total | 388 (100.0%) | 0 (0.0%) |
Property Value to Household Income Ratio in El Ojo
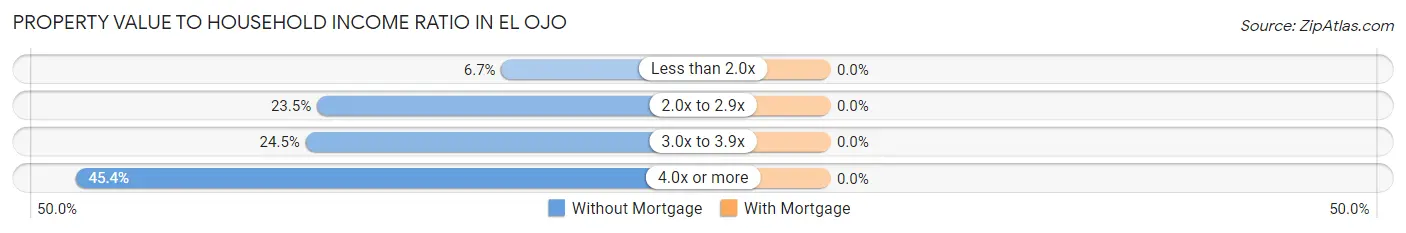
| Value-to-Income Ratio | Without Mortgage | With Mortgage |
| Less than 2.0x | 26 (6.7%) | 0 (0.0%) |
| 2.0x to 2.9x | 91 (23.4%) | 0 (0.0%) |
| 3.0x to 3.9x | 95 (24.5%) | 0 (0.0%) |
| 4.0x or more | 176 (45.4%) | 0 (0.0%) |
| Total | 388 (100.0%) | 0 (0.0%) |
Real Estate Taxes by Mortgage Status in El Ojo

| Property Taxes | Without Mortgage | With Mortgage |
| Less than $800 | 0 (0.0%) | 0 (0.0%) |
| $800 to $1,499 | 0 (0.0%) | 0 (0.0%) |
| $800 to $1,499 | 0 (0.0%) | 0 (0.0%) |
| Total | 388 (100.0%) | 0 (0.0%) |
Health & Disability in El Ojo
Health Insurance Coverage by Age in El Ojo
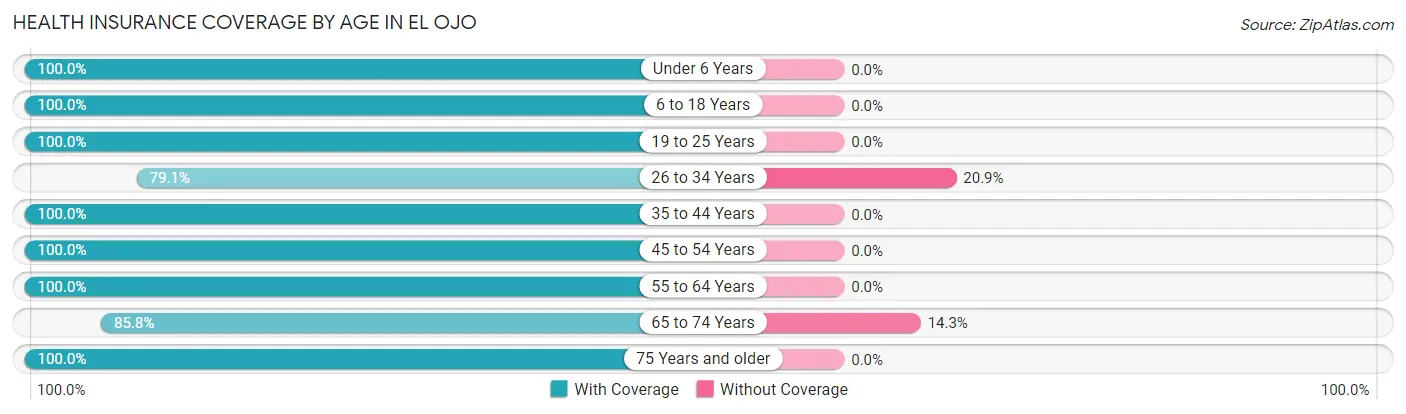
| Age Bracket | With Coverage | Without Coverage |
| Under 6 Years | 42 (100.0%) | 0 (0.0%) |
| 6 to 18 Years | 209 (100.0%) | 0 (0.0%) |
| 19 to 25 Years | 167 (100.0%) | 0 (0.0%) |
| 26 to 34 Years | 140 (79.1%) | 37 (20.9%) |
| 35 to 44 Years | 123 (100.0%) | 0 (0.0%) |
| 45 to 54 Years | 328 (100.0%) | 0 (0.0%) |
| 55 to 64 Years | 129 (100.0%) | 0 (0.0%) |
| 65 to 74 Years | 301 (85.8%) | 50 (14.2%) |
| 75 Years and older | 225 (100.0%) | 0 (0.0%) |
| Total | 1,664 (95.0%) | 87 (5.0%) |
Health Insurance Coverage by Citizenship Status in El Ojo

| Citizenship Status | With Coverage | Without Coverage |
| Native Born | 42 (100.0%) | 0 (0.0%) |
| Foreign Born, Citizen | 209 (100.0%) | 0 (0.0%) |
| Foreign Born, not a Citizen | 167 (100.0%) | 0 (0.0%) |
Health Insurance Coverage by Household Income in El Ojo
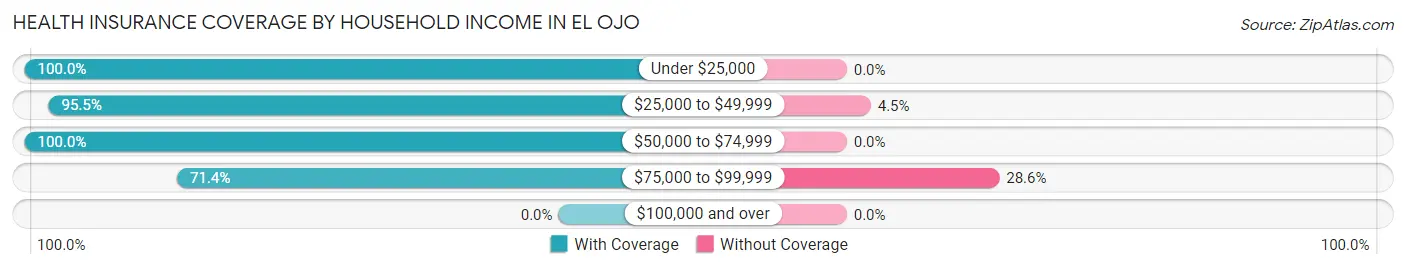
| Household Income | With Coverage | Without Coverage |
| Under $25,000 | 448 (100.0%) | 0 (0.0%) |
| $25,000 to $49,999 | 786 (95.5%) | 37 (4.5%) |
| $50,000 to $74,999 | 305 (100.0%) | 0 (0.0%) |
| $75,000 to $99,999 | 125 (71.4%) | 50 (28.6%) |
| $100,000 and over | 0 (0.0%) | 0 (0.0%) |
Public vs Private Health Insurance Coverage by Age in El Ojo
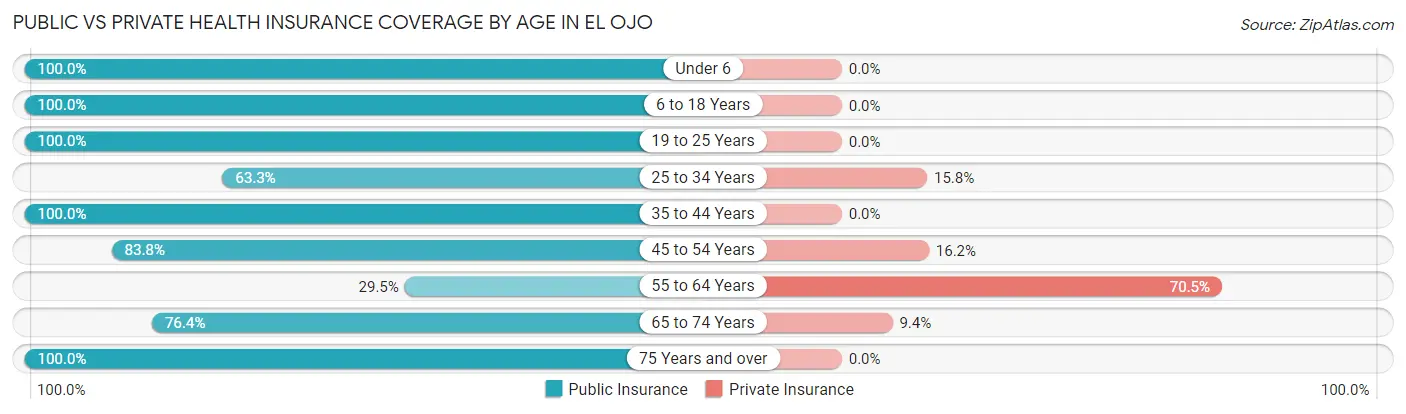
| Age Bracket | Public Insurance | Private Insurance |
| Under 6 | 42 (100.0%) | 0 (0.0%) |
| 6 to 18 Years | 209 (100.0%) | 0 (0.0%) |
| 19 to 25 Years | 167 (100.0%) | 0 (0.0%) |
| 25 to 34 Years | 112 (63.3%) | 28 (15.8%) |
| 35 to 44 Years | 123 (100.0%) | 0 (0.0%) |
| 45 to 54 Years | 275 (83.8%) | 53 (16.2%) |
| 55 to 64 Years | 38 (29.5%) | 91 (70.5%) |
| 65 to 74 Years | 268 (76.3%) | 33 (9.4%) |
| 75 Years and over | 225 (100.0%) | 0 (0.0%) |
| Total | 1,459 (83.3%) | 205 (11.7%) |
Disability Status by Sex by Age in El Ojo
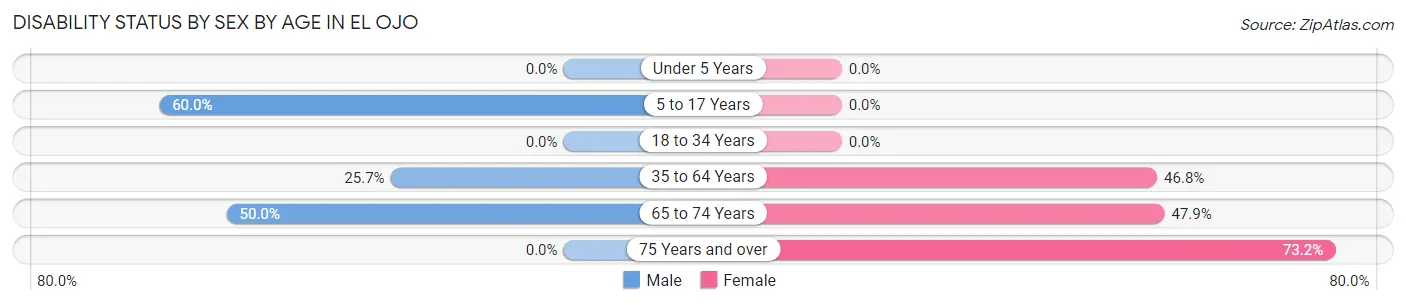
| Age Bracket | Male | Female |
| Under 5 Years | 0 (0.0%) | 0 (0.0%) |
| 5 to 17 Years | 54 (60.0%) | 0 (0.0%) |
| 18 to 34 Years | 0 (0.0%) | 0 (0.0%) |
| 35 to 64 Years | 76 (25.7%) | 133 (46.8%) |
| 65 to 74 Years | 43 (50.0%) | 127 (47.9%) |
| 75 Years and over | 0 (0.0%) | 93 (73.2%) |
Disability Class by Sex by Age in El Ojo
Disability Class: Hearing Difficulty

| Age Bracket | Male | Female |
| Under 5 Years | 0 (0.0%) | 0 (0.0%) |
| 5 to 17 Years | 0 (0.0%) | 0 (0.0%) |
| 18 to 34 Years | 0 (0.0%) | 0 (0.0%) |
| 35 to 64 Years | 0 (0.0%) | 0 (0.0%) |
| 65 to 74 Years | 14 (16.3%) | 0 (0.0%) |
| 75 Years and over | 0 (0.0%) | 41 (32.3%) |
Disability Class: Vision Difficulty
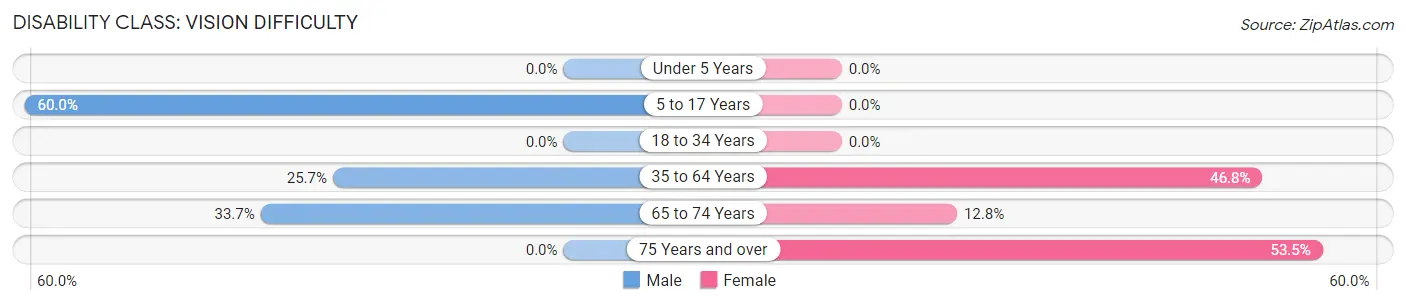
| Age Bracket | Male | Female |
| Under 5 Years | 0 (0.0%) | 0 (0.0%) |
| 5 to 17 Years | 54 (60.0%) | 0 (0.0%) |
| 18 to 34 Years | 0 (0.0%) | 0 (0.0%) |
| 35 to 64 Years | 76 (25.7%) | 133 (46.8%) |
| 65 to 74 Years | 29 (33.7%) | 34 (12.8%) |
| 75 Years and over | 0 (0.0%) | 68 (53.5%) |
Disability Class: Cognitive Difficulty
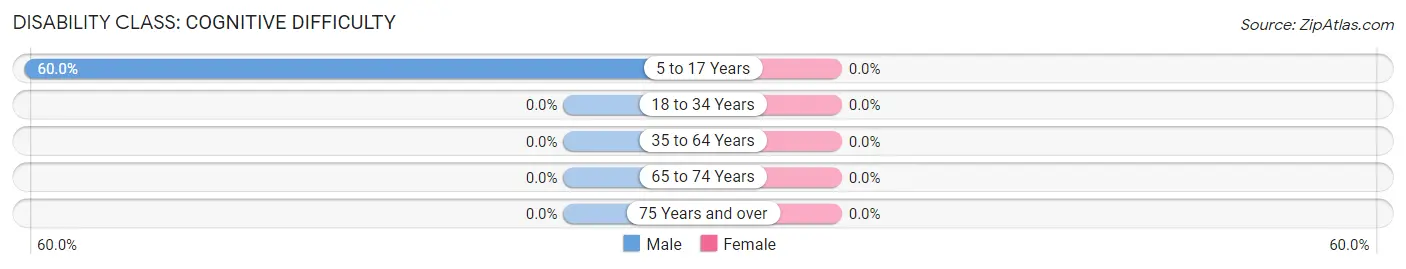
| Age Bracket | Male | Female |
| 5 to 17 Years | 54 (60.0%) | 0 (0.0%) |
| 18 to 34 Years | 0 (0.0%) | 0 (0.0%) |
| 35 to 64 Years | 0 (0.0%) | 0 (0.0%) |
| 65 to 74 Years | 0 (0.0%) | 0 (0.0%) |
| 75 Years and over | 0 (0.0%) | 0 (0.0%) |
Disability Class: Ambulatory Difficulty
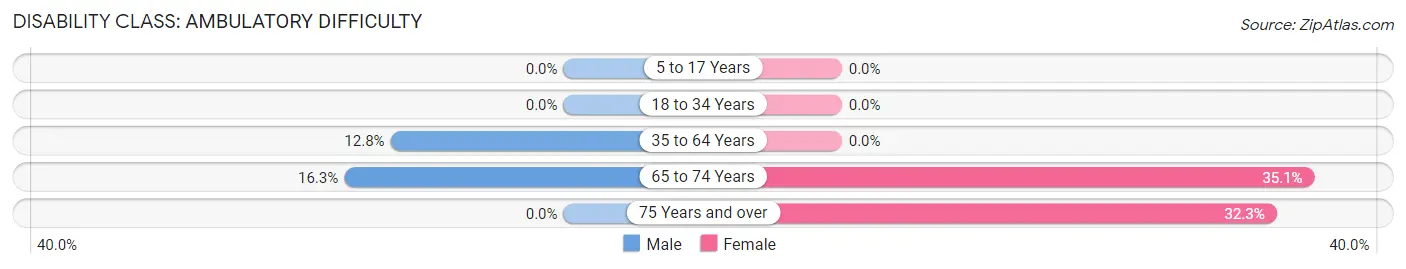
| Age Bracket | Male | Female |
| 5 to 17 Years | 0 (0.0%) | 0 (0.0%) |
| 18 to 34 Years | 0 (0.0%) | 0 (0.0%) |
| 35 to 64 Years | 38 (12.8%) | 0 (0.0%) |
| 65 to 74 Years | 14 (16.3%) | 93 (35.1%) |
| 75 Years and over | 0 (0.0%) | 41 (32.3%) |
Disability Class: Self-Care Difficulty
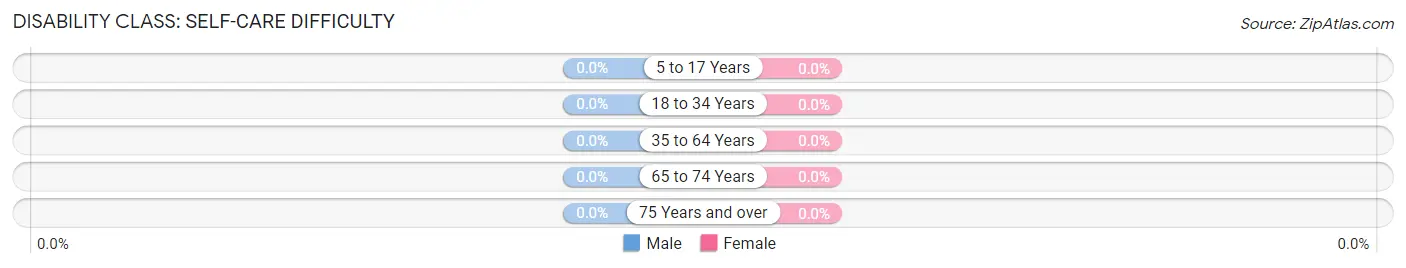
| Age Bracket | Male | Female |
| 5 to 17 Years | 0 (0.0%) | 0 (0.0%) |
| 18 to 34 Years | 0 (0.0%) | 0 (0.0%) |
| 35 to 64 Years | 0 (0.0%) | 0 (0.0%) |
| 65 to 74 Years | 0 (0.0%) | 0 (0.0%) |
| 75 Years and over | 0 (0.0%) | 0 (0.0%) |
Technology Access in El Ojo
Computing Device Access in El Ojo
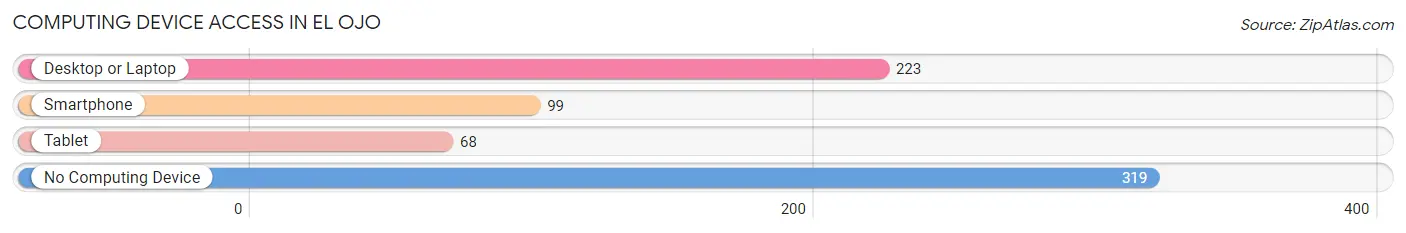
| Device Type | # Households | % Households |
| Desktop or Laptop | 223 | 40.3% |
| Smartphone | 99 | 17.9% |
| Tablet | 68 | 12.3% |
| No Computing Device | 319 | 57.6% |
| Total | 554 | 100.0% |
Internet Access in El Ojo
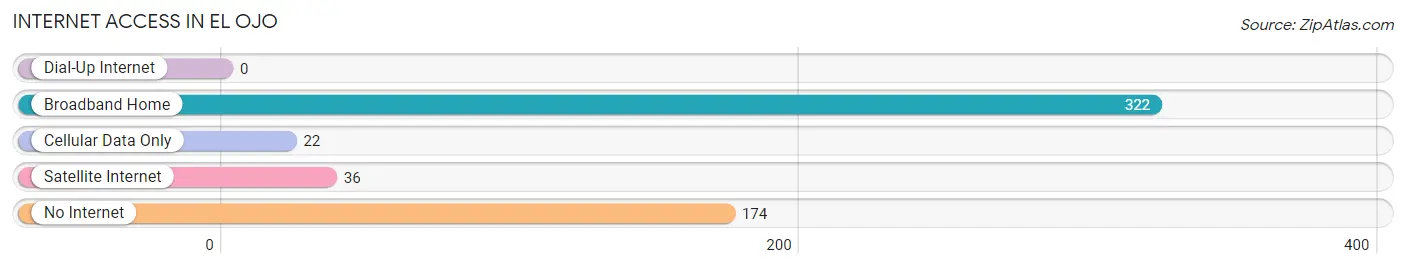
| Internet Type | # Households | % Households |
| Dial-Up Internet | 0 | 0.0% |
| Broadband Home | 322 | 58.1% |
| Cellular Data Only | 22 | 4.0% |
| Satellite Internet | 36 | 6.5% |
| No Internet | 174 | 31.4% |
| Total | 554 | 100.0% |
El Ojo Summary
El Ojo is a small town located in the municipality of San Germán, Puerto Rico. It is situated in the southwestern part of the island, about 20 miles from the city of Mayagüez. El Ojo is a rural community with a population of approximately 1,000 people.
History
El Ojo was founded in the late 19th century by a group of settlers from the nearby town of San Germán. The town was originally known as “El Ojo de San Germán”, which translates to “The Eye of San Germán”. The name was chosen because the town was located at the highest point of the municipality, providing a view of the surrounding area.
The town was officially established in 1891 and was initially populated by farmers and ranchers. The main crops grown in the area were coffee, sugar cane, and tobacco. In the early 20th century, the town began to grow and develop, with the construction of a school, a church, and a post office.
Geography
El Ojo is located in the southwestern part of Puerto Rico, in the municipality of San Germán. It is situated at an elevation of approximately 1,000 feet above sea level. The town is surrounded by lush green hills and mountains, and is located near the Caribbean Sea.
The climate in El Ojo is tropical, with temperatures ranging from the mid-70s to the mid-80s Fahrenheit. The town receives an average of 60 inches of rain per year, with the majority of the rainfall occurring during the months of May through October.
Economy
The economy of El Ojo is primarily based on agriculture. The main crops grown in the area are coffee, sugar cane, and tobacco. The town also has a small manufacturing sector, which produces furniture, clothing, and other goods.
In addition to agriculture and manufacturing, El Ojo also has a thriving tourism industry. The town is home to several small hotels and restaurants, as well as a number of attractions, such as the El Ojo Waterfall and the El Ojo Cave.
Demographics
As of the 2010 census, El Ojo had a population of 1,000 people. The majority of the population is of Puerto Rican descent, with a small percentage of African and European ancestry. The town has a median age of 33 years, and the median household income is $20,000.
El Ojo is a predominantly Catholic town, with the majority of the population belonging to the Roman Catholic Church. The town also has a small Protestant community, as well as a small Jewish population.
Conclusion
El Ojo is a small town located in the municipality of San Germán, Puerto Rico. It is a rural community with a population of approximately 1,000 people. The town was founded in the late 19th century and is primarily known for its agricultural economy. The main crops grown in the area are coffee, sugar cane, and tobacco. El Ojo also has a thriving tourism industry, with several small hotels and restaurants, as well as a number of attractions. The majority of the population is of Puerto Rican descent, with a small percentage of African and European ancestry. The town is predominantly Catholic, with the majority of the population belonging to the Roman Catholic Church.
Common Questions
What is Per Capita Income in El Ojo?
Per Capita income in El Ojo is $8,819.
What is the Median Family Income in El Ojo?
Median Family Income in El Ojo is $30,222.
What is the Median Household income in El Ojo?
Median Household Income in El Ojo is $24,886.
What is Inequality or Gini Index in El Ojo?
Inequality or Gini Index in El Ojo is 0.34.
What is the Total Population of El Ojo?
Total Population of El Ojo is 1,751.
What is the Total Male Population of El Ojo?
Total Male Population of El Ojo is 782.
What is the Total Female Population of El Ojo?
Total Female Population of El Ojo is 969.
What is the Ratio of Males per 100 Females in El Ojo?
There are 80.70 Males per 100 Females in El Ojo.
What is the Ratio of Females per 100 Males in El Ojo?
There are 123.91 Females per 100 Males in El Ojo.
What is the Median Population Age in El Ojo?
Median Population Age in El Ojo is 48.9 Years.
What is the Average Family Size in El Ojo
Average Family Size in El Ojo is 4.7 People.
What is the Average Household Size in El Ojo
Average Household Size in El Ojo is 3.2 People.
How Large is the Labor Force in El Ojo?
There are 669 People in the Labor Forcein in El Ojo.
What is the Percentage of People in the Labor Force in El Ojo?
39.7% of People are in the Labor Force in El Ojo.