El Negro, PR Map & Demographics
El Negro Map
El Negro Overview
$12,811
PER CAPITA INCOME
$30,057
AVG FAMILY INCOME
$24,219
AVG HOUSEHOLD INCOME
20.2%
WAGE / INCOME GAP [ % ]
79.8¢/ $1
WAGE / INCOME GAP [ $ ]
0.48
INEQUALITY / GINI INDEX
1,262
TOTAL POPULATION
594
MALE POPULATION
668
FEMALE POPULATION
88.92
MALES / 100 FEMALES
112.46
FEMALES / 100 MALES
42.3
MEDIAN AGE
3.6
AVG FAMILY SIZE
2.9
AVG HOUSEHOLD SIZE
518
LABOR FORCE [ PEOPLE ]
50.0%
PERCENT IN LABOR FORCE
24.7%
UNEMPLOYMENT RATE
Income in El Negro
Income Overview in El Negro
Per Capita Income in El Negro is $12,811, while median incomes of families and households are $30,057 and $24,219 respectively.
| Characteristic | Number | Measure |
| Per Capita Income | 1,262 | $12,811 |
| Median Family Income | 303 | $30,057 |
| Mean Family Income | 303 | $39,202 |
| Median Household Income | 438 | $24,219 |
| Mean Household Income | 438 | $32,577 |
| Income Deficit | 303 | $0 |
| Wage / Income Gap (%) | 1,262 | 20.17% |
| Wage / Income Gap ($) | 1,262 | 79.83¢ per $1 |
| Gini / Inequality Index | 1,262 | 0.48 |
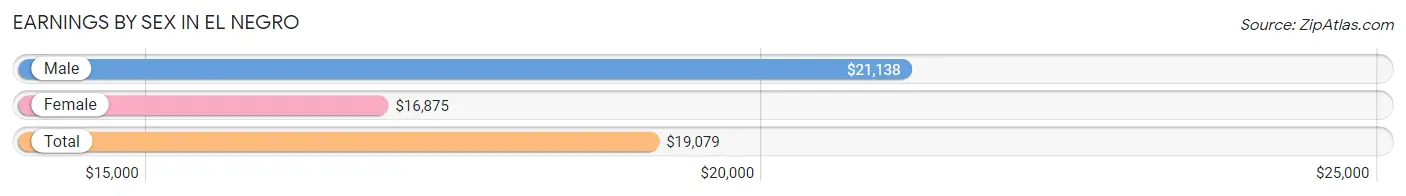
Earnings by Sex in El Negro
Average Earnings in El Negro are $19,079, $21,138 for men and $16,875 for women, a difference of 20.2%.
| Sex | Number | Average Earnings |
| Male | 313 (71.5%) | $21,138 |
| Female | 125 (28.5%) | $16,875 |
| Total | 438 (100.0%) | $19,079 |
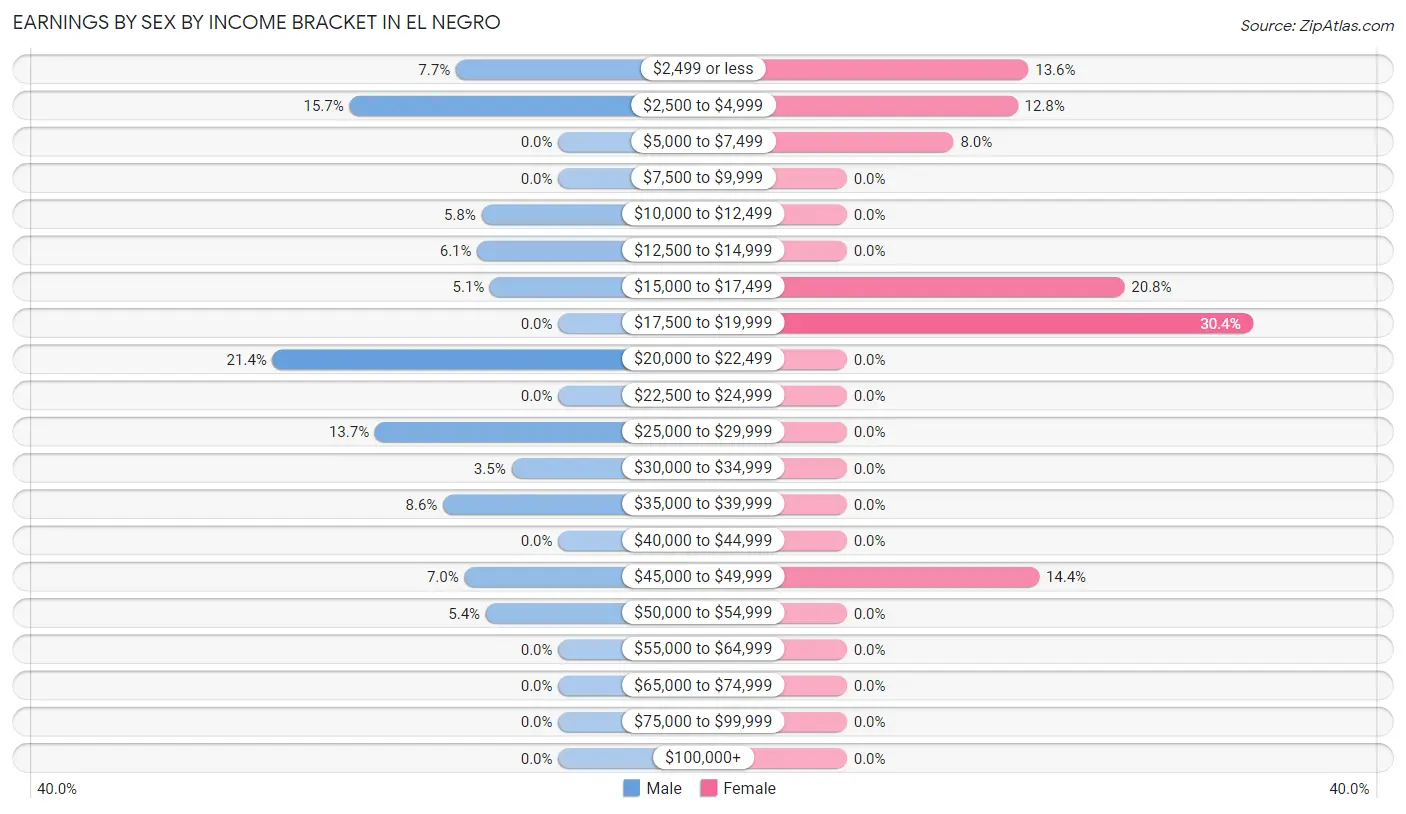
Earnings by Sex by Income Bracket in El Negro
The most common earnings brackets in El Negro are $20,000 to $22,499 for men (67 | 21.4%) and $17,500 to $19,999 for women (38 | 30.4%).
| Income | Male | Female |
| $2,499 or less | 24 (7.7%) | 17 (13.6%) |
| $2,500 to $4,999 | 49 (15.7%) | 16 (12.8%) |
| $5,000 to $7,499 | 0 (0.0%) | 10 (8.0%) |
| $7,500 to $9,999 | 0 (0.0%) | 0 (0.0%) |
| $10,000 to $12,499 | 18 (5.8%) | 0 (0.0%) |
| $12,500 to $14,999 | 19 (6.1%) | 0 (0.0%) |
| $15,000 to $17,499 | 16 (5.1%) | 26 (20.8%) |
| $17,500 to $19,999 | 0 (0.0%) | 38 (30.4%) |
| $20,000 to $22,499 | 67 (21.4%) | 0 (0.0%) |
| $22,500 to $24,999 | 0 (0.0%) | 0 (0.0%) |
| $25,000 to $29,999 | 43 (13.7%) | 0 (0.0%) |
| $30,000 to $34,999 | 11 (3.5%) | 0 (0.0%) |
| $35,000 to $39,999 | 27 (8.6%) | 0 (0.0%) |
| $40,000 to $44,999 | 0 (0.0%) | 0 (0.0%) |
| $45,000 to $49,999 | 22 (7.0%) | 18 (14.4%) |
| $50,000 to $54,999 | 17 (5.4%) | 0 (0.0%) |
| $55,000 to $64,999 | 0 (0.0%) | 0 (0.0%) |
| $65,000 to $74,999 | 0 (0.0%) | 0 (0.0%) |
| $75,000 to $99,999 | 0 (0.0%) | 0 (0.0%) |
| $100,000+ | 0 (0.0%) | 0 (0.0%) |
| Total | 313 (100.0%) | 125 (100.0%) |
Earnings by Sex by Educational Attainment in El Negro
| Educational Attainment | Male Income | Female Income |
| Less than High School | - | - |
| High School Diploma | - | - |
| College or Associate's Degree | - | - |
| Bachelor's Degree | - | - |
| Graduate Degree | - | - |
| Total | $21,567 | $0 |
Family Income in El Negro
Family Income Brackets in El Negro
According to the El Negro family income data, there are 63 families falling into the $25,000 to $34,999 income range, which is the most common income bracket and makes up 20.8% of all families.
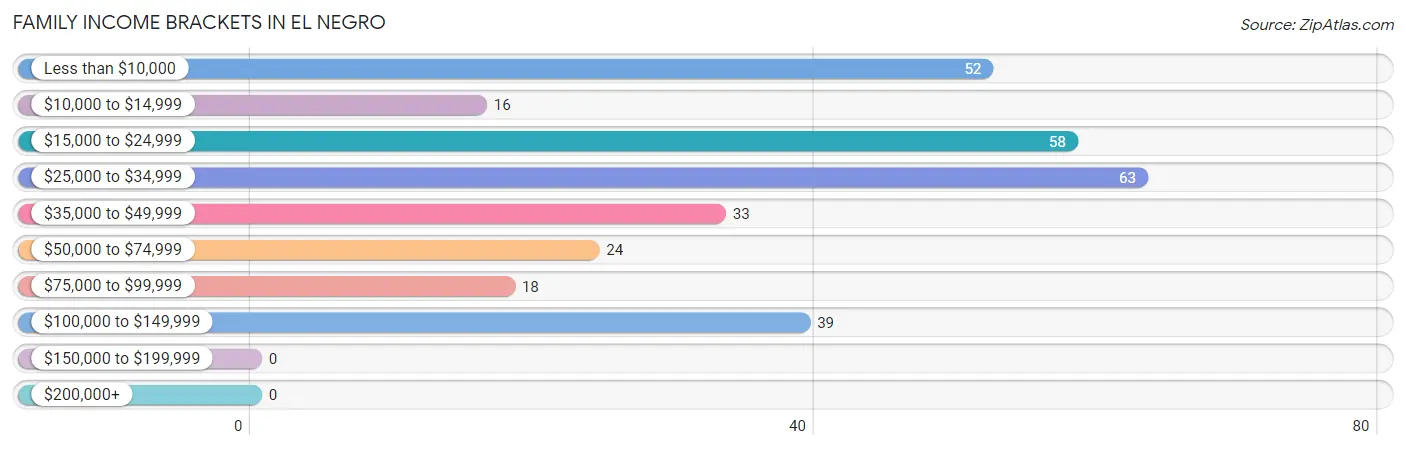
| Income Bracket | # Families | % Families |
| Less than $10,000 | 52 | 17.2% |
| $10,000 to $14,999 | 16 | 5.3% |
| $15,000 to $24,999 | 58 | 19.1% |
| $25,000 to $34,999 | 63 | 20.8% |
| $35,000 to $49,999 | 33 | 10.9% |
| $50,000 to $74,999 | 24 | 7.9% |
| $75,000 to $99,999 | 18 | 5.9% |
| $100,000 to $149,999 | 39 | 12.9% |
| $150,000 to $199,999 | 0 | 0.0% |
| $200,000+ | 0 | 0.0% |
Family Income by Famaliy Size in El Negro
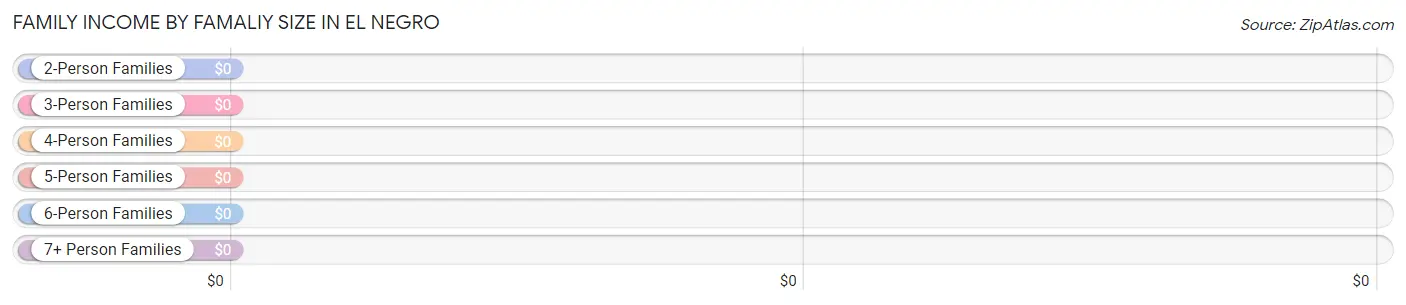
| Income Bracket | # Families | Median Income |
| 2-Person Families | 132 (43.6%) | $0 |
| 3-Person Families | 52 (17.2%) | $0 |
| 4-Person Families | 79 (26.1%) | $0 |
| 5-Person Families | 18 (5.9%) | $0 |
| 6-Person Families | 22 (7.3%) | $0 |
| 7+ Person Families | 0 (0.0%) | $0 |
| Total | 303 (100.0%) | $30,057 |
Family Income by Number of Earners in El Negro
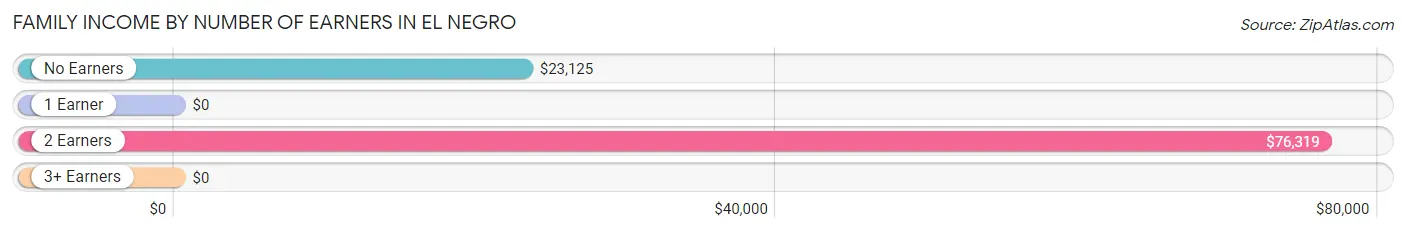
| Number of Earners | # Families | Median Income |
| No Earners | 152 (50.2%) | $23,125 |
| 1 Earner | 78 (25.7%) | $0 |
| 2 Earners | 51 (16.8%) | $76,319 |
| 3+ Earners | 22 (7.3%) | $0 |
| Total | 303 (100.0%) | $30,057 |
Household Income in El Negro
Household Income Brackets in El Negro
With 113 households falling in the category, the less than $10,000 income range is the most frequent in El Negro, accounting for 25.8% of all households.
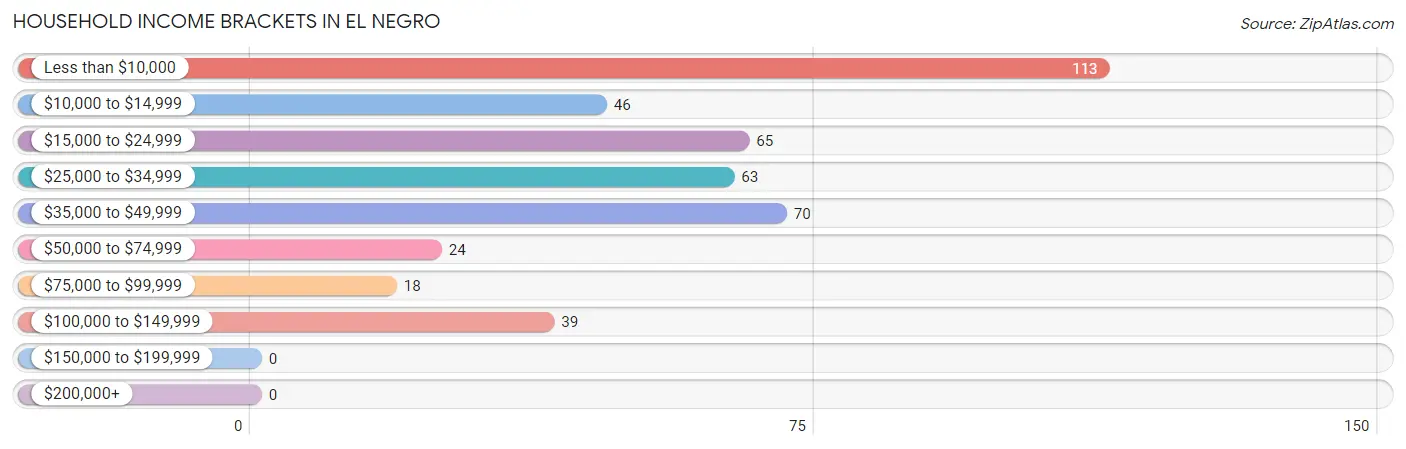
| Income Bracket | # Households | % Households |
| Less than $10,000 | 113 | 25.8% |
| $10,000 to $14,999 | 46 | 10.5% |
| $15,000 to $24,999 | 65 | 14.8% |
| $25,000 to $34,999 | 63 | 14.4% |
| $35,000 to $49,999 | 70 | 16.0% |
| $50,000 to $74,999 | 24 | 5.5% |
| $75,000 to $99,999 | 18 | 4.1% |
| $100,000 to $149,999 | 39 | 8.9% |
| $150,000 to $199,999 | 0 | 0.0% |
| $200,000+ | 0 | 0.0% |
Household Income by Householder Age in El Negro
The median household income in El Negro is $24,219, with the highest median household income of $33,750 found in the 15 to 24 years age bracket for the primary householder. A total of 36 households (8.2%) fall into this category. Meanwhile, the 25 to 44 years age bracket for the primary householder has the lowest median household income of $0, with 72 households (16.4%) in this group.
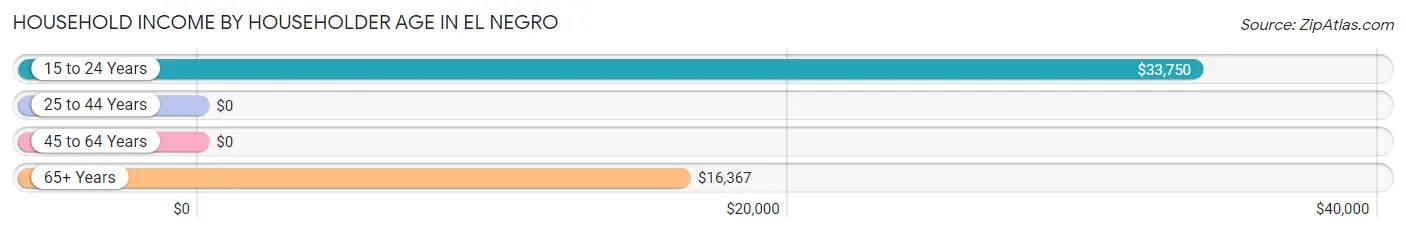
| Income Bracket | # Households | Median Income |
| 15 to 24 Years | 36 (8.2%) | $33,750 |
| 25 to 44 Years | 72 (16.4%) | $0 |
| 45 to 64 Years | 107 (24.4%) | $0 |
| 65+ Years | 223 (50.9%) | $16,367 |
| Total | 438 (100.0%) | $24,219 |
Poverty in El Negro
Income Below Poverty by Sex and Age in El Negro
With 38.9% poverty level for males and 62.4% for females among the residents of El Negro, under 5 year old males and 15 year old females are the most vulnerable to poverty, with 24 males (100.0%) and 47 females (100.0%) in their respective age groups living below the poverty level.
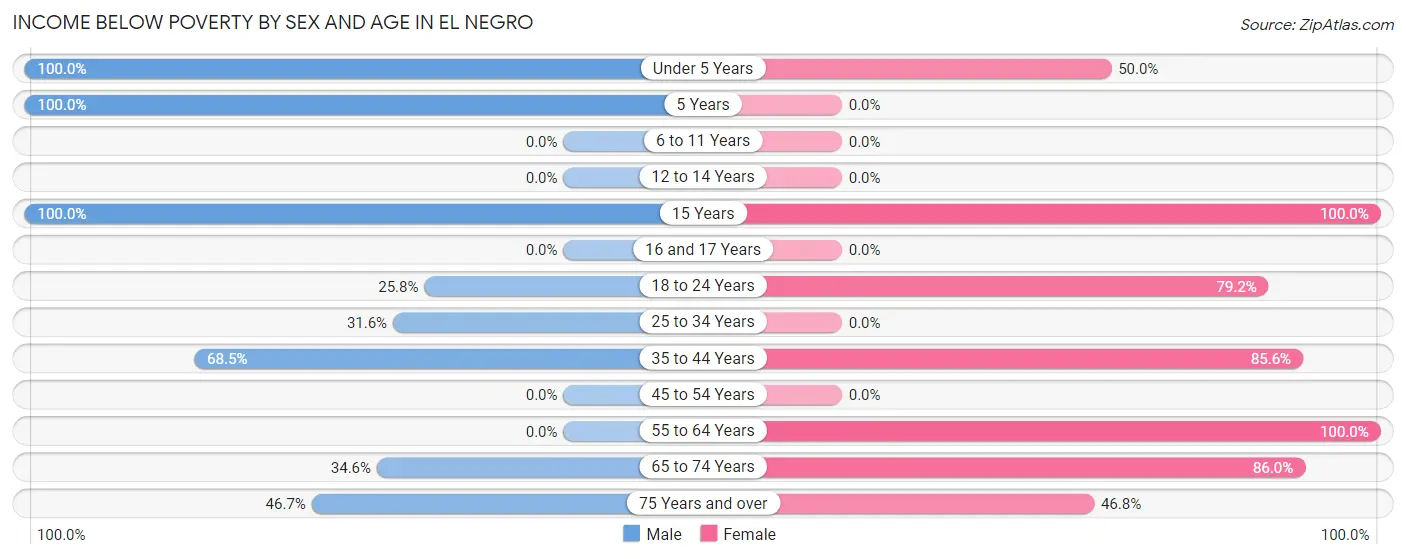
| Age Bracket | Male | Female |
| Under 5 Years | 24 (100.0%) | 34 (50.0%) |
| 5 Years | 30 (100.0%) | 0 (0.0%) |
| 6 to 11 Years | 0 (0.0%) | 0 (0.0%) |
| 12 to 14 Years | 0 (0.0%) | 0 (0.0%) |
| 15 Years | 19 (100.0%) | 47 (100.0%) |
| 16 and 17 Years | 0 (0.0%) | 0 (0.0%) |
| 18 to 24 Years | 24 (25.8%) | 61 (79.2%) |
| 25 to 34 Years | 31 (31.6%) | 0 (0.0%) |
| 35 to 44 Years | 37 (68.5%) | 95 (85.6%) |
| 45 to 54 Years | 0 (0.0%) | 0 (0.0%) |
| 55 to 64 Years | 0 (0.0%) | 22 (100.0%) |
| 65 to 74 Years | 9 (34.6%) | 92 (86.0%) |
| 75 Years and over | 57 (46.7%) | 66 (46.8%) |
| Total | 231 (38.9%) | 417 (62.4%) |
Income Above Poverty by Sex and Age in El Negro
According to the poverty statistics in El Negro, males aged 16 and 17 years and females aged 6 to 11 years are the age groups that are most secure financially, with 100.0% of males and 100.0% of females in these age groups living above the poverty line.
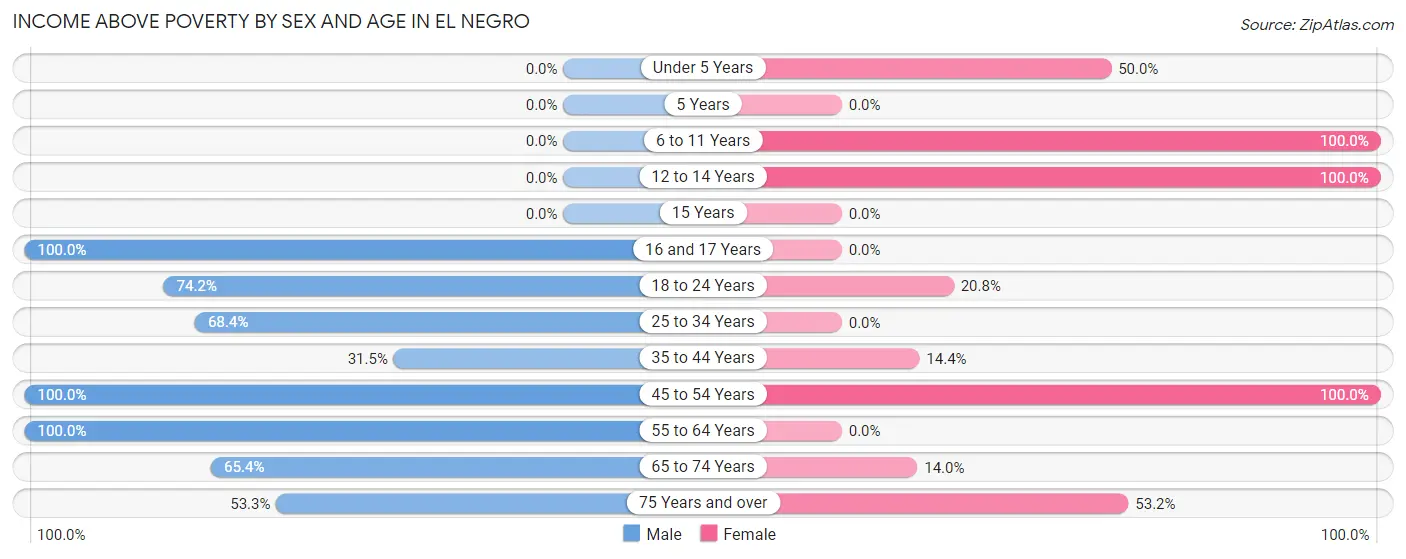
| Age Bracket | Male | Female |
| Under 5 Years | 0 (0.0%) | 34 (50.0%) |
| 5 Years | 0 (0.0%) | 0 (0.0%) |
| 6 to 11 Years | 0 (0.0%) | 18 (100.0%) |
| 12 to 14 Years | 0 (0.0%) | 20 (100.0%) |
| 15 Years | 0 (0.0%) | 0 (0.0%) |
| 16 and 17 Years | 13 (100.0%) | 0 (0.0%) |
| 18 to 24 Years | 69 (74.2%) | 16 (20.8%) |
| 25 to 34 Years | 67 (68.4%) | 0 (0.0%) |
| 35 to 44 Years | 17 (31.5%) | 16 (14.4%) |
| 45 to 54 Years | 64 (100.0%) | 57 (100.0%) |
| 55 to 64 Years | 51 (100.0%) | 0 (0.0%) |
| 65 to 74 Years | 17 (65.4%) | 15 (14.0%) |
| 75 Years and over | 65 (53.3%) | 75 (53.2%) |
| Total | 363 (61.1%) | 251 (37.6%) |
Income Below Poverty Among Married-Couple Families in El Negro
The poverty statistics for married-couple families in El Negro show that 20.4% or 40 of the total 196 families live below the poverty line. Families with 1 or 2 children have the highest poverty rate of 32.0%, comprising of 24 families. On the other hand, families with no children have the lowest poverty rate of 13.2%, which includes 16 families.
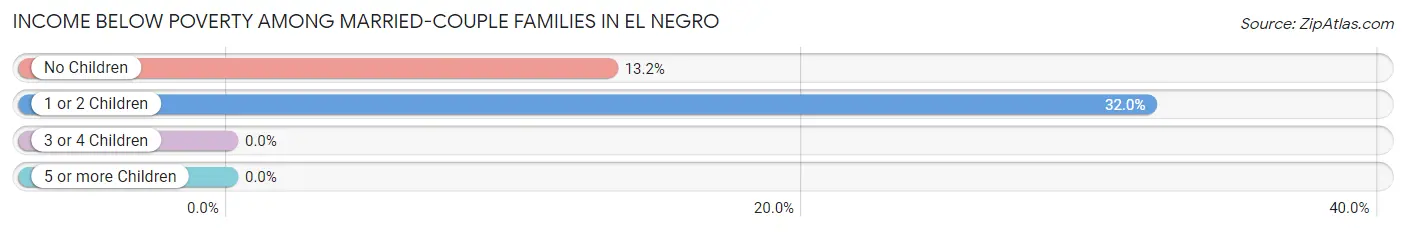
| Children | Above Poverty | Below Poverty |
| No Children | 105 (86.8%) | 16 (13.2%) |
| 1 or 2 Children | 51 (68.0%) | 24 (32.0%) |
| 3 or 4 Children | 0 (0.0%) | 0 (0.0%) |
| 5 or more Children | 0 (0.0%) | 0 (0.0%) |
| Total | 156 (79.6%) | 40 (20.4%) |
Income Below Poverty Among Single-Parent Households in El Negro
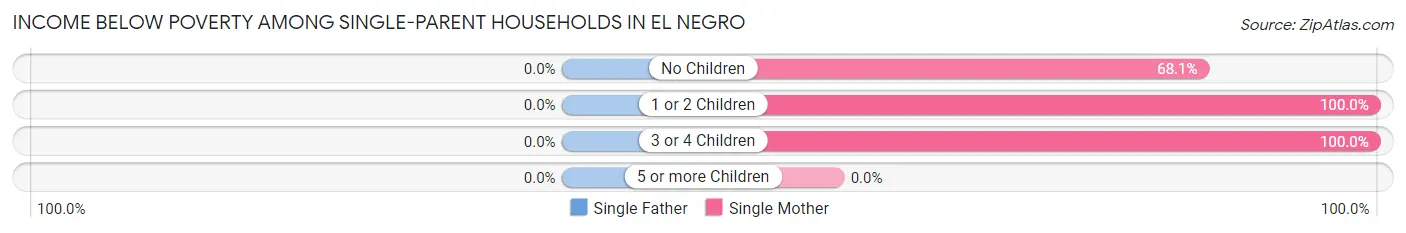
| Children | Single Father | Single Mother |
| No Children | 0 (0.0%) | 32 (68.1%) |
| 1 or 2 Children | 0 (0.0%) | 38 (100.0%) |
| 3 or 4 Children | 0 (0.0%) | 22 (100.0%) |
| 5 or more Children | 0 (0.0%) | 0 (0.0%) |
| Total | 0 (0.0%) | 92 (86.0%) |
Income Below Poverty Among Married-Couple vs Single-Parent Households in El Negro
The poverty data for El Negro shows that 40 of the married-couple family households (20.4%) and 92 of the single-parent households (86.0%) are living below the poverty level. Within the married-couple family households, those with 1 or 2 children have the highest poverty rate, with 24 households (32.0%) falling below the poverty line. Among the single-parent households, those with 1 or 2 children have the highest poverty rate, with 38 household (100.0%) living below poverty.
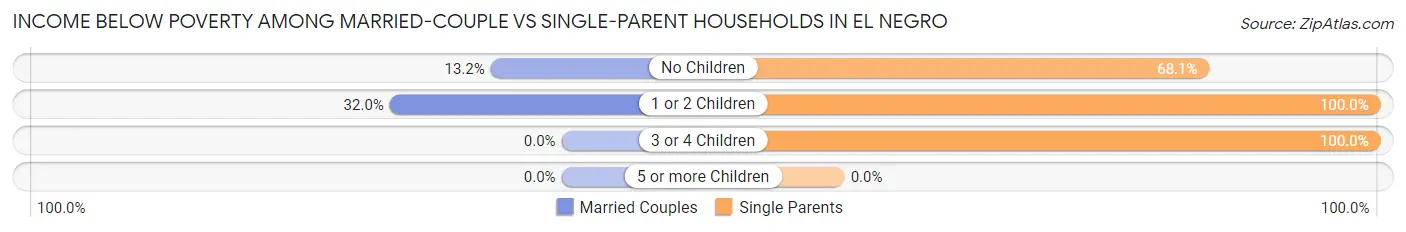
| Children | Married-Couple Families | Single-Parent Households |
| No Children | 16 (13.2%) | 32 (68.1%) |
| 1 or 2 Children | 24 (32.0%) | 38 (100.0%) |
| 3 or 4 Children | 0 (0.0%) | 22 (100.0%) |
| 5 or more Children | 0 (0.0%) | 0 (0.0%) |
| Total | 40 (20.4%) | 92 (86.0%) |
Race in El Negro
The most populous races in El Negro are Hispanic or Latino (1,262 | 100.0%), Black / African American (594 | 47.1%), and Some other Race (568 | 45.0%).
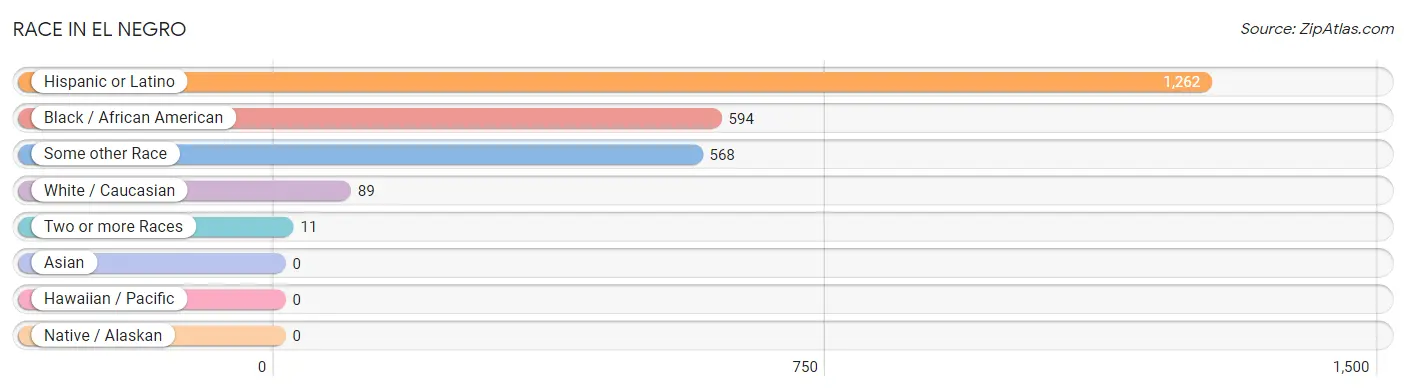
| Race | # Population | % Population |
| Asian | 0 | 0.0% |
| Black / African American | 594 | 47.1% |
| Hawaiian / Pacific | 0 | 0.0% |
| Hispanic or Latino | 1,262 | 100.0% |
| Native / Alaskan | 0 | 0.0% |
| White / Caucasian | 89 | 7.0% |
| Two or more Races | 11 | 0.9% |
| Some other Race | 568 | 45.0% |
| Total | 1,262 | 100.0% |
Ancestry in El Negro
The most populous ancestries reported in El Negro are Puerto Rican (1,231 | 97.5%), Cuban (17 | 1.3%), Central American (14 | 1.1%), and Panamanian (14 | 1.1%), together accounting for 101.1% of all El Negro residents.
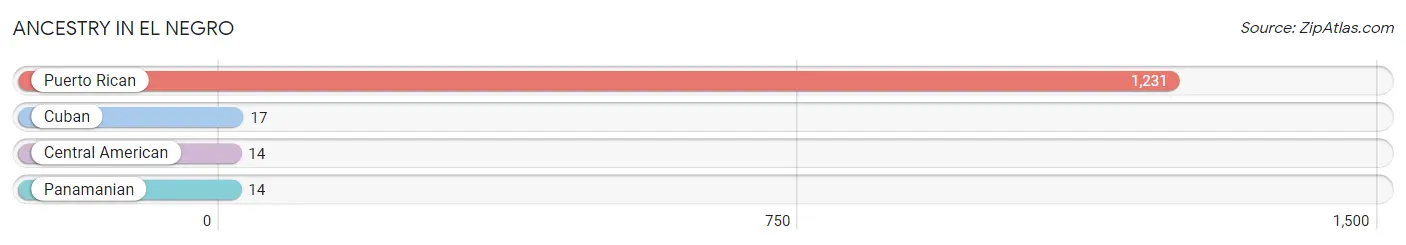
| Ancestry | # Population | % Population |
| Central American | 14 | 1.1% |
| Cuban | 17 | 1.3% |
| Panamanian | 14 | 1.1% |
| Puerto Rican | 1,231 | 97.5% | View All 4 Rows |
Immigrants in El Negro

| Immigration Origin | # Population | % Population | View All 0 Rows |
Sex and Age in El Negro
Sex and Age in El Negro
The most populous age groups in El Negro are 25 to 29 Years (98 | 16.5%) for men and 65 to 69 Years (92 | 13.8%) for women.
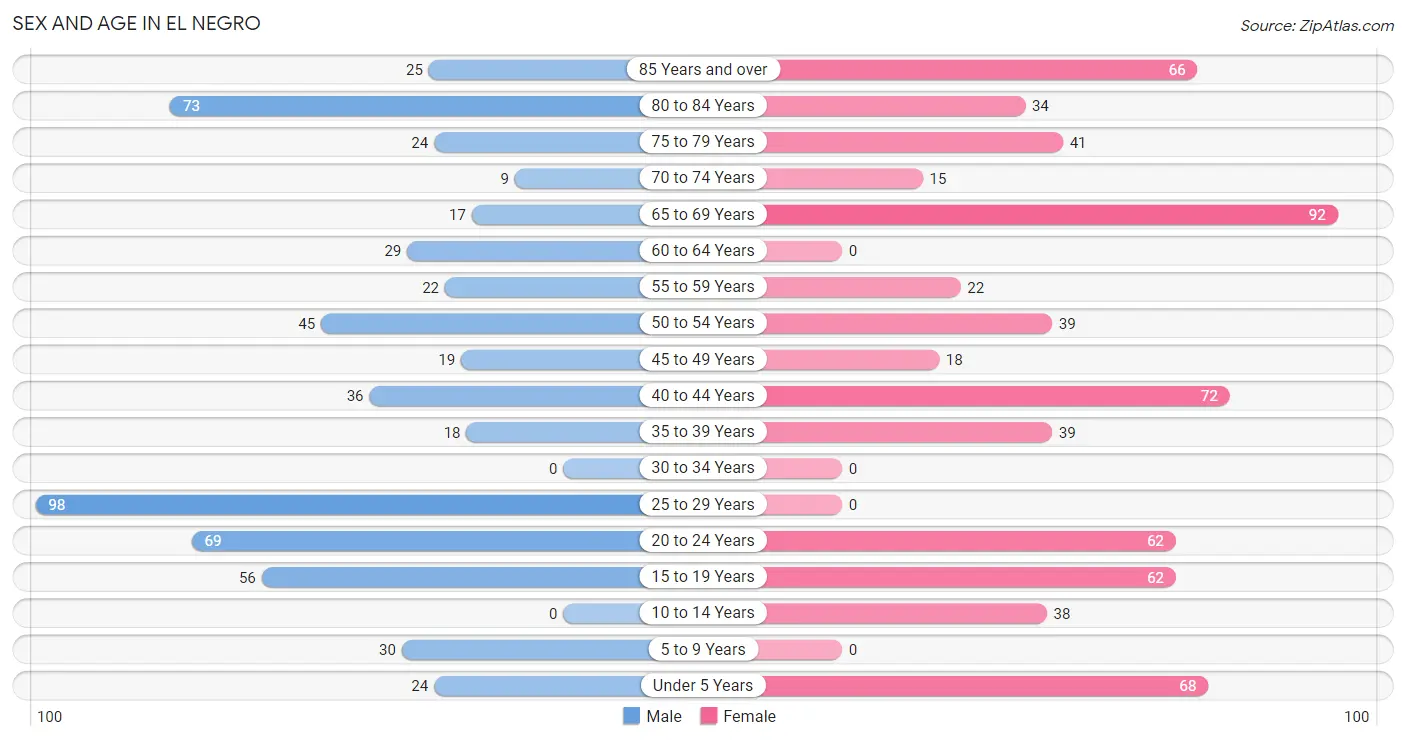
| Age Bracket | Male | Female |
| Under 5 Years | 24 (4.0%) | 68 (10.2%) |
| 5 to 9 Years | 30 (5.1%) | 0 (0.0%) |
| 10 to 14 Years | 0 (0.0%) | 38 (5.7%) |
| 15 to 19 Years | 56 (9.4%) | 62 (9.3%) |
| 20 to 24 Years | 69 (11.6%) | 62 (9.3%) |
| 25 to 29 Years | 98 (16.5%) | 0 (0.0%) |
| 30 to 34 Years | 0 (0.0%) | 0 (0.0%) |
| 35 to 39 Years | 18 (3.0%) | 39 (5.8%) |
| 40 to 44 Years | 36 (6.1%) | 72 (10.8%) |
| 45 to 49 Years | 19 (3.2%) | 18 (2.7%) |
| 50 to 54 Years | 45 (7.6%) | 39 (5.8%) |
| 55 to 59 Years | 22 (3.7%) | 22 (3.3%) |
| 60 to 64 Years | 29 (4.9%) | 0 (0.0%) |
| 65 to 69 Years | 17 (2.9%) | 92 (13.8%) |
| 70 to 74 Years | 9 (1.5%) | 15 (2.2%) |
| 75 to 79 Years | 24 (4.0%) | 41 (6.1%) |
| 80 to 84 Years | 73 (12.3%) | 34 (5.1%) |
| 85 Years and over | 25 (4.2%) | 66 (9.9%) |
| Total | 594 (100.0%) | 668 (100.0%) |
Families and Households in El Negro
Median Family Size in El Negro
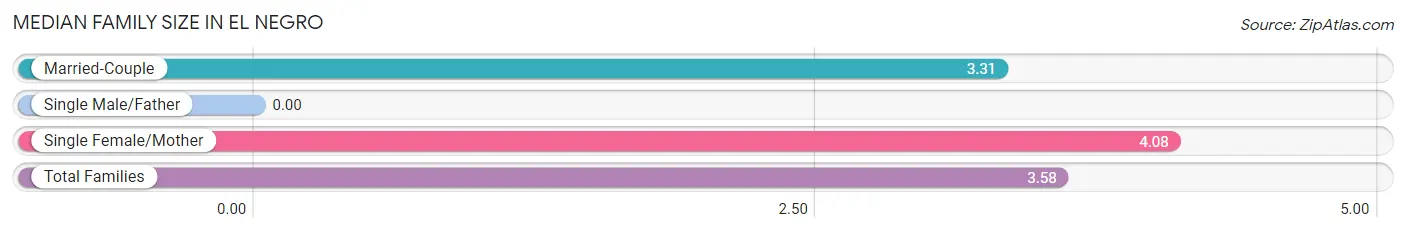
| Family Type | # Families | Family Size |
| Married-Couple | 196 (64.7%) | 3.31 |
| Single Male/Father | 0 (0.0%) | - |
| Single Female/Mother | 107 (35.3%) | 4.08 |
| Total Families | 303 (100.0%) | 3.58 |
Median Household Size in El Negro
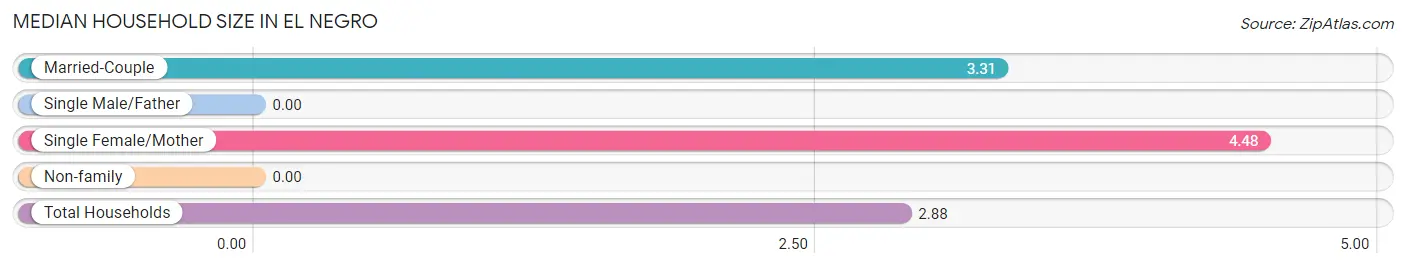
| Household Type | # Households | Household Size |
| Married-Couple | 196 (44.8%) | 3.31 |
| Single Male/Father | 0 (0.0%) | - |
| Single Female/Mother | 107 (24.4%) | 4.48 |
| Non-family | 135 (30.8%) | - |
| Total Households | 438 (100.0%) | 2.88 |
Household Size by Marriage Status in El Negro
Out of a total of 438 households in El Negro, 303 (69.2%) are family households, while 135 (30.8%) are nonfamily households. The most numerous type of family households are 2-person households, comprising 112, and the most common type of nonfamily households are 1-person households, comprising 135.
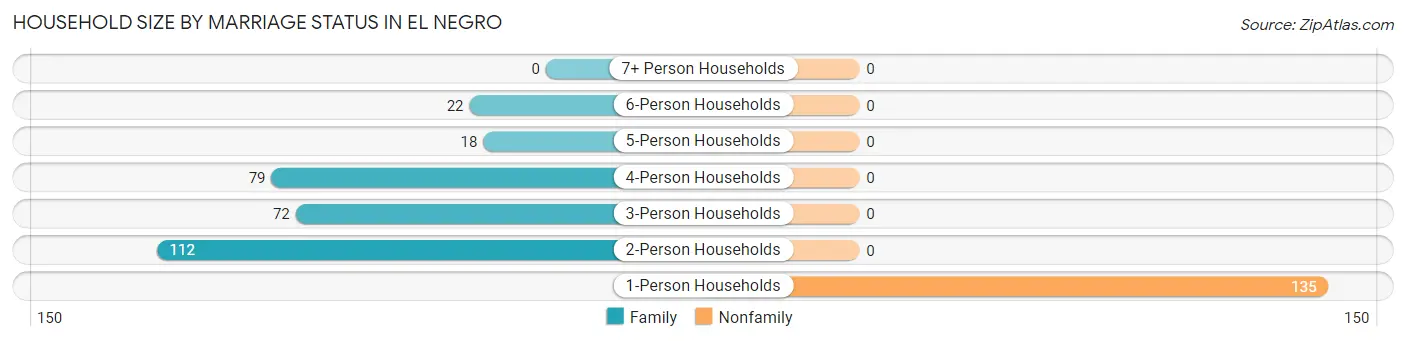
| Household Size | Family Households | Nonfamily Households |
| 1-Person Households | - | 135 (30.8%) |
| 2-Person Households | 112 (25.6%) | 0 (0.0%) |
| 3-Person Households | 72 (16.4%) | 0 (0.0%) |
| 4-Person Households | 79 (18.0%) | 0 (0.0%) |
| 5-Person Households | 18 (4.1%) | 0 (0.0%) |
| 6-Person Households | 22 (5.0%) | 0 (0.0%) |
| 7+ Person Households | 0 (0.0%) | 0 (0.0%) |
| Total | 303 (69.2%) | 135 (30.8%) |
Female Fertility in El Negro
Fertility by Age in El Negro
Average fertility rate in El Negro is 63.0 births per 1,000 women. Women in the age bracket of 20 to 34 years have the highest fertility rate with 258.0 births per 1,000 women. Women in the age bracket of 20 to 34 years acount for 100.0% of all women with births.
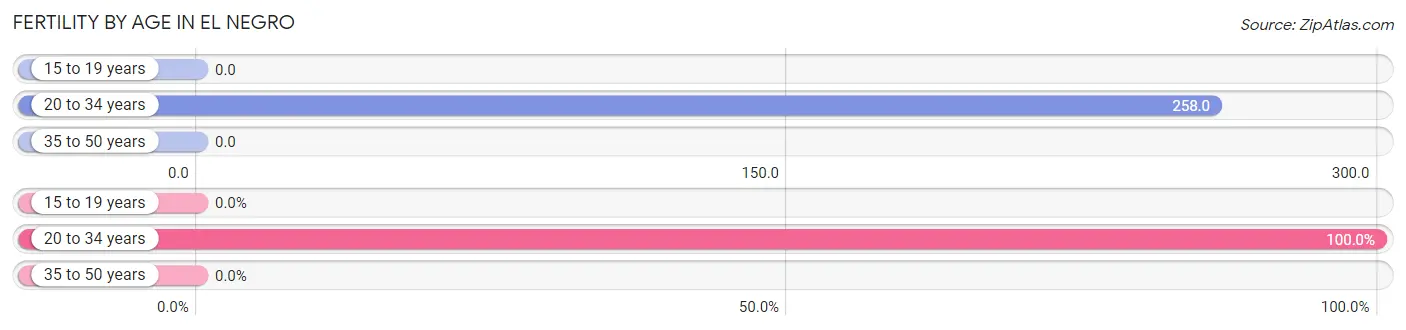
| Age Bracket | Women with Births | Births / 1,000 Women |
| 15 to 19 years | 0 (0.0%) | 0.0 |
| 20 to 34 years | 16 (100.0%) | 258.0 |
| 35 to 50 years | 0 (0.0%) | 0.0 |
| Total | 16 (100.0%) | 63.0 |
Fertility by Age by Marriage Status in El Negro
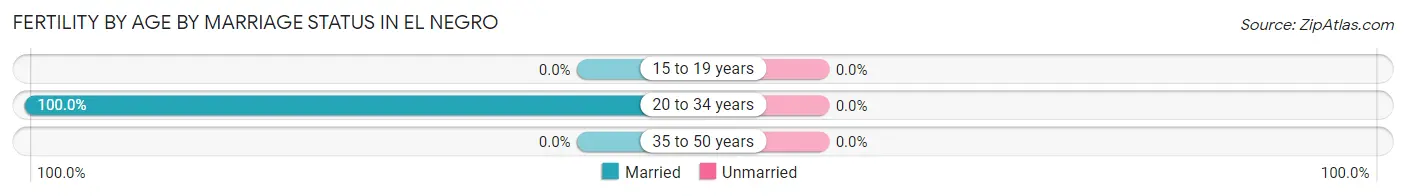
| Age Bracket | Married | Unmarried |
| 15 to 19 years | 0 (0.0%) | 0 (0.0%) |
| 20 to 34 years | 16 (100.0%) | 0 (0.0%) |
| 35 to 50 years | 0 (0.0%) | 0 (0.0%) |
| Total | 16 (100.0%) | 0 (0.0%) |
Fertility by Education in El Negro
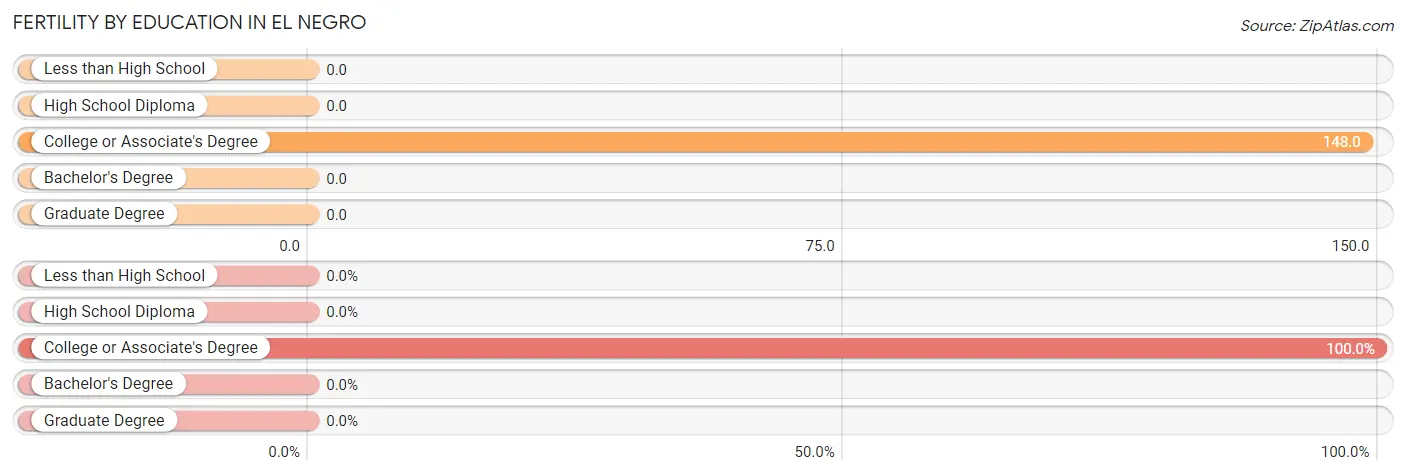
| Educational Attainment | Women with Births | Births / 1,000 Women |
| Less than High School | 0 (0.0%) | 0.0 |
| High School Diploma | 0 (0.0%) | 0.0 |
| College or Associate's Degree | 16 (100.0%) | 148.0 |
| Bachelor's Degree | 0 (0.0%) | 0.0 |
| Graduate Degree | 0 (0.0%) | 0.0 |
| Total | 16 (100.0%) | 63.0 |
Fertility by Education by Marriage Status in El Negro
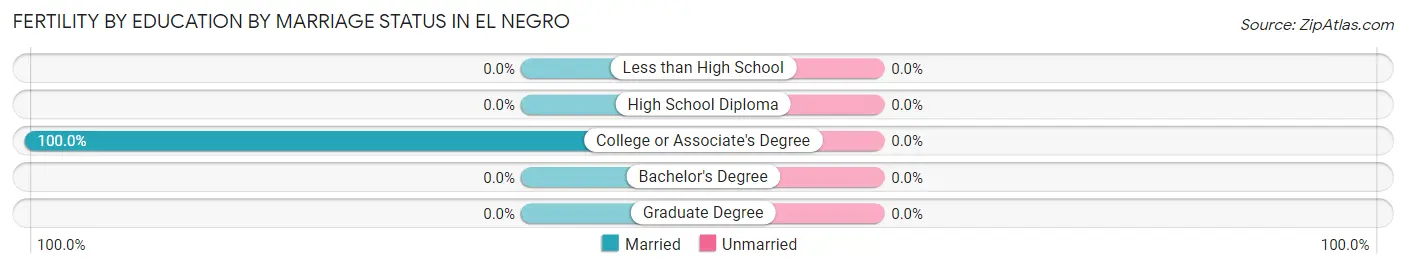
| Educational Attainment | Married | Unmarried |
| Less than High School | 0 (0.0%) | 0 (0.0%) |
| High School Diploma | 0 (0.0%) | 0 (0.0%) |
| College or Associate's Degree | 16 (100.0%) | 0 (0.0%) |
| Bachelor's Degree | 0 (0.0%) | 0 (0.0%) |
| Graduate Degree | 0 (0.0%) | 0 (0.0%) |
| Total | 16 (100.0%) | 0 (0.0%) |
Employment Characteristics in El Negro
Employment by Class of Employer in El Negro
Among the 363 employed individuals in El Negro, private company employees (172 | 47.4%), self-employed (not incorporated) (91 | 25.1%), and state government employees (73 | 20.1%) make up the most common classes of employment.
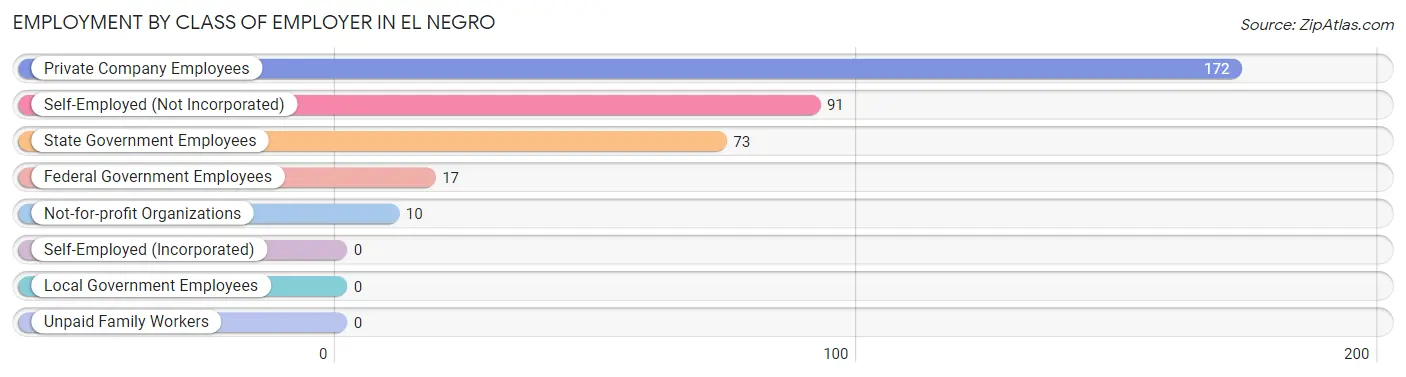
| Employer Class | # Employees | % Employees |
| Private Company Employees | 172 | 47.4% |
| Self-Employed (Incorporated) | 0 | 0.0% |
| Self-Employed (Not Incorporated) | 91 | 25.1% |
| Not-for-profit Organizations | 10 | 2.8% |
| Local Government Employees | 0 | 0.0% |
| State Government Employees | 73 | 20.1% |
| Federal Government Employees | 17 | 4.7% |
| Unpaid Family Workers | 0 | 0.0% |
| Total | 363 | 100.0% |
Employment Status by Age in El Negro
According to the labor force statistics for El Negro, out of the total population over 16 years of age (1,036), 50.0% or 518 individuals are in the labor force, with 24.7% or 128 of them unemployed. The age group with the highest labor force participation rate is 20 to 24 years, with 100.0% or 131 individuals in the labor force. Within the labor force, the 16 to 19 years age range has the highest percentage of unemployed individuals, with 100.0% or 39 of them being unemployed.
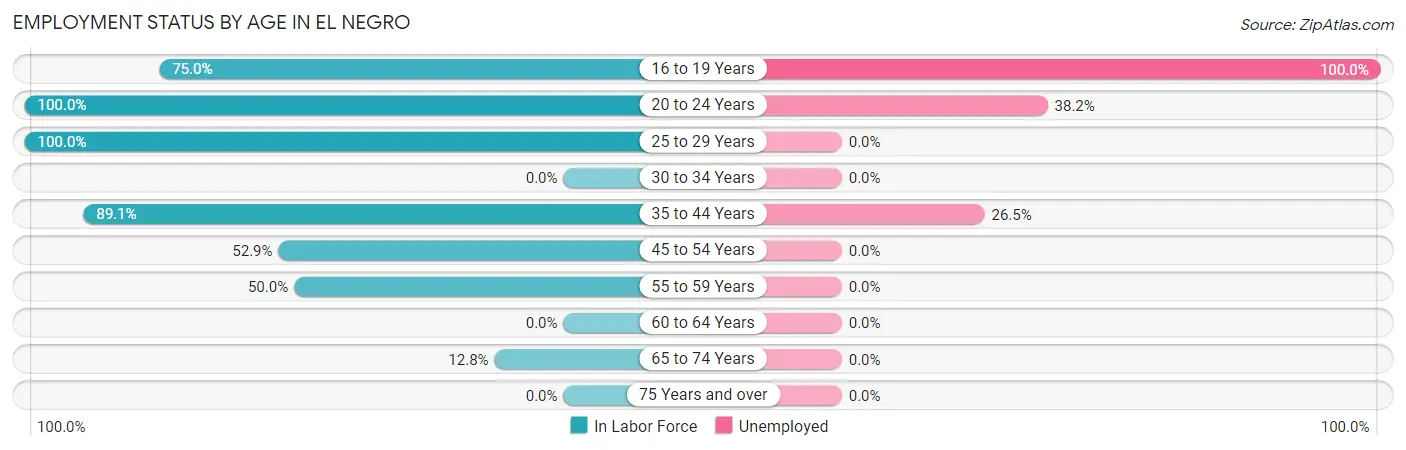
| Age Bracket | In Labor Force | Unemployed |
| 16 to 19 Years | 39 (75.0%) | 39 (100.0%) |
| 20 to 24 Years | 131 (100.0%) | 50 (38.2%) |
| 25 to 29 Years | 98 (100.0%) | 0 (0.0%) |
| 30 to 34 Years | 0 (0.0%) | 0 (0.0%) |
| 35 to 44 Years | 147 (89.1%) | 39 (26.5%) |
| 45 to 54 Years | 64 (52.9%) | 0 (0.0%) |
| 55 to 59 Years | 22 (50.0%) | 0 (0.0%) |
| 60 to 64 Years | 0 (0.0%) | 0 (0.0%) |
| 65 to 74 Years | 17 (12.8%) | 0 (0.0%) |
| 75 Years and over | 0 (0.0%) | 0 (0.0%) |
| Total | 518 (50.0%) | 128 (24.7%) |
Employment Status by Educational Attainment in El Negro
According to labor force statistics for El Negro, 72.4% of individuals (331) out of the total population between 25 and 64 years of age (457) are in the labor force, with 11.8% or 39 of them being unemployed. The group with the highest labor force participation rate are those with the educational attainment of college / associate degree, with 84.1% or 95 individuals in the labor force. Within the labor force, individuals with high school diploma education have the highest percentage of unemployment, with 36.8% or 39 of them being unemployed.

| Educational Attainment | In Labor Force | Unemployed |
| Less than High School | 49 (49.0%) | 0 (0.0%) |
| High School Diploma | 106 (72.6%) | 54 (36.8%) |
| College / Associate Degree | 95 (84.1%) | 0 (0.0%) |
| Bachelor's Degree or higher | 81 (82.7%) | 0 (0.0%) |
| Total | 331 (72.4%) | 54 (11.8%) |
Employment Occupations by Sex in El Negro
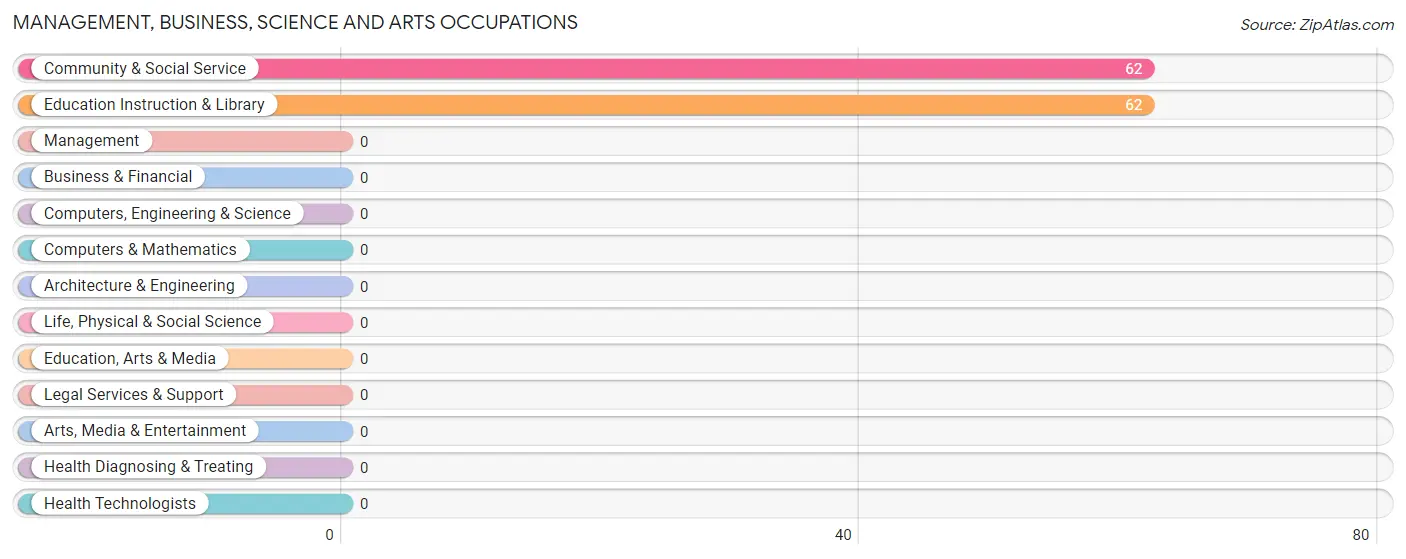
Management, Business, Science and Arts Occupations
The most common Management, Business, Science and Arts occupations in El Negro are Community & Social Service (62 | 15.9%), and Education Instruction & Library (62 | 15.9%).
Management, Business, Science and Arts Occupations by Sex
Within the Management, Business, Science and Arts occupations in El Negro, the most male-oriented occupations are Community & Social Service (74.2%), and Education Instruction & Library (74.2%), while the most female-oriented occupations are Community & Social Service (25.8%), and Education Instruction & Library (25.8%).
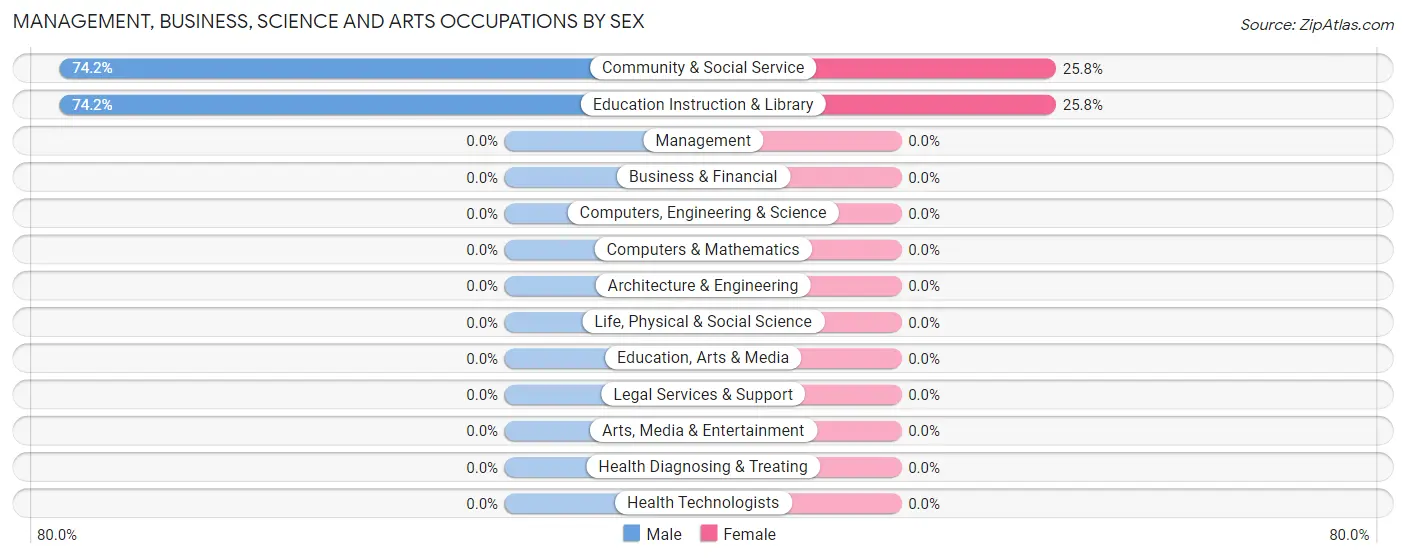
| Occupation | Male | Female |
| Management | 0 (0.0%) | 0 (0.0%) |
| Business & Financial | 0 (0.0%) | 0 (0.0%) |
| Computers, Engineering & Science | 0 (0.0%) | 0 (0.0%) |
| Computers & Mathematics | 0 (0.0%) | 0 (0.0%) |
| Architecture & Engineering | 0 (0.0%) | 0 (0.0%) |
| Life, Physical & Social Science | 0 (0.0%) | 0 (0.0%) |
| Community & Social Service | 46 (74.2%) | 16 (25.8%) |
| Education, Arts & Media | 0 (0.0%) | 0 (0.0%) |
| Legal Services & Support | 0 (0.0%) | 0 (0.0%) |
| Education Instruction & Library | 46 (74.2%) | 16 (25.8%) |
| Arts, Media & Entertainment | 0 (0.0%) | 0 (0.0%) |
| Health Diagnosing & Treating | 0 (0.0%) | 0 (0.0%) |
| Health Technologists | 0 (0.0%) | 0 (0.0%) |
| Total (Category) | 46 (74.2%) | 16 (25.8%) |
| Total (Overall) | 265 (67.9%) | 125 (32.1%) |
Services Occupations
The most common Services occupations in El Negro are Cleaning & Maintenance (31 | 8.0%), Healthcare Support (17 | 4.4%), and Personal Care & Service (10 | 2.6%).
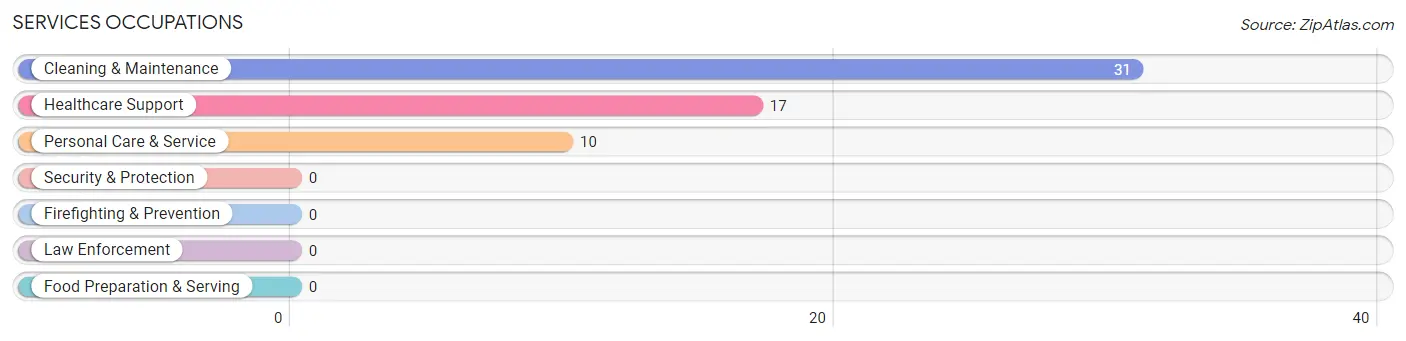
Services Occupations by Sex
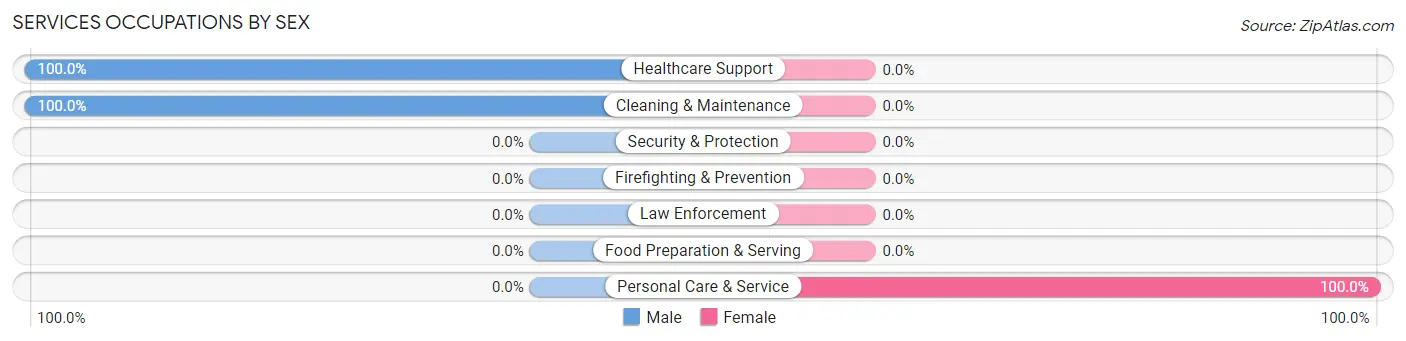
| Occupation | Male | Female |
| Healthcare Support | 17 (100.0%) | 0 (0.0%) |
| Security & Protection | 0 (0.0%) | 0 (0.0%) |
| Firefighting & Prevention | 0 (0.0%) | 0 (0.0%) |
| Law Enforcement | 0 (0.0%) | 0 (0.0%) |
| Food Preparation & Serving | 0 (0.0%) | 0 (0.0%) |
| Cleaning & Maintenance | 31 (100.0%) | 0 (0.0%) |
| Personal Care & Service | 0 (0.0%) | 10 (100.0%) |
| Total (Category) | 48 (82.8%) | 10 (17.2%) |
| Total (Overall) | 265 (67.9%) | 125 (32.1%) |
Sales and Office Occupations
The most common Sales and Office occupations in El Negro are Office & Administration (60 | 15.4%), and Sales & Related (44 | 11.3%).

Sales and Office Occupations by Sex

| Occupation | Male | Female |
| Sales & Related | 18 (40.9%) | 26 (59.1%) |
| Office & Administration | 22 (36.7%) | 38 (63.3%) |
| Total (Category) | 40 (38.5%) | 64 (61.5%) |
| Total (Overall) | 265 (67.9%) | 125 (32.1%) |
Natural Resources, Construction and Maintenance Occupations
The most common Natural Resources, Construction and Maintenance occupations in El Negro are Installation, Maintenance & Repair (19 | 4.9%), Construction & Extraction (18 | 4.6%), and Farming, Fishing & Forestry (16 | 4.1%).

Natural Resources, Construction and Maintenance Occupations by Sex

| Occupation | Male | Female |
| Farming, Fishing & Forestry | 16 (100.0%) | 0 (0.0%) |
| Construction & Extraction | 18 (100.0%) | 0 (0.0%) |
| Installation, Maintenance & Repair | 19 (100.0%) | 0 (0.0%) |
| Total (Category) | 53 (100.0%) | 0 (0.0%) |
| Total (Overall) | 265 (67.9%) | 125 (32.1%) |
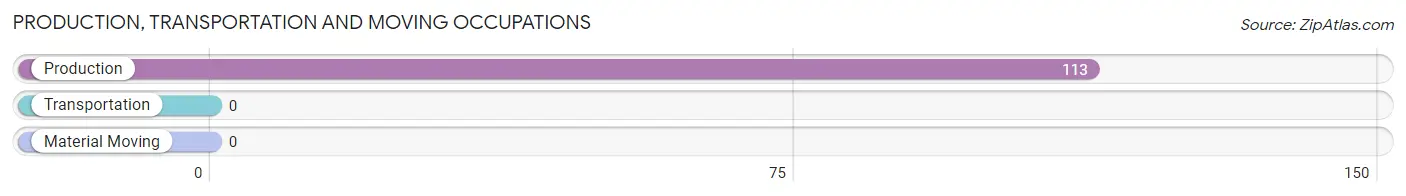
Production, Transportation and Moving Occupations
The most common Production, Transportation and Moving occupations in El Negro are , and Production (113 | 29.0%).
Production, Transportation and Moving Occupations by Sex
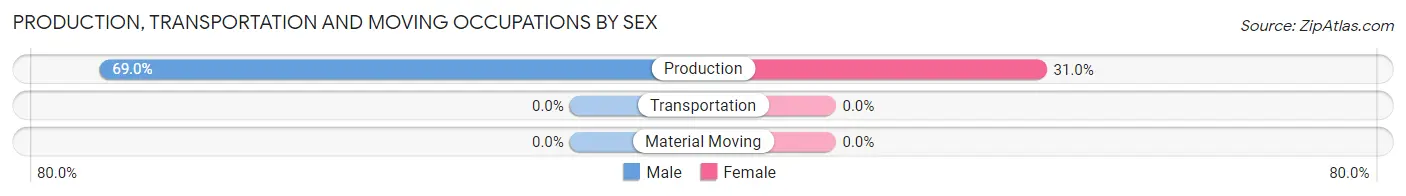
| Occupation | Male | Female |
| Production | 78 (69.0%) | 35 (31.0%) |
| Transportation | 0 (0.0%) | 0 (0.0%) |
| Material Moving | 0 (0.0%) | 0 (0.0%) |
| Total (Category) | 78 (69.0%) | 35 (31.0%) |
| Total (Overall) | 265 (67.9%) | 125 (32.1%) |
Employment Industries by Sex in El Negro
Employment Industries in El Negro
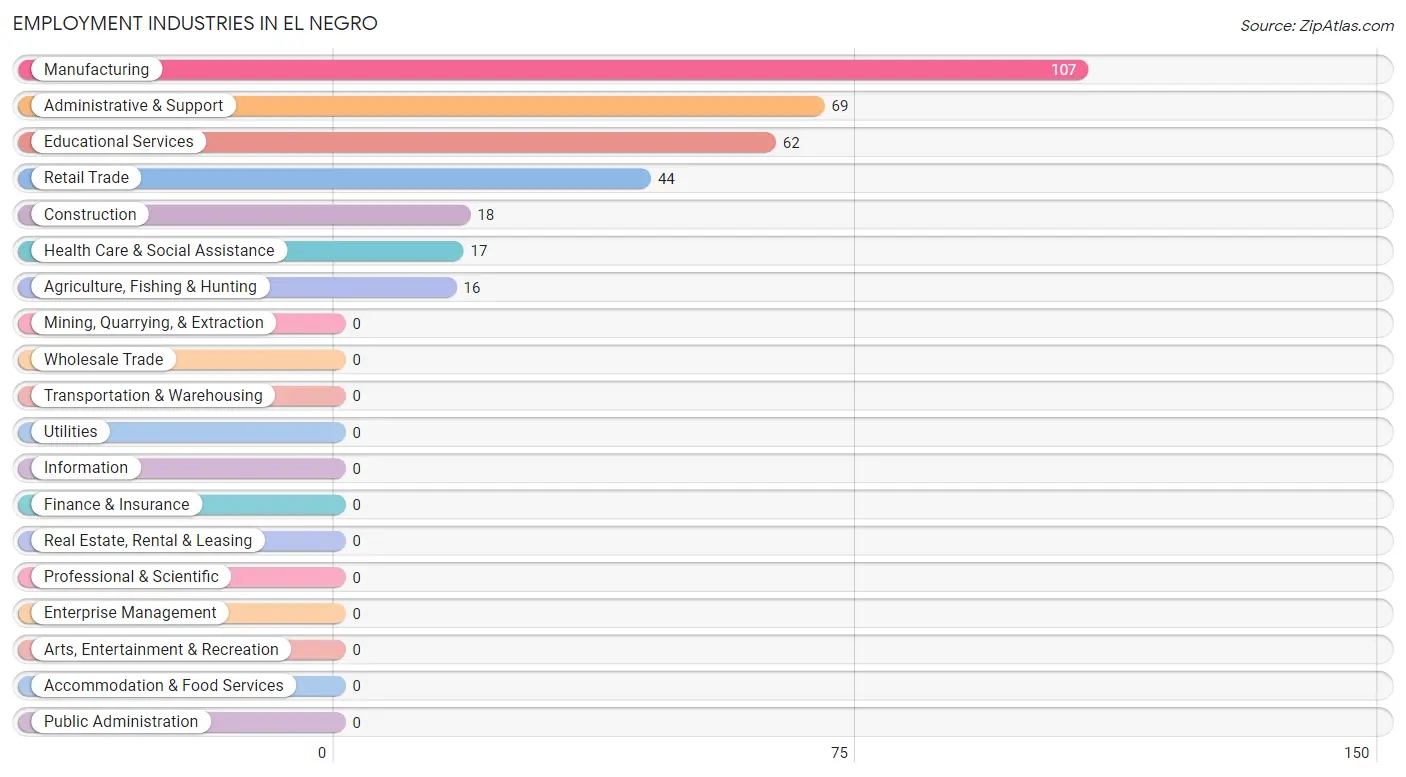
The major employment industries in El Negro include Manufacturing (107 | 27.4%), Administrative & Support (69 | 17.7%), Educational Services (62 | 15.9%), Retail Trade (44 | 11.3%), and Construction (18 | 4.6%).
Employment Industries by Sex in El Negro
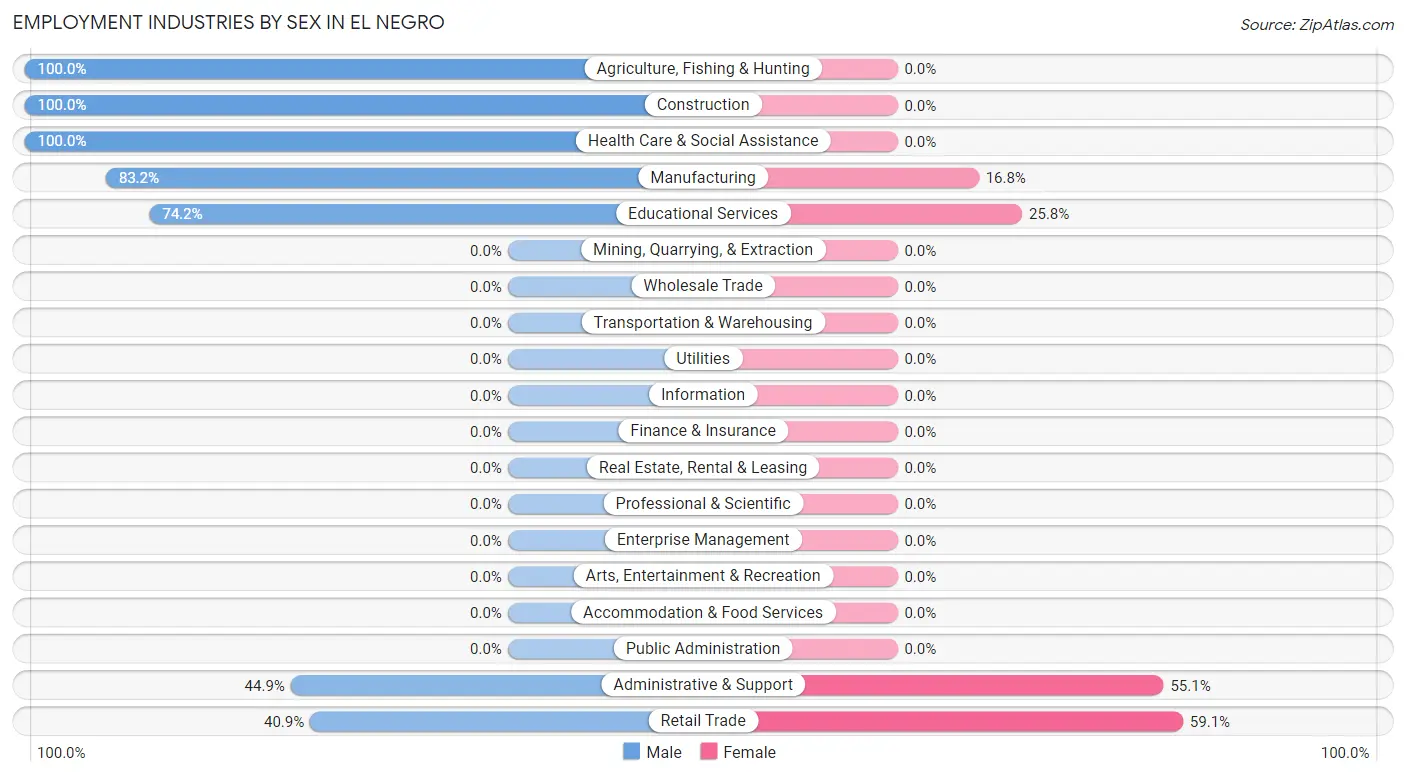
The El Negro industries that see more men than women are Agriculture, Fishing & Hunting (100.0%), Construction (100.0%), and Health Care & Social Assistance (100.0%), whereas the industries that tend to have a higher number of women are Retail Trade (59.1%), Administrative & Support (55.1%), and Educational Services (25.8%).
| Industry | Male | Female |
| Agriculture, Fishing & Hunting | 16 (100.0%) | 0 (0.0%) |
| Mining, Quarrying, & Extraction | 0 (0.0%) | 0 (0.0%) |
| Construction | 18 (100.0%) | 0 (0.0%) |
| Manufacturing | 89 (83.2%) | 18 (16.8%) |
| Wholesale Trade | 0 (0.0%) | 0 (0.0%) |
| Retail Trade | 18 (40.9%) | 26 (59.1%) |
| Transportation & Warehousing | 0 (0.0%) | 0 (0.0%) |
| Utilities | 0 (0.0%) | 0 (0.0%) |
| Information | 0 (0.0%) | 0 (0.0%) |
| Finance & Insurance | 0 (0.0%) | 0 (0.0%) |
| Real Estate, Rental & Leasing | 0 (0.0%) | 0 (0.0%) |
| Professional & Scientific | 0 (0.0%) | 0 (0.0%) |
| Enterprise Management | 0 (0.0%) | 0 (0.0%) |
| Administrative & Support | 31 (44.9%) | 38 (55.1%) |
| Educational Services | 46 (74.2%) | 16 (25.8%) |
| Health Care & Social Assistance | 17 (100.0%) | 0 (0.0%) |
| Arts, Entertainment & Recreation | 0 (0.0%) | 0 (0.0%) |
| Accommodation & Food Services | 0 (0.0%) | 0 (0.0%) |
| Public Administration | 0 (0.0%) | 0 (0.0%) |
| Total | 265 (67.9%) | 125 (32.1%) |
Education in El Negro
School Enrollment in El Negro
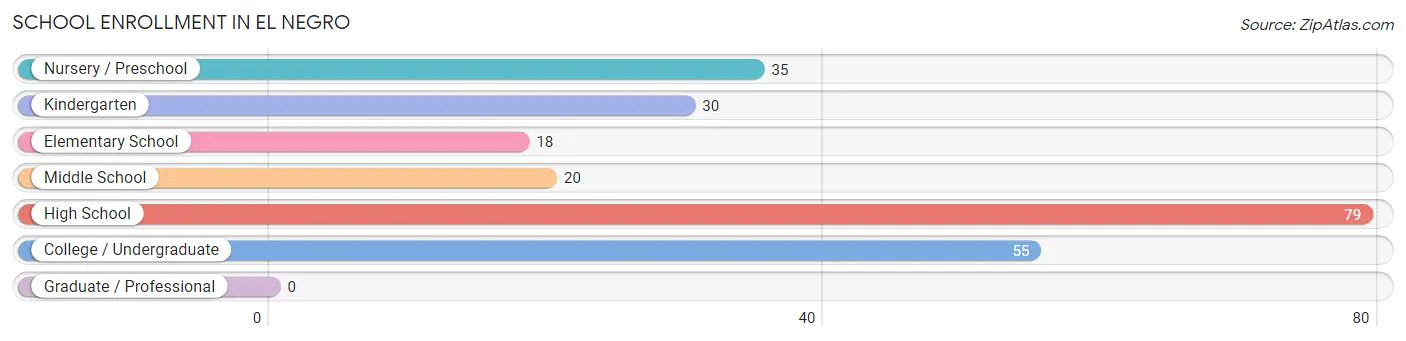
The most common levels of schooling among the 237 students in El Negro are high school (79 | 33.3%), college / undergraduate (55 | 23.2%), and nursery / preschool (35 | 14.8%).
| School Level | # Students | % Students |
| Nursery / Preschool | 35 | 14.8% |
| Kindergarten | 30 | 12.7% |
| Elementary School | 18 | 7.6% |
| Middle School | 20 | 8.4% |
| High School | 79 | 33.3% |
| College / Undergraduate | 55 | 23.2% |
| Graduate / Professional | 0 | 0.0% |
| Total | 237 | 100.0% |
School Enrollment by Age by Funding Source in El Negro
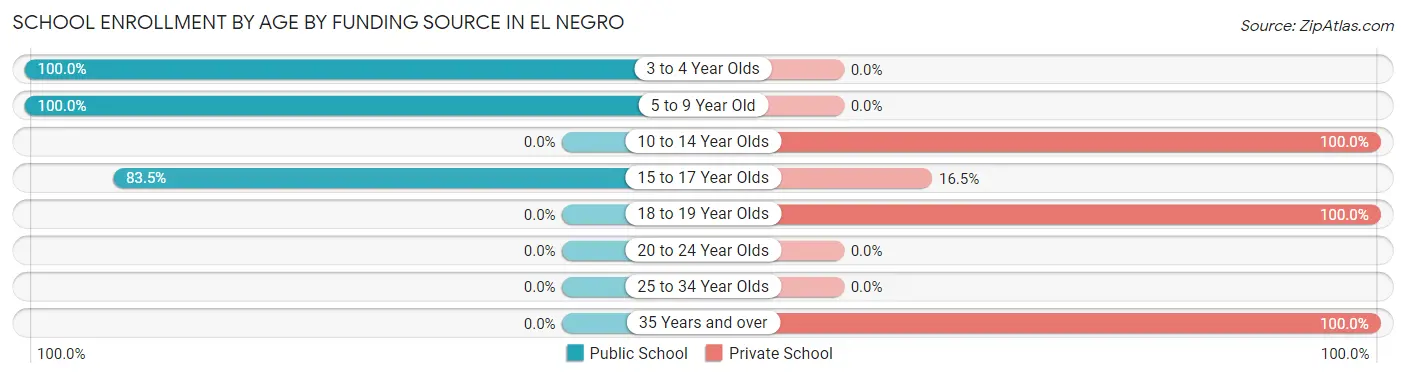
Out of a total of 237 students who are enrolled in schools in El Negro, 106 (44.7%) attend a private institution, while the remaining 131 (55.3%) are enrolled in public schools. The age group of 10 to 14 year olds has the highest likelihood of being enrolled in private schools, with 38 (100.0% in the age bracket) enrolled. Conversely, the age group of 3 to 4 year olds has the lowest likelihood of being enrolled in a private school, with 35 (100.0% in the age bracket) attending a public institution.
| Age Bracket | Public School | Private School |
| 3 to 4 Year Olds | 35 (100.0%) | 0 (0.0%) |
| 5 to 9 Year Old | 30 (100.0%) | 0 (0.0%) |
| 10 to 14 Year Olds | 0 (0.0%) | 38 (100.0%) |
| 15 to 17 Year Olds | 66 (83.5%) | 13 (16.5%) |
| 18 to 19 Year Olds | 0 (0.0%) | 39 (100.0%) |
| 20 to 24 Year Olds | 0 (0.0%) | 0 (0.0%) |
| 25 to 34 Year Olds | 0 (0.0%) | 0 (0.0%) |
| 35 Years and over | 0 (0.0%) | 16 (100.0%) |
| Total | 131 (55.3%) | 106 (44.7%) |
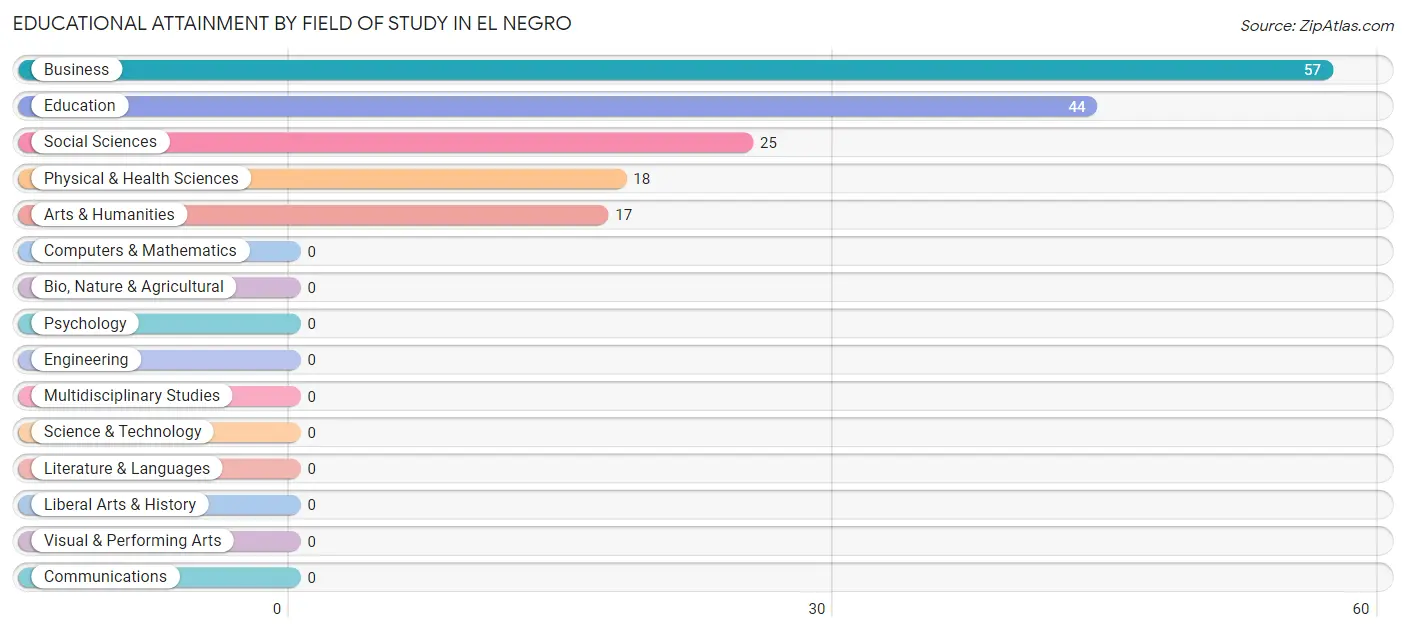
Educational Attainment by Field of Study in El Negro
Business (57 | 35.4%), education (44 | 27.3%), social sciences (25 | 15.5%), physical & health sciences (18 | 11.2%), and arts & humanities (17 | 10.6%) are the most common fields of study among 161 individuals in El Negro who have obtained a bachelor's degree or higher.
| Field of Study | # Graduates | % Graduates |
| Computers & Mathematics | 0 | 0.0% |
| Bio, Nature & Agricultural | 0 | 0.0% |
| Physical & Health Sciences | 18 | 11.2% |
| Psychology | 0 | 0.0% |
| Social Sciences | 25 | 15.5% |
| Engineering | 0 | 0.0% |
| Multidisciplinary Studies | 0 | 0.0% |
| Science & Technology | 0 | 0.0% |
| Business | 57 | 35.4% |
| Education | 44 | 27.3% |
| Literature & Languages | 0 | 0.0% |
| Liberal Arts & History | 0 | 0.0% |
| Visual & Performing Arts | 0 | 0.0% |
| Communications | 0 | 0.0% |
| Arts & Humanities | 17 | 10.6% |
| Total | 161 | 100.0% |
Transportation & Commute in El Negro
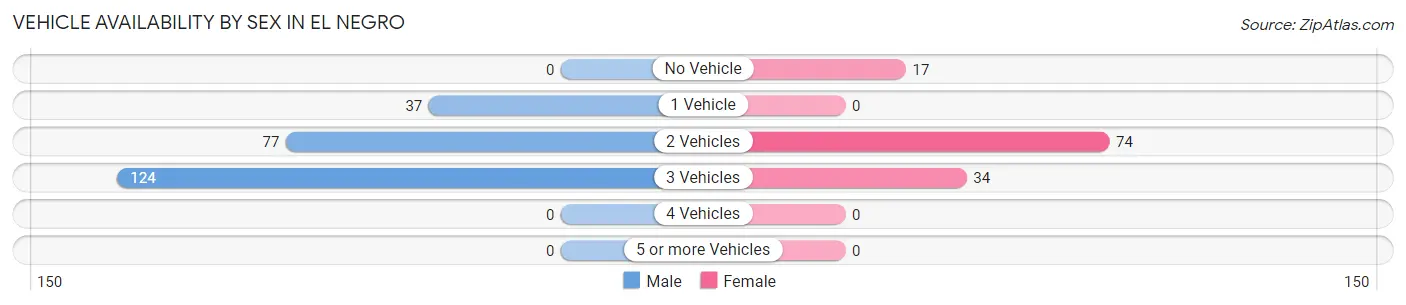
Vehicle Availability by Sex in El Negro
The most prevalent vehicle ownership categories in El Negro are males with 3 vehicles (124, accounting for 52.1%) and females with 3 vehicles (34, making up 99.2%).
| Vehicles Available | Male | Female |
| No Vehicle | 0 (0.0%) | 17 (13.6%) |
| 1 Vehicle | 37 (15.5%) | 0 (0.0%) |
| 2 Vehicles | 77 (32.4%) | 74 (59.2%) |
| 3 Vehicles | 124 (52.1%) | 34 (27.2%) |
| 4 Vehicles | 0 (0.0%) | 0 (0.0%) |
| 5 or more Vehicles | 0 (0.0%) | 0 (0.0%) |
| Total | 238 (100.0%) | 125 (100.0%) |
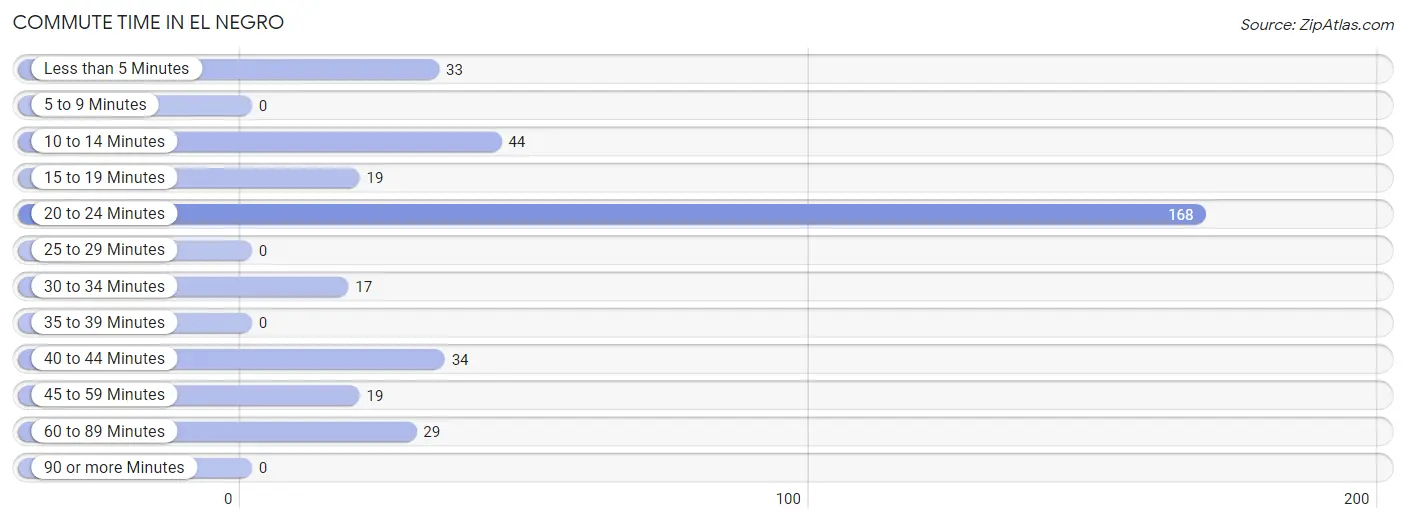
Commute Time in El Negro
The most frequently occuring commute durations in El Negro are 20 to 24 minutes (168 commuters, 46.3%), 10 to 14 minutes (44 commuters, 12.1%), and 40 to 44 minutes (34 commuters, 9.4%).
| Commute Time | # Commuters | % Commuters |
| Less than 5 Minutes | 33 | 9.1% |
| 5 to 9 Minutes | 0 | 0.0% |
| 10 to 14 Minutes | 44 | 12.1% |
| 15 to 19 Minutes | 19 | 5.2% |
| 20 to 24 Minutes | 168 | 46.3% |
| 25 to 29 Minutes | 0 | 0.0% |
| 30 to 34 Minutes | 17 | 4.7% |
| 35 to 39 Minutes | 0 | 0.0% |
| 40 to 44 Minutes | 34 | 9.4% |
| 45 to 59 Minutes | 19 | 5.2% |
| 60 to 89 Minutes | 29 | 8.0% |
| 90 or more Minutes | 0 | 0.0% |
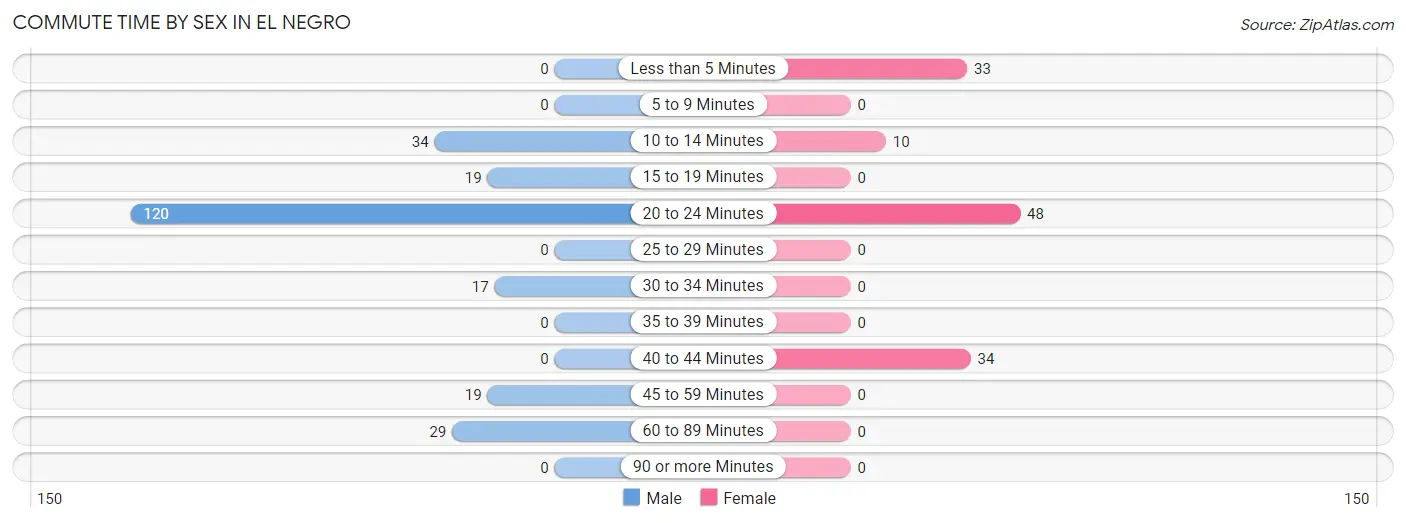
Commute Time by Sex in El Negro
The most common commute times in El Negro are 20 to 24 minutes (120 commuters, 50.4%) for males and 20 to 24 minutes (48 commuters, 38.4%) for females.
| Commute Time | Male | Female |
| Less than 5 Minutes | 0 (0.0%) | 33 (26.4%) |
| 5 to 9 Minutes | 0 (0.0%) | 0 (0.0%) |
| 10 to 14 Minutes | 34 (14.3%) | 10 (8.0%) |
| 15 to 19 Minutes | 19 (8.0%) | 0 (0.0%) |
| 20 to 24 Minutes | 120 (50.4%) | 48 (38.4%) |
| 25 to 29 Minutes | 0 (0.0%) | 0 (0.0%) |
| 30 to 34 Minutes | 17 (7.1%) | 0 (0.0%) |
| 35 to 39 Minutes | 0 (0.0%) | 0 (0.0%) |
| 40 to 44 Minutes | 0 (0.0%) | 34 (27.2%) |
| 45 to 59 Minutes | 19 (8.0%) | 0 (0.0%) |
| 60 to 89 Minutes | 29 (12.2%) | 0 (0.0%) |
| 90 or more Minutes | 0 (0.0%) | 0 (0.0%) |
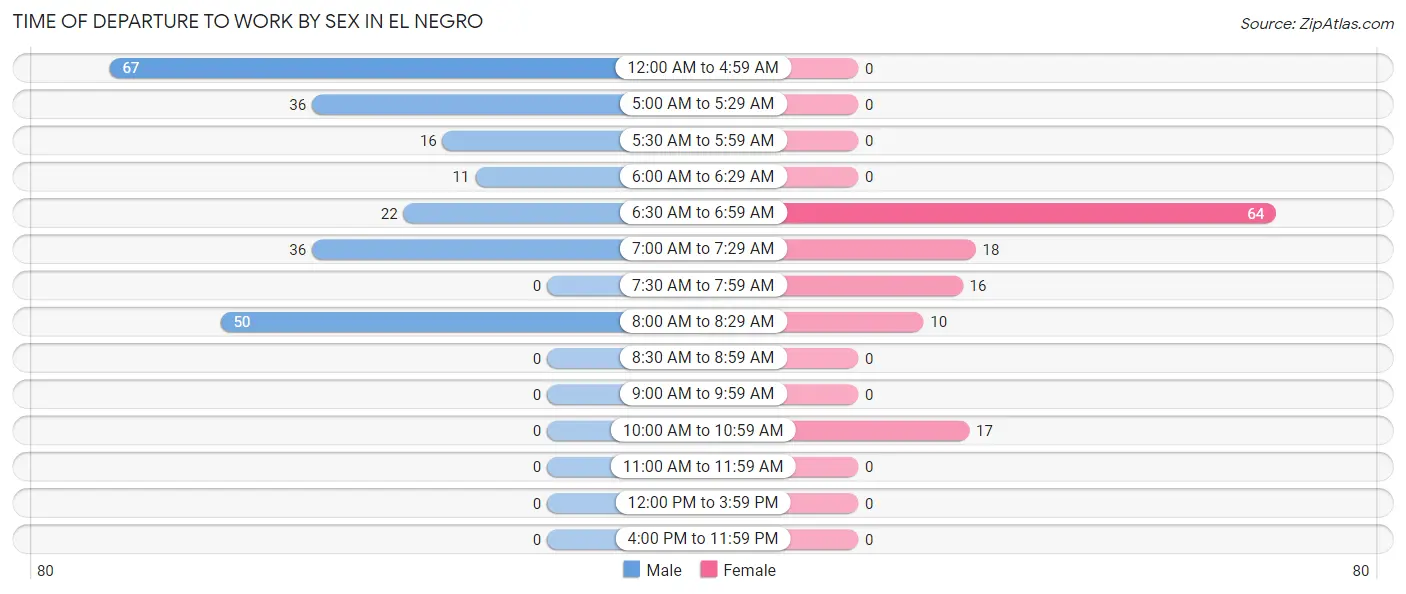
Time of Departure to Work by Sex in El Negro
The most frequent times of departure to work in El Negro are 12:00 AM to 4:59 AM (67, 28.1%) for males and 6:30 AM to 6:59 AM (64, 51.2%) for females.
| Time of Departure | Male | Female |
| 12:00 AM to 4:59 AM | 67 (28.1%) | 0 (0.0%) |
| 5:00 AM to 5:29 AM | 36 (15.1%) | 0 (0.0%) |
| 5:30 AM to 5:59 AM | 16 (6.7%) | 0 (0.0%) |
| 6:00 AM to 6:29 AM | 11 (4.6%) | 0 (0.0%) |
| 6:30 AM to 6:59 AM | 22 (9.2%) | 64 (51.2%) |
| 7:00 AM to 7:29 AM | 36 (15.1%) | 18 (14.4%) |
| 7:30 AM to 7:59 AM | 0 (0.0%) | 16 (12.8%) |
| 8:00 AM to 8:29 AM | 50 (21.0%) | 10 (8.0%) |
| 8:30 AM to 8:59 AM | 0 (0.0%) | 0 (0.0%) |
| 9:00 AM to 9:59 AM | 0 (0.0%) | 0 (0.0%) |
| 10:00 AM to 10:59 AM | 0 (0.0%) | 17 (13.6%) |
| 11:00 AM to 11:59 AM | 0 (0.0%) | 0 (0.0%) |
| 12:00 PM to 3:59 PM | 0 (0.0%) | 0 (0.0%) |
| 4:00 PM to 11:59 PM | 0 (0.0%) | 0 (0.0%) |
| Total | 238 (100.0%) | 125 (100.0%) |
Housing Occupancy in El Negro
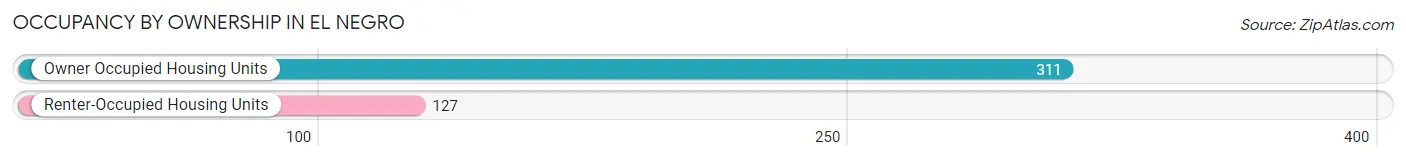
Occupancy by Ownership in El Negro
Of the total 438 dwellings in El Negro, owner-occupied units account for 311 (71.0%), while renter-occupied units make up 127 (29.0%).
| Occupancy | # Housing Units | % Housing Units |
| Owner Occupied Housing Units | 311 | 71.0% |
| Renter-Occupied Housing Units | 127 | 29.0% |
| Total Occupied Housing Units | 438 | 100.0% |
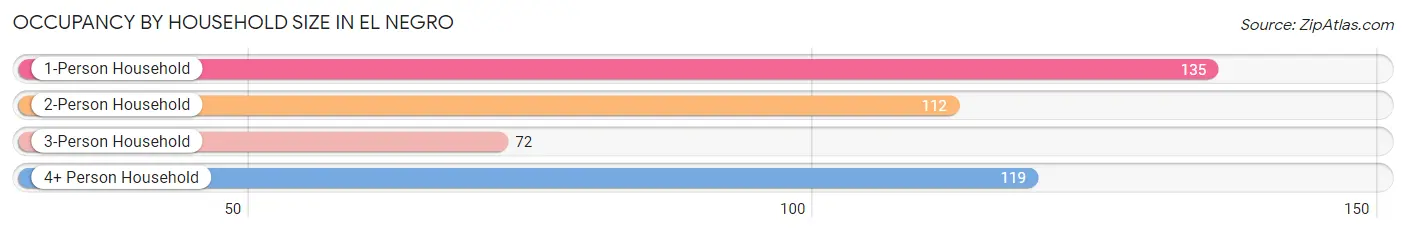
Occupancy by Household Size in El Negro
| Household Size | # Housing Units | % Housing Units |
| 1-Person Household | 135 | 30.8% |
| 2-Person Household | 112 | 25.6% |
| 3-Person Household | 72 | 16.4% |
| 4+ Person Household | 119 | 27.2% |
| Total Housing Units | 438 | 100.0% |
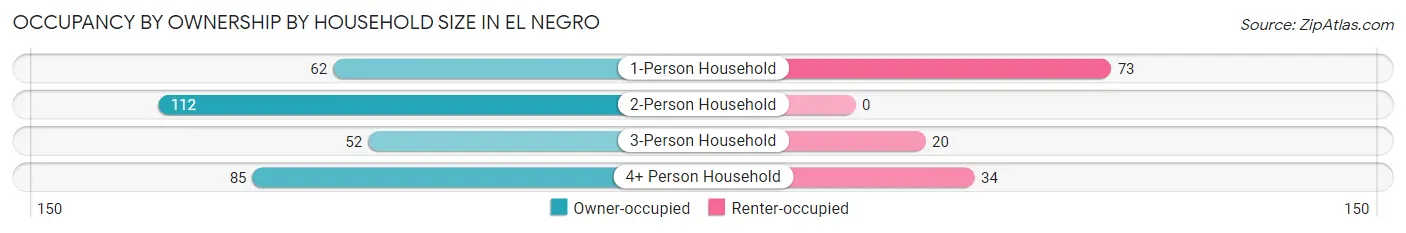
Occupancy by Ownership by Household Size in El Negro
| Household Size | Owner-occupied | Renter-occupied |
| 1-Person Household | 62 (45.9%) | 73 (54.1%) |
| 2-Person Household | 112 (100.0%) | 0 (0.0%) |
| 3-Person Household | 52 (72.2%) | 20 (27.8%) |
| 4+ Person Household | 85 (71.4%) | 34 (28.6%) |
| Total Housing Units | 311 (71.0%) | 127 (29.0%) |
Occupancy by Educational Attainment in El Negro
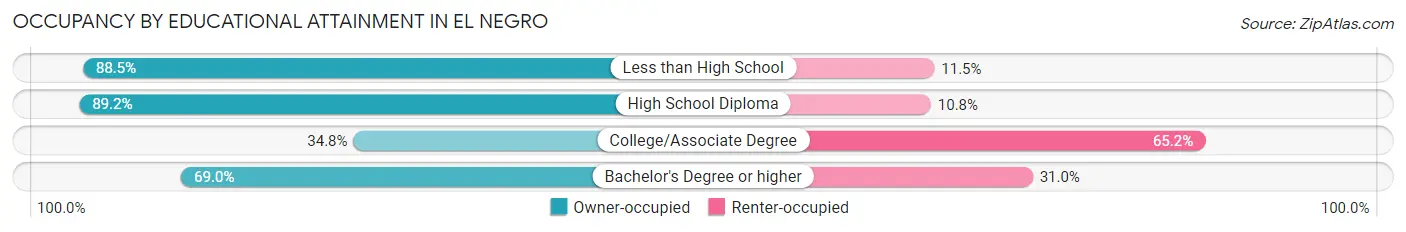
| Household Size | Owner-occupied | Renter-occupied |
| Less than High School | 138 (88.5%) | 18 (11.5%) |
| High School Diploma | 74 (89.2%) | 9 (10.8%) |
| College/Associate Degree | 39 (34.8%) | 73 (65.2%) |
| Bachelor's Degree or higher | 60 (69.0%) | 27 (31.0%) |
Occupancy by Age of Householder in El Negro
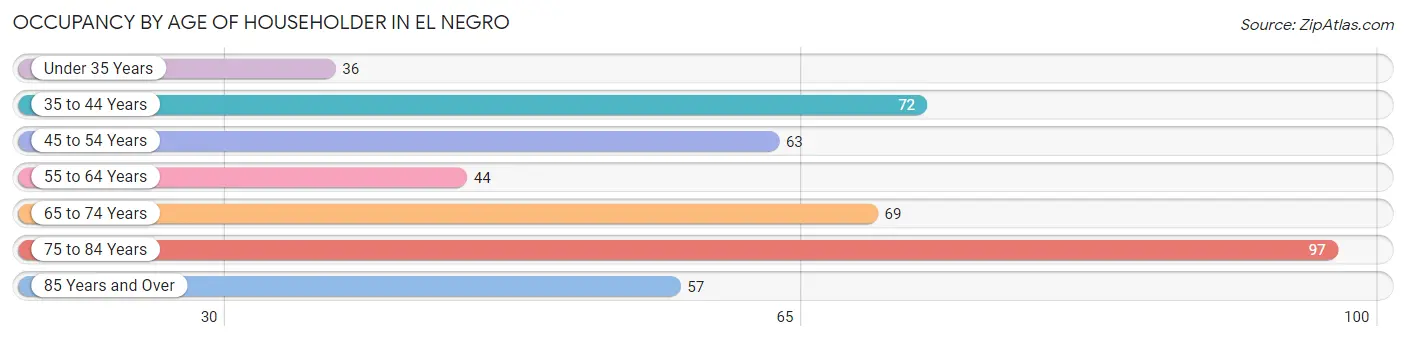
| Age Bracket | # Households | % Households |
| Under 35 Years | 36 | 8.2% |
| 35 to 44 Years | 72 | 16.4% |
| 45 to 54 Years | 63 | 14.4% |
| 55 to 64 Years | 44 | 10.1% |
| 65 to 74 Years | 69 | 15.8% |
| 75 to 84 Years | 97 | 22.2% |
| 85 Years and Over | 57 | 13.0% |
| Total | 438 | 100.0% |
Housing Finances in El Negro
Median Income by Occupancy in El Negro
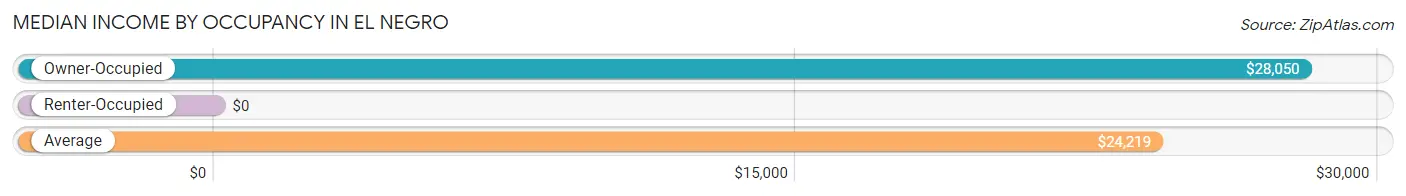
| Occupancy Type | # Households | Median Income |
| Owner-Occupied | 311 (71.0%) | $28,050 |
| Renter-Occupied | 127 (29.0%) | $0 |
| Average | 438 (100.0%) | $24,219 |
Occupancy by Householder Income Bracket in El Negro
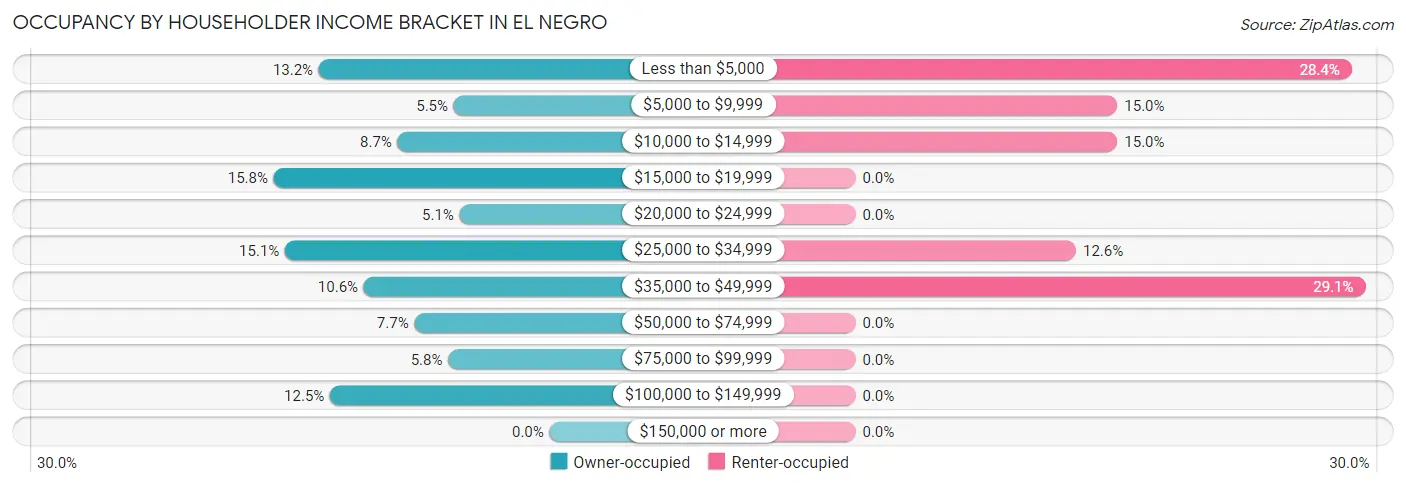
| Income Bracket | Owner-occupied | Renter-occupied |
| Less than $5,000 | 41 (13.2%) | 36 (28.3%) |
| $5,000 to $9,999 | 17 (5.5%) | 19 (15.0%) |
| $10,000 to $14,999 | 27 (8.7%) | 19 (15.0%) |
| $15,000 to $19,999 | 49 (15.8%) | 0 (0.0%) |
| $20,000 to $24,999 | 16 (5.1%) | 0 (0.0%) |
| $25,000 to $34,999 | 47 (15.1%) | 16 (12.6%) |
| $35,000 to $49,999 | 33 (10.6%) | 37 (29.1%) |
| $50,000 to $74,999 | 24 (7.7%) | 0 (0.0%) |
| $75,000 to $99,999 | 18 (5.8%) | 0 (0.0%) |
| $100,000 to $149,999 | 39 (12.5%) | 0 (0.0%) |
| $150,000 or more | 0 (0.0%) | 0 (0.0%) |
| Total | 311 (100.0%) | 127 (100.0%) |
Monthly Housing Cost Tiers in El Negro
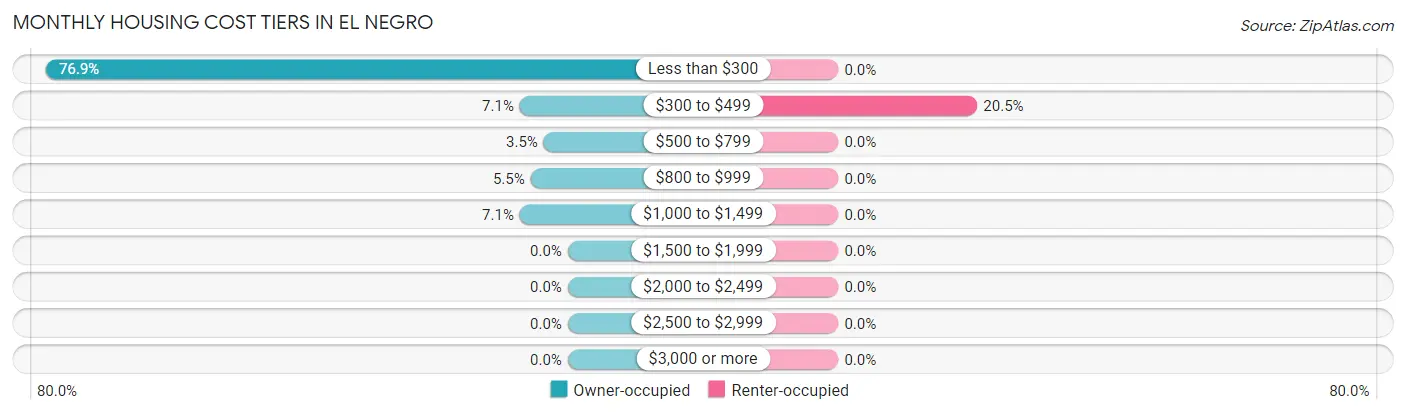
| Monthly Cost | Owner-occupied | Renter-occupied |
| Less than $300 | 239 (76.8%) | 0 (0.0%) |
| $300 to $499 | 22 (7.1%) | 26 (20.5%) |
| $500 to $799 | 11 (3.5%) | 0 (0.0%) |
| $800 to $999 | 17 (5.5%) | 0 (0.0%) |
| $1,000 to $1,499 | 22 (7.1%) | 0 (0.0%) |
| $1,500 to $1,999 | 0 (0.0%) | 0 (0.0%) |
| $2,000 to $2,499 | 0 (0.0%) | 0 (0.0%) |
| $2,500 to $2,999 | 0 (0.0%) | 0 (0.0%) |
| $3,000 or more | 0 (0.0%) | 0 (0.0%) |
| Total | 311 (100.0%) | 127 (100.0%) |
Physical Housing Characteristics in El Negro
Housing Structures in El Negro
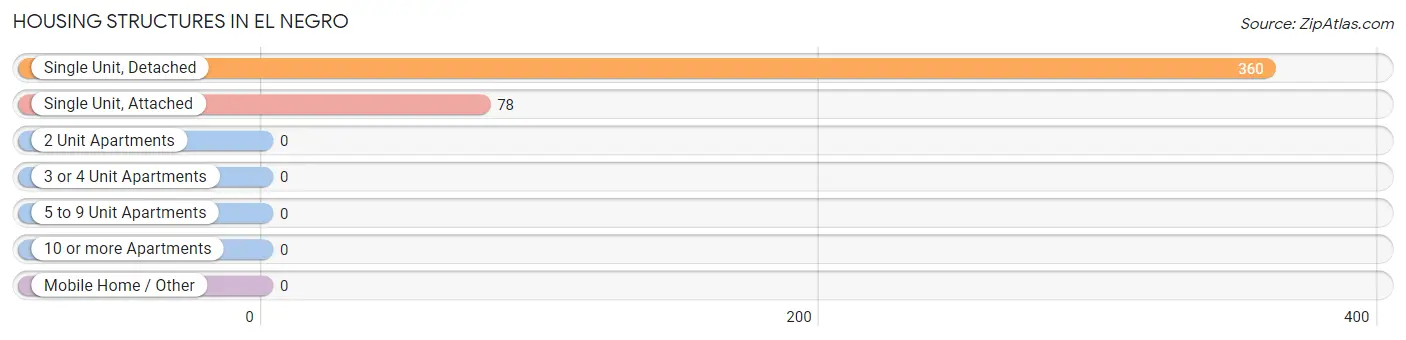
| Structure Type | # Housing Units | % Housing Units |
| Single Unit, Detached | 360 | 82.2% |
| Single Unit, Attached | 78 | 17.8% |
| 2 Unit Apartments | 0 | 0.0% |
| 3 or 4 Unit Apartments | 0 | 0.0% |
| 5 to 9 Unit Apartments | 0 | 0.0% |
| 10 or more Apartments | 0 | 0.0% |
| Mobile Home / Other | 0 | 0.0% |
| Total | 438 | 100.0% |
Housing Structures by Occupancy in El Negro
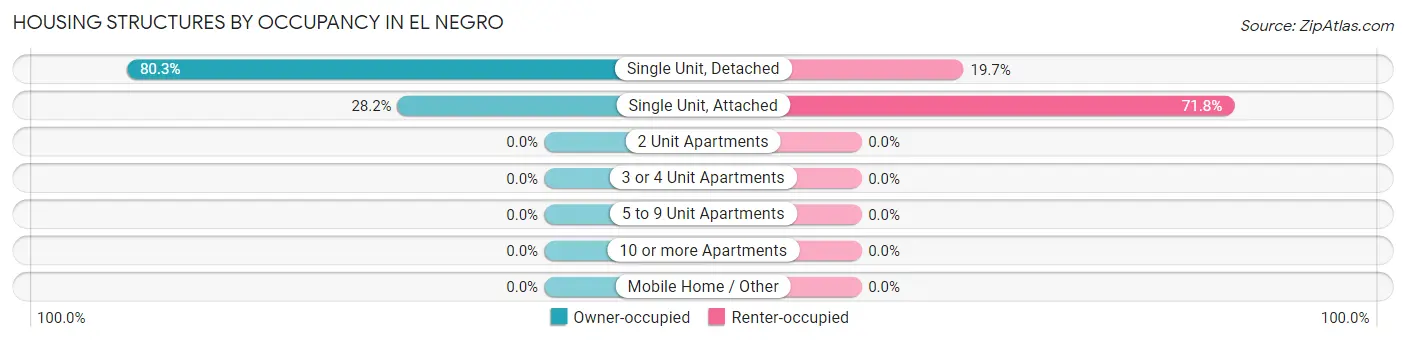
| Structure Type | Owner-occupied | Renter-occupied |
| Single Unit, Detached | 289 (80.3%) | 71 (19.7%) |
| Single Unit, Attached | 22 (28.2%) | 56 (71.8%) |
| 2 Unit Apartments | 0 (0.0%) | 0 (0.0%) |
| 3 or 4 Unit Apartments | 0 (0.0%) | 0 (0.0%) |
| 5 to 9 Unit Apartments | 0 (0.0%) | 0 (0.0%) |
| 10 or more Apartments | 0 (0.0%) | 0 (0.0%) |
| Mobile Home / Other | 0 (0.0%) | 0 (0.0%) |
| Total | 311 (71.0%) | 127 (29.0%) |
Housing Structures by Number of Rooms in El Negro
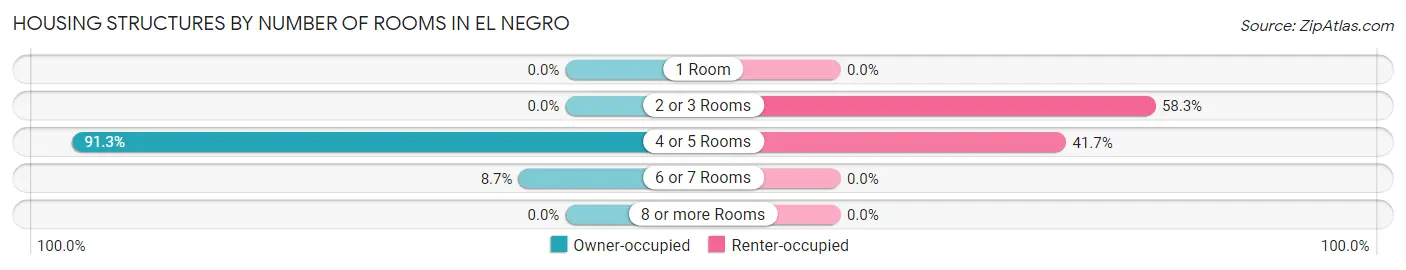
| Number of Rooms | Owner-occupied | Renter-occupied |
| 1 Room | 0 (0.0%) | 0 (0.0%) |
| 2 or 3 Rooms | 0 (0.0%) | 74 (58.3%) |
| 4 or 5 Rooms | 284 (91.3%) | 53 (41.7%) |
| 6 or 7 Rooms | 27 (8.7%) | 0 (0.0%) |
| 8 or more Rooms | 0 (0.0%) | 0 (0.0%) |
| Total | 311 (100.0%) | 127 (100.0%) |
Housing Structure by Heating Type in El Negro
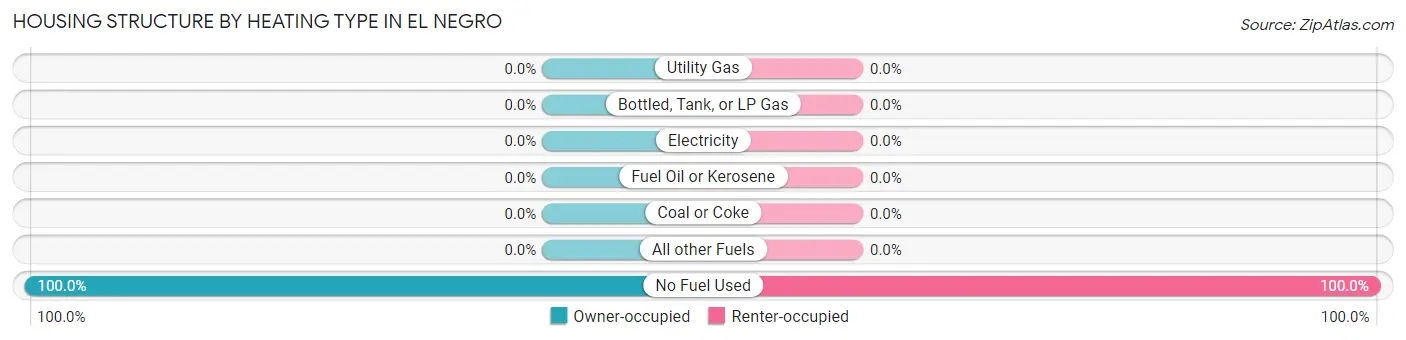
| Heating Type | Owner-occupied | Renter-occupied |
| Utility Gas | 0 (0.0%) | 0 (0.0%) |
| Bottled, Tank, or LP Gas | 0 (0.0%) | 0 (0.0%) |
| Electricity | 0 (0.0%) | 0 (0.0%) |
| Fuel Oil or Kerosene | 0 (0.0%) | 0 (0.0%) |
| Coal or Coke | 0 (0.0%) | 0 (0.0%) |
| All other Fuels | 0 (0.0%) | 0 (0.0%) |
| No Fuel Used | 311 (100.0%) | 127 (100.0%) |
| Total | 311 (100.0%) | 127 (100.0%) |
Household Vehicle Usage in El Negro
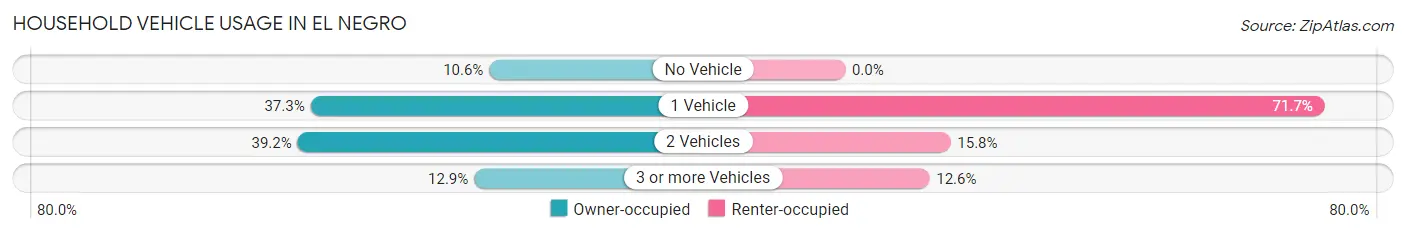
| Vehicles per Household | Owner-occupied | Renter-occupied |
| No Vehicle | 33 (10.6%) | 0 (0.0%) |
| 1 Vehicle | 116 (37.3%) | 91 (71.7%) |
| 2 Vehicles | 122 (39.2%) | 20 (15.8%) |
| 3 or more Vehicles | 40 (12.9%) | 16 (12.6%) |
| Total | 311 (100.0%) | 127 (100.0%) |
Real Estate & Mortgages in El Negro
Real Estate and Mortgage Overview in El Negro
| Characteristic | Without Mortgage | With Mortgage |
| Housing Units | 261 | 50 |
| Median Property Value | $92,300 | $145,600 |
| Median Household Income | $23,672 | $0 |
| Monthly Housing Costs | $148 | $0 |
| Real Estate Taxes | - | - |
Property Value by Mortgage Status in El Negro
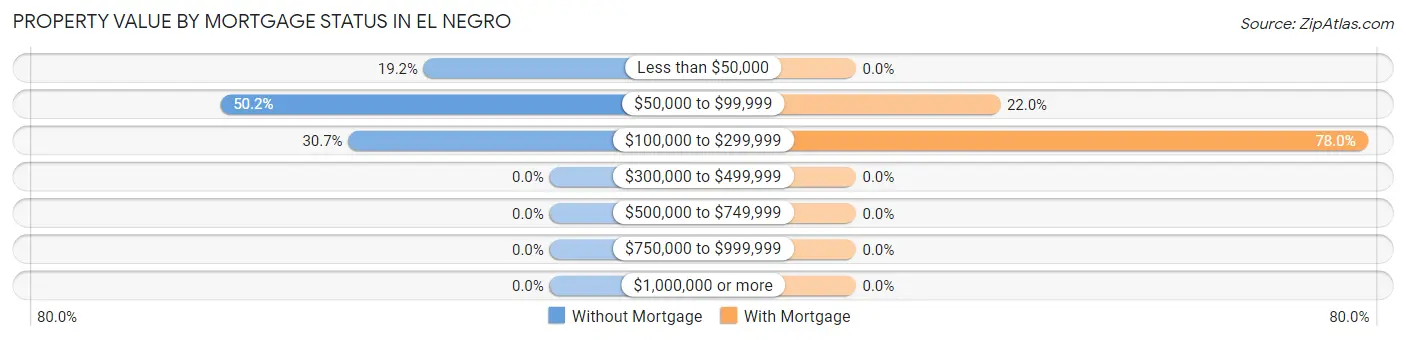
| Property Value | Without Mortgage | With Mortgage |
| Less than $50,000 | 50 (19.2%) | 0 (0.0%) |
| $50,000 to $99,999 | 131 (50.2%) | 11 (22.0%) |
| $100,000 to $299,999 | 80 (30.6%) | 39 (78.0%) |
| $300,000 to $499,999 | 0 (0.0%) | 0 (0.0%) |
| $500,000 to $749,999 | 0 (0.0%) | 0 (0.0%) |
| $750,000 to $999,999 | 0 (0.0%) | 0 (0.0%) |
| $1,000,000 or more | 0 (0.0%) | 0 (0.0%) |
| Total | 261 (100.0%) | 50 (100.0%) |
Household Income by Mortgage Status in El Negro
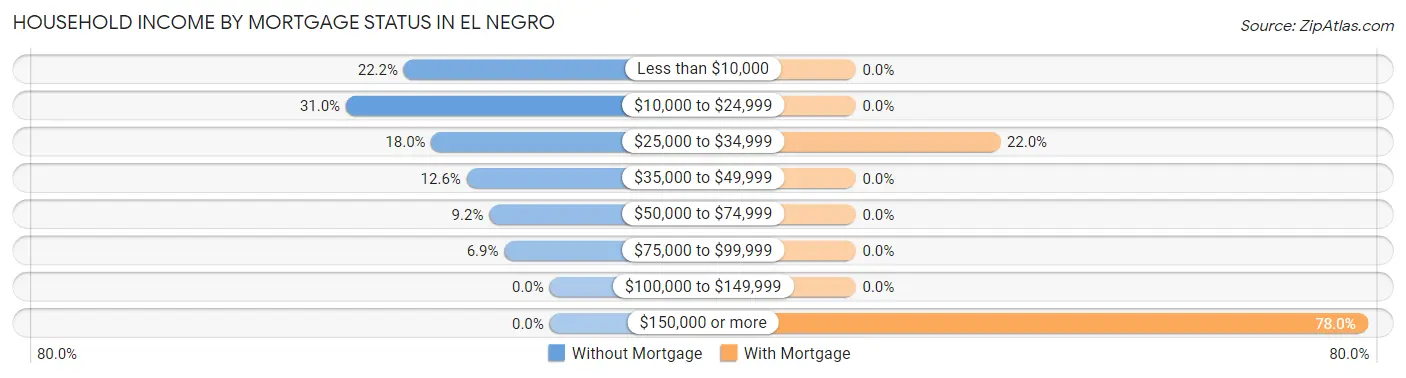
| Household Income | Without Mortgage | With Mortgage |
| Less than $10,000 | 58 (22.2%) | 0 (0.0%) |
| $10,000 to $24,999 | 81 (31.0%) | 0 (0.0%) |
| $25,000 to $34,999 | 47 (18.0%) | 11 (22.0%) |
| $35,000 to $49,999 | 33 (12.6%) | 0 (0.0%) |
| $50,000 to $74,999 | 24 (9.2%) | 0 (0.0%) |
| $75,000 to $99,999 | 18 (6.9%) | 0 (0.0%) |
| $100,000 to $149,999 | 0 (0.0%) | 0 (0.0%) |
| $150,000 or more | 0 (0.0%) | 39 (78.0%) |
| Total | 261 (100.0%) | 50 (100.0%) |
Property Value to Household Income Ratio in El Negro
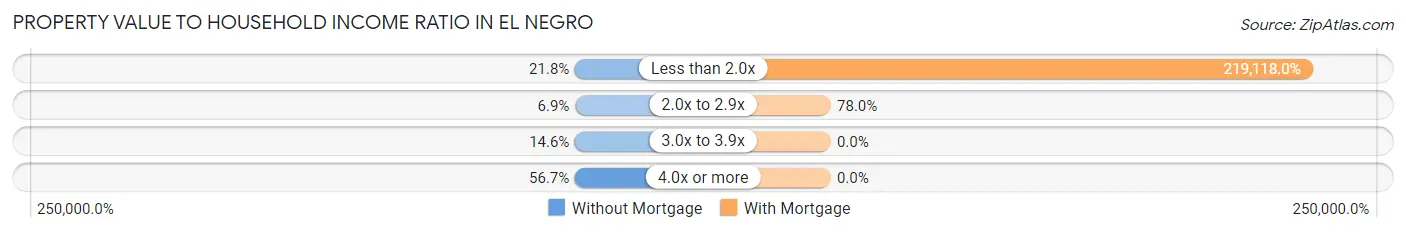
| Value-to-Income Ratio | Without Mortgage | With Mortgage |
| Less than 2.0x | 57 (21.8%) | 109,559 (219,118.0%) |
| 2.0x to 2.9x | 18 (6.9%) | 39 (78.0%) |
| 3.0x to 3.9x | 38 (14.6%) | 0 (0.0%) |
| 4.0x or more | 148 (56.7%) | 0 (0.0%) |
| Total | 261 (100.0%) | 50 (100.0%) |
Real Estate Taxes by Mortgage Status in El Negro

| Property Taxes | Without Mortgage | With Mortgage |
| Less than $800 | 42 (16.1%) | 0 (0.0%) |
| $800 to $1,499 | 0 (0.0%) | 0 (0.0%) |
| $800 to $1,499 | 0 (0.0%) | 0 (0.0%) |
| Total | 261 (100.0%) | 50 (100.0%) |
Health & Disability in El Negro
Health Insurance Coverage by Age in El Negro
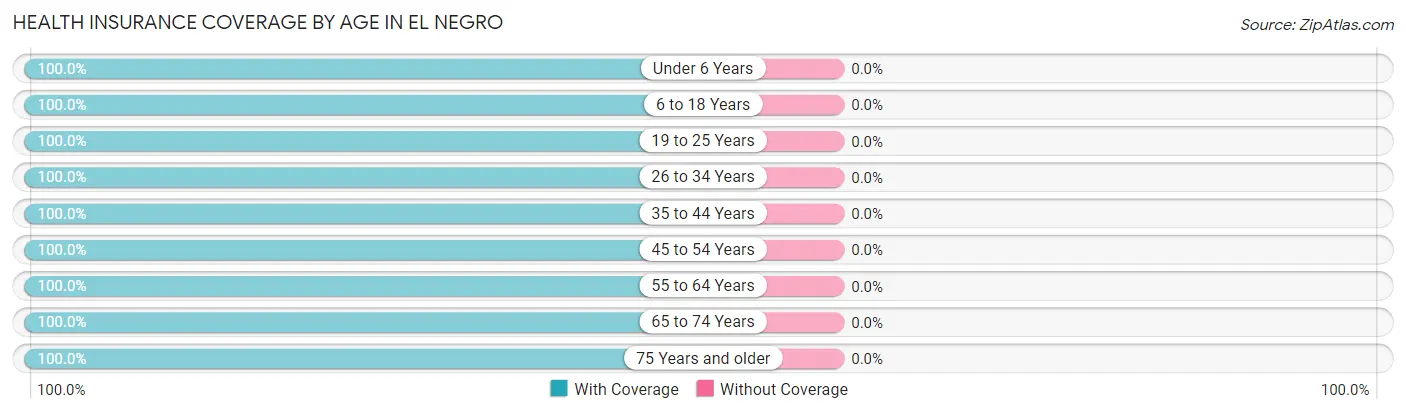
| Age Bracket | With Coverage | Without Coverage |
| Under 6 Years | 122 (100.0%) | 0 (0.0%) |
| 6 to 18 Years | 132 (100.0%) | 0 (0.0%) |
| 19 to 25 Years | 186 (100.0%) | 0 (0.0%) |
| 26 to 34 Years | 67 (100.0%) | 0 (0.0%) |
| 35 to 44 Years | 165 (100.0%) | 0 (0.0%) |
| 45 to 54 Years | 121 (100.0%) | 0 (0.0%) |
| 55 to 64 Years | 73 (100.0%) | 0 (0.0%) |
| 65 to 74 Years | 133 (100.0%) | 0 (0.0%) |
| 75 Years and older | 263 (100.0%) | 0 (0.0%) |
| Total | 1,262 (100.0%) | 0 (0.0%) |
Health Insurance Coverage by Citizenship Status in El Negro

| Citizenship Status | With Coverage | Without Coverage |
| Native Born | 122 (100.0%) | 0 (0.0%) |
| Foreign Born, Citizen | 132 (100.0%) | 0 (0.0%) |
| Foreign Born, not a Citizen | 186 (100.0%) | 0 (0.0%) |
Health Insurance Coverage by Household Income in El Negro

| Household Income | With Coverage | Without Coverage |
| Under $25,000 | 528 (100.0%) | 0 (0.0%) |
| $25,000 to $49,999 | 434 (100.0%) | 0 (0.0%) |
| $50,000 to $74,999 | 44 (100.0%) | 0 (0.0%) |
| $75,000 to $99,999 | 57 (100.0%) | 0 (0.0%) |
| $100,000 and over | 199 (100.0%) | 0 (0.0%) |
Public vs Private Health Insurance Coverage by Age in El Negro
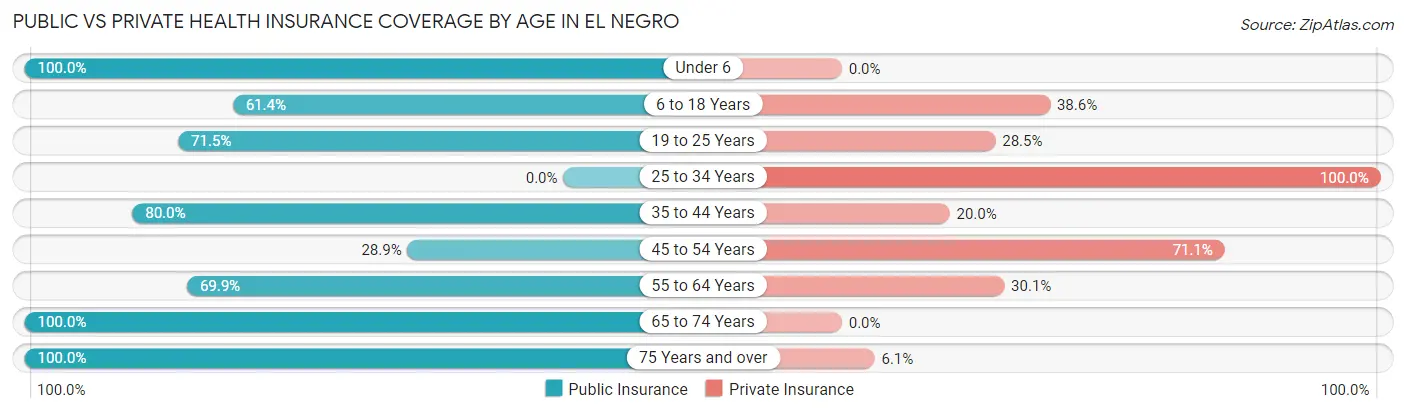
| Age Bracket | Public Insurance | Private Insurance |
| Under 6 | 122 (100.0%) | 0 (0.0%) |
| 6 to 18 Years | 81 (61.4%) | 51 (38.6%) |
| 19 to 25 Years | 133 (71.5%) | 53 (28.5%) |
| 25 to 34 Years | 0 (0.0%) | 67 (100.0%) |
| 35 to 44 Years | 132 (80.0%) | 33 (20.0%) |
| 45 to 54 Years | 35 (28.9%) | 86 (71.1%) |
| 55 to 64 Years | 51 (69.9%) | 22 (30.1%) |
| 65 to 74 Years | 133 (100.0%) | 0 (0.0%) |
| 75 Years and over | 263 (100.0%) | 16 (6.1%) |
| Total | 950 (75.3%) | 328 (26.0%) |
Disability Status by Sex by Age in El Negro
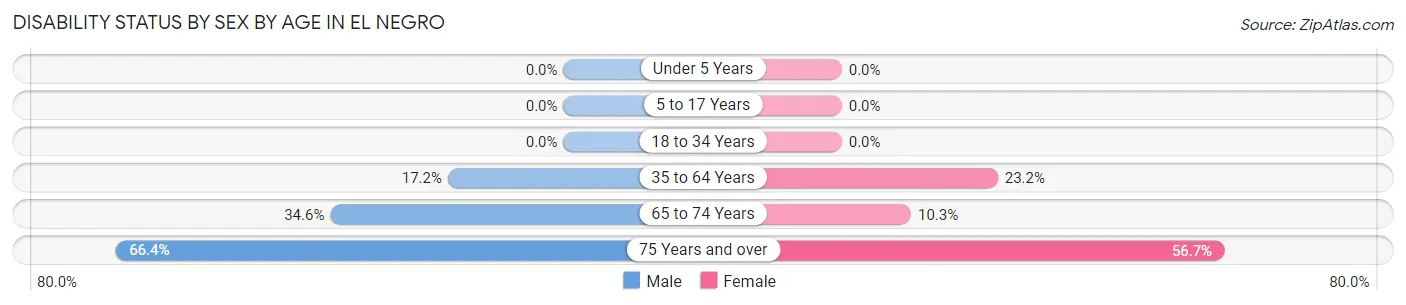
| Age Bracket | Male | Female |
| Under 5 Years | 0 (0.0%) | 0 (0.0%) |
| 5 to 17 Years | 0 (0.0%) | 0 (0.0%) |
| 18 to 34 Years | 0 (0.0%) | 0 (0.0%) |
| 35 to 64 Years | 29 (17.2%) | 44 (23.2%) |
| 65 to 74 Years | 9 (34.6%) | 11 (10.3%) |
| 75 Years and over | 81 (66.4%) | 80 (56.7%) |
Disability Class by Sex by Age in El Negro
Disability Class: Hearing Difficulty
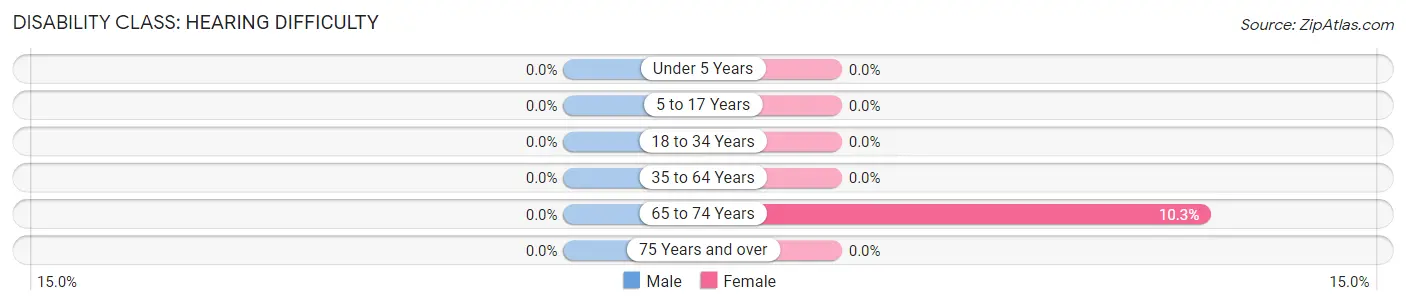
| Age Bracket | Male | Female |
| Under 5 Years | 0 (0.0%) | 0 (0.0%) |
| 5 to 17 Years | 0 (0.0%) | 0 (0.0%) |
| 18 to 34 Years | 0 (0.0%) | 0 (0.0%) |
| 35 to 64 Years | 0 (0.0%) | 0 (0.0%) |
| 65 to 74 Years | 0 (0.0%) | 11 (10.3%) |
| 75 Years and over | 0 (0.0%) | 0 (0.0%) |
Disability Class: Vision Difficulty
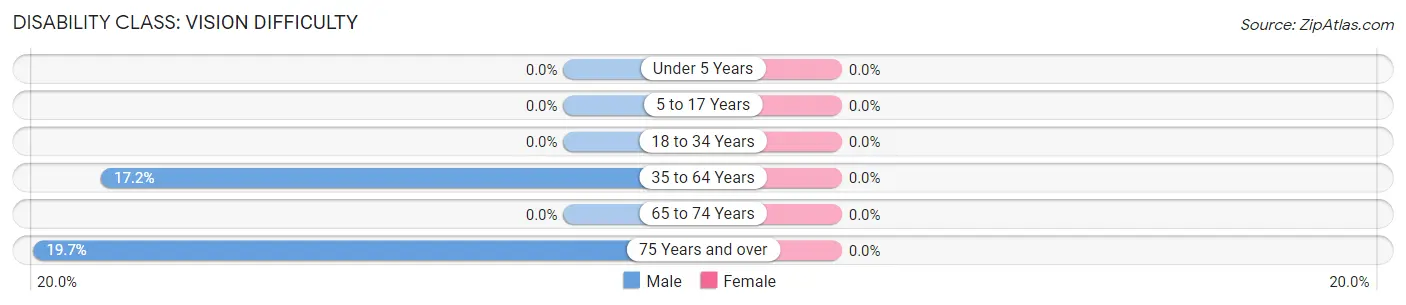
| Age Bracket | Male | Female |
| Under 5 Years | 0 (0.0%) | 0 (0.0%) |
| 5 to 17 Years | 0 (0.0%) | 0 (0.0%) |
| 18 to 34 Years | 0 (0.0%) | 0 (0.0%) |
| 35 to 64 Years | 29 (17.2%) | 0 (0.0%) |
| 65 to 74 Years | 0 (0.0%) | 0 (0.0%) |
| 75 Years and over | 24 (19.7%) | 0 (0.0%) |
Disability Class: Cognitive Difficulty
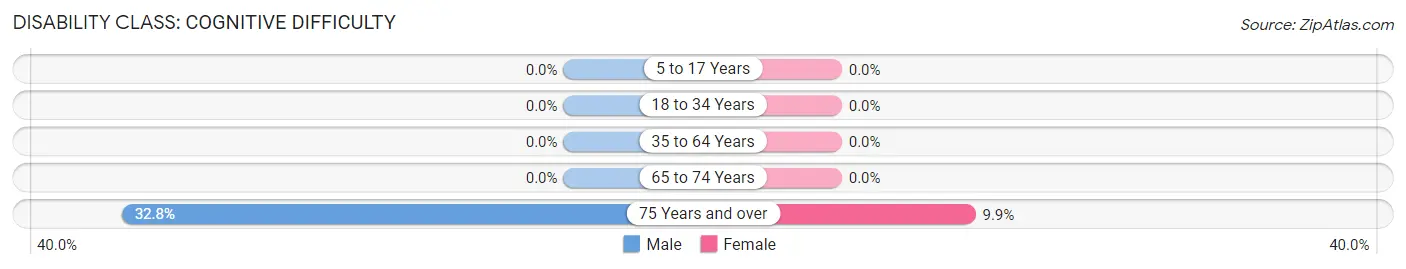
| Age Bracket | Male | Female |
| 5 to 17 Years | 0 (0.0%) | 0 (0.0%) |
| 18 to 34 Years | 0 (0.0%) | 0 (0.0%) |
| 35 to 64 Years | 0 (0.0%) | 0 (0.0%) |
| 65 to 74 Years | 0 (0.0%) | 0 (0.0%) |
| 75 Years and over | 40 (32.8%) | 14 (9.9%) |
Disability Class: Ambulatory Difficulty
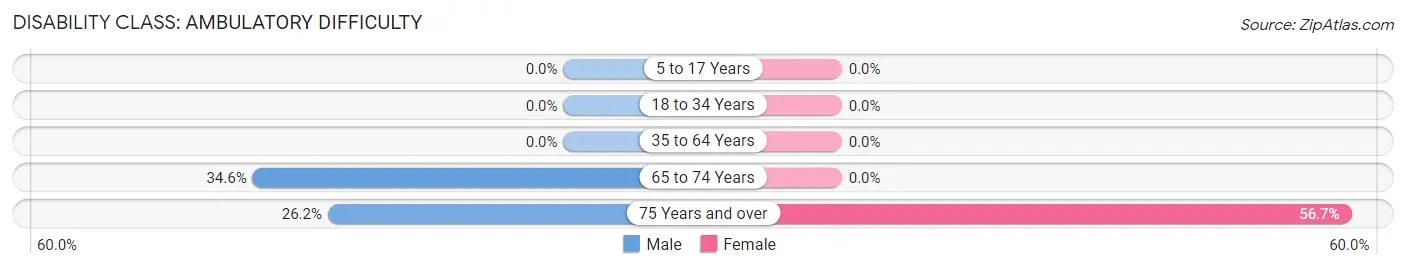
| Age Bracket | Male | Female |
| 5 to 17 Years | 0 (0.0%) | 0 (0.0%) |
| 18 to 34 Years | 0 (0.0%) | 0 (0.0%) |
| 35 to 64 Years | 0 (0.0%) | 0 (0.0%) |
| 65 to 74 Years | 9 (34.6%) | 0 (0.0%) |
| 75 Years and over | 32 (26.2%) | 80 (56.7%) |
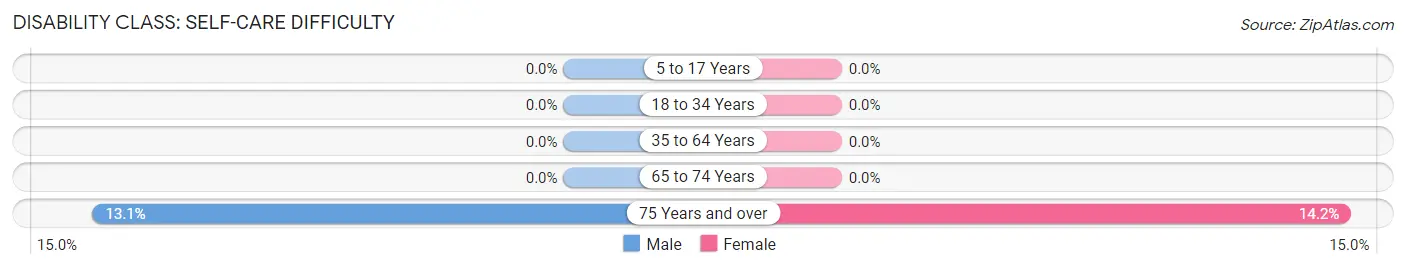
Disability Class: Self-Care Difficulty
| Age Bracket | Male | Female |
| 5 to 17 Years | 0 (0.0%) | 0 (0.0%) |
| 18 to 34 Years | 0 (0.0%) | 0 (0.0%) |
| 35 to 64 Years | 0 (0.0%) | 0 (0.0%) |
| 65 to 74 Years | 0 (0.0%) | 0 (0.0%) |
| 75 Years and over | 16 (13.1%) | 20 (14.2%) |
Technology Access in El Negro
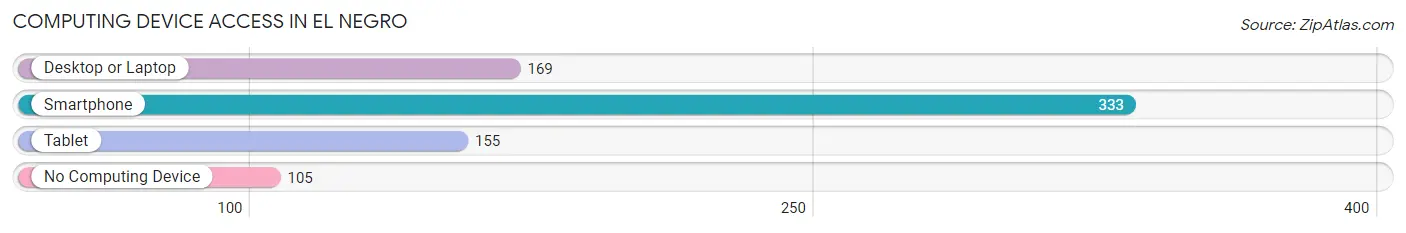
Computing Device Access in El Negro
| Device Type | # Households | % Households |
| Desktop or Laptop | 169 | 38.6% |
| Smartphone | 333 | 76.0% |
| Tablet | 155 | 35.4% |
| No Computing Device | 105 | 24.0% |
| Total | 438 | 100.0% |
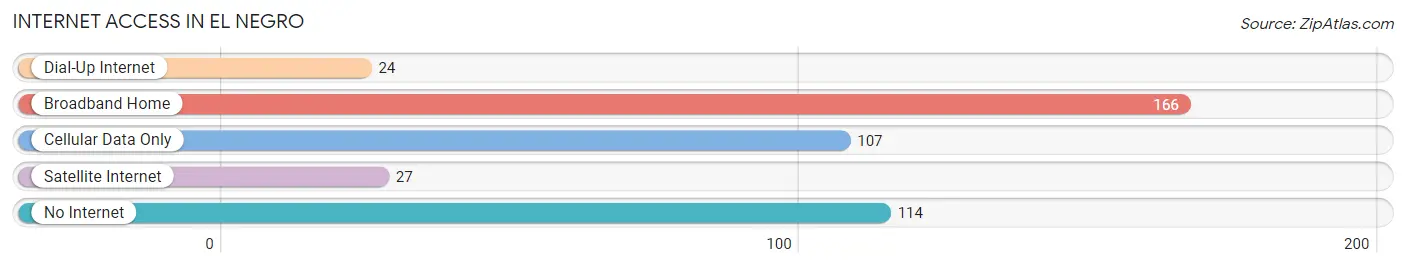
Internet Access in El Negro
| Internet Type | # Households | % Households |
| Dial-Up Internet | 24 | 5.5% |
| Broadband Home | 166 | 37.9% |
| Cellular Data Only | 107 | 24.4% |
| Satellite Internet | 27 | 6.2% |
| No Internet | 114 | 26.0% |
| Total | 438 | 100.0% |
El Negro Summary
Negro, Puerto Rico is a small municipality located in the central region of the island of Puerto Rico. It is part of the San Juan-Caguas-Guaynabo Metropolitan Statistical Area. The population of Negro in 2000 was 4,845.
Geography
Negro is located in the central region of Puerto Rico, in the municipality of Caguas. It is bordered by the municipalities of Gurabo to the north, Caguas to the east, San Lorenzo to the south, and Cidra to the west. The terrain of Negro is mostly flat, with some hills in the northern part of the municipality. The highest point is Cerro de la Cruz, which is located in the northern part of the municipality and has an elevation of 1,068 feet (325 meters). The climate in Negro is tropical, with an average temperature of 79°F (26°C).
Economy
The economy of Negro is largely based on agriculture. The main crops grown in the municipality are coffee, plantains, bananas, and sugarcane. Other industries in the municipality include manufacturing, construction, and tourism.
Demographics
In 2000, the population of Negro was 4,845, with a population density of 1,845 people per square mile (715 people per square kilometer). The racial makeup of the municipality was 97.3% Hispanic or Latino, 1.2% White, 0.3% Black or African American, 0.2% Native American, 0.2% Asian, and 0.9% from other races. The median household income in Negro was $14,845, and the median family income was $17,845.
Conclusion
Negro, Puerto Rico is a small municipality located in the central region of the island of Puerto Rico. It is part of the San Juan-Caguas-Guaynabo Metropolitan Statistical Area. The economy of Negro is largely based on agriculture, with other industries including manufacturing, construction, and tourism. In 2000, the population of Negro was 4,845, with a population density of 1,845 people per square mile (715 people per square kilometer). The racial makeup of the municipality was 97.3% Hispanic or Latino, 1.2% White, 0.3% Black or African American, 0.2% Native American, 0.2% Asian, and 0.9% from other races. The median household income in Negro was $14,845, and the median family income was $17,845.
Common Questions
What is Per Capita Income in El Negro?
Per Capita income in El Negro is $12,811.
What is the Median Family Income in El Negro?
Median Family Income in El Negro is $30,057.
What is the Median Household income in El Negro?
Median Household Income in El Negro is $24,219.
What is Income or Wage Gap in El Negro?
Income or Wage Gap in El Negro is 20.2%.
Women in El Negro earn 79.8 cents for every dollar earned by a man.
What is Inequality or Gini Index in El Negro?
Inequality or Gini Index in El Negro is 0.48.
What is the Total Population of El Negro?
Total Population of El Negro is 1,262.
What is the Total Male Population of El Negro?
Total Male Population of El Negro is 594.
What is the Total Female Population of El Negro?
Total Female Population of El Negro is 668.
What is the Ratio of Males per 100 Females in El Negro?
There are 88.92 Males per 100 Females in El Negro.
What is the Ratio of Females per 100 Males in El Negro?
There are 112.46 Females per 100 Males in El Negro.
What is the Median Population Age in El Negro?
Median Population Age in El Negro is 42.3 Years.
What is the Average Family Size in El Negro
Average Family Size in El Negro is 3.6 People.
What is the Average Household Size in El Negro
Average Household Size in El Negro is 2.9 People.
How Large is the Labor Force in El Negro?
There are 518 People in the Labor Forcein in El Negro.
What is the Percentage of People in the Labor Force in El Negro?
50.0% of People are in the Labor Force in El Negro.
What is the Unemployment Rate in El Negro?
Unemployment Rate in El Negro is 24.7%.