Cayuco, PR Map & Demographics
Cayuco Map
Cayuco Overview
$8,255
PER CAPITA INCOME
$15,263
AVG FAMILY INCOME
2.3%
WAGE / INCOME GAP [ % ]
97.7¢/ $1
WAGE / INCOME GAP [ $ ]
0.62
INEQUALITY / GINI INDEX
1,031
TOTAL POPULATION
544
MALE POPULATION
487
FEMALE POPULATION
111.70
MALES / 100 FEMALES
89.52
FEMALES / 100 MALES
37.9
MEDIAN AGE
3.4
AVG FAMILY SIZE
2.8
AVG HOUSEHOLD SIZE
294
LABOR FORCE [ PEOPLE ]
37.8%
PERCENT IN LABOR FORCE
43.2%
UNEMPLOYMENT RATE
Income in Cayuco
Income Overview in Cayuco
| Characteristic | Number | Measure |
| Per Capita Income | 1,031 | $8,255 |
| Median Family Income | 268 | $15,263 |
| Mean Family Income | 268 | $25,150 |
| Median Household Income | 364 | $0 |
| Mean Household Income | 364 | $19,467 |
| Income Deficit | 268 | $0 |
| Wage / Income Gap (%) | 1,031 | 2.27% |
| Wage / Income Gap ($) | 1,031 | 97.73¢ per $1 |
| Gini / Inequality Index | 1,031 | 0.62 |
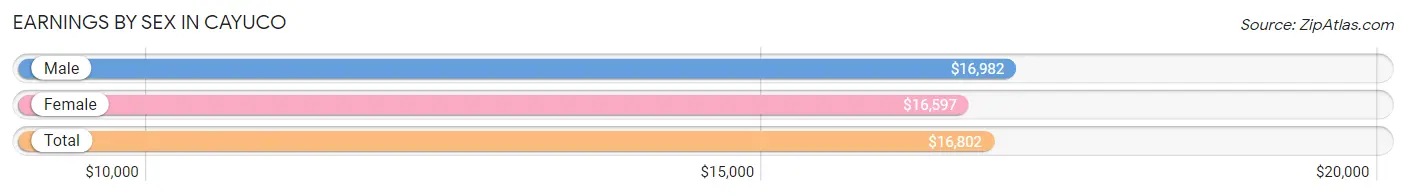
Earnings by Sex in Cayuco
Average Earnings in Cayuco are $16,802, $16,982 for men and $16,597 for women, a difference of 2.3%.
| Sex | Number | Average Earnings |
| Male | 65 (30.8%) | $16,982 |
| Female | 146 (69.2%) | $16,597 |
| Total | 211 (100.0%) | $16,802 |
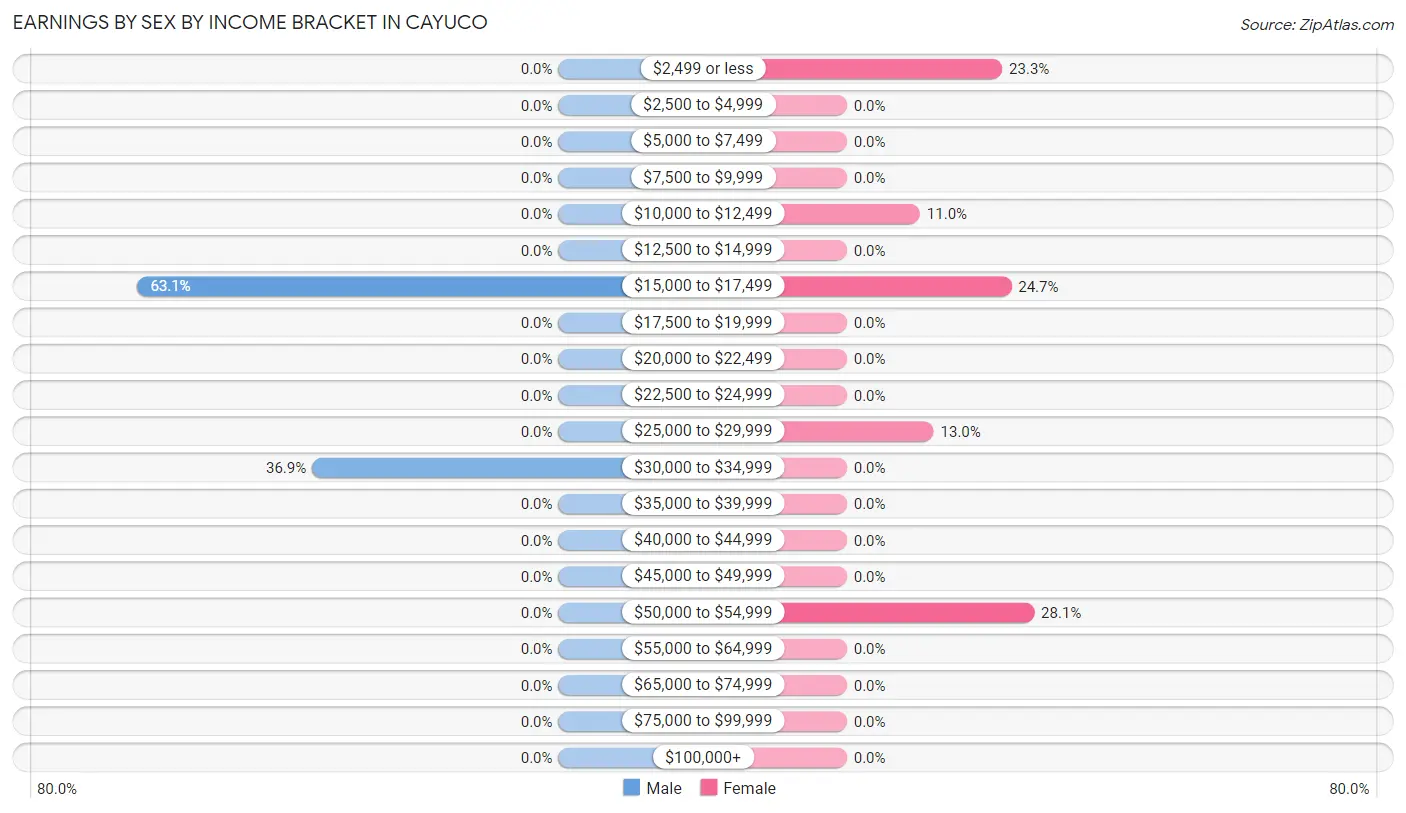
Earnings by Sex by Income Bracket in Cayuco
The most common earnings brackets in Cayuco are $15,000 to $17,499 for men (41 | 63.1%) and $50,000 to $54,999 for women (41 | 28.1%).
| Income | Male | Female |
| $2,499 or less | 0 (0.0%) | 34 (23.3%) |
| $2,500 to $4,999 | 0 (0.0%) | 0 (0.0%) |
| $5,000 to $7,499 | 0 (0.0%) | 0 (0.0%) |
| $7,500 to $9,999 | 0 (0.0%) | 0 (0.0%) |
| $10,000 to $12,499 | 0 (0.0%) | 16 (11.0%) |
| $12,500 to $14,999 | 0 (0.0%) | 0 (0.0%) |
| $15,000 to $17,499 | 41 (63.1%) | 36 (24.7%) |
| $17,500 to $19,999 | 0 (0.0%) | 0 (0.0%) |
| $20,000 to $22,499 | 0 (0.0%) | 0 (0.0%) |
| $22,500 to $24,999 | 0 (0.0%) | 0 (0.0%) |
| $25,000 to $29,999 | 0 (0.0%) | 19 (13.0%) |
| $30,000 to $34,999 | 24 (36.9%) | 0 (0.0%) |
| $35,000 to $39,999 | 0 (0.0%) | 0 (0.0%) |
| $40,000 to $44,999 | 0 (0.0%) | 0 (0.0%) |
| $45,000 to $49,999 | 0 (0.0%) | 0 (0.0%) |
| $50,000 to $54,999 | 0 (0.0%) | 41 (28.1%) |
| $55,000 to $64,999 | 0 (0.0%) | 0 (0.0%) |
| $65,000 to $74,999 | 0 (0.0%) | 0 (0.0%) |
| $75,000 to $99,999 | 0 (0.0%) | 0 (0.0%) |
| $100,000+ | 0 (0.0%) | 0 (0.0%) |
| Total | 65 (100.0%) | 146 (100.0%) |
Earnings by Sex by Educational Attainment in Cayuco
| Educational Attainment | Male Income | Female Income |
| Less than High School | - | - |
| High School Diploma | - | - |
| College or Associate's Degree | - | - |
| Bachelor's Degree | - | - |
| Graduate Degree | - | - |
| Total | $16,982 | $0 |
Family Income in Cayuco
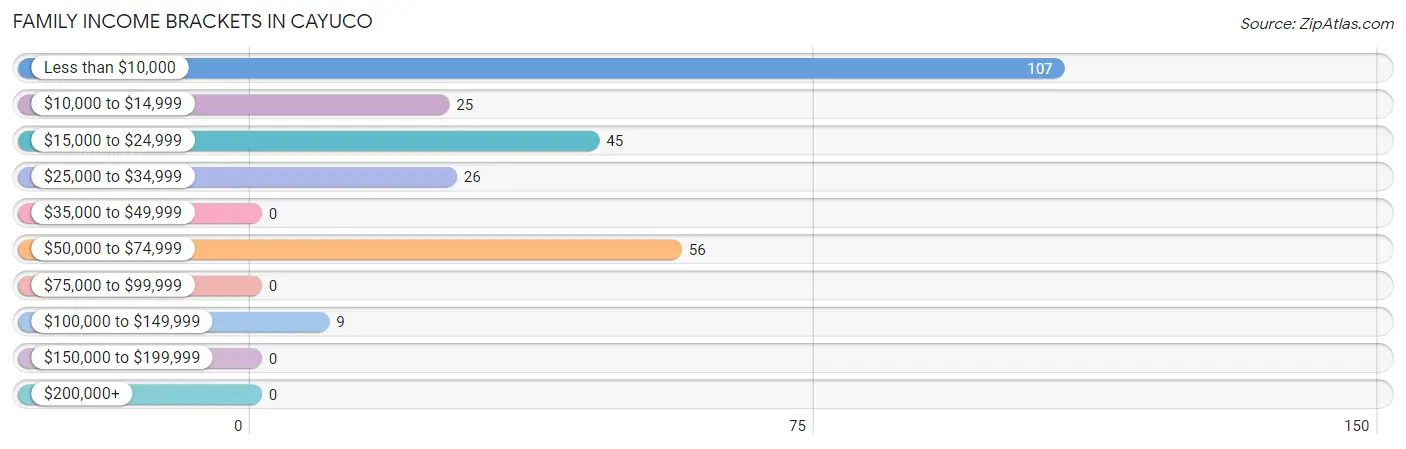
Family Income Brackets in Cayuco
According to the Cayuco family income data, there are 107 families falling into the less than $10,000 income range, which is the most common income bracket and makes up 39.9% of all families.
| Income Bracket | # Families | % Families |
| Less than $10,000 | 107 | 39.9% |
| $10,000 to $14,999 | 25 | 9.3% |
| $15,000 to $24,999 | 45 | 16.8% |
| $25,000 to $34,999 | 26 | 9.7% |
| $35,000 to $49,999 | 0 | 0.0% |
| $50,000 to $74,999 | 56 | 20.9% |
| $75,000 to $99,999 | 0 | 0.0% |
| $100,000 to $149,999 | 9 | 3.4% |
| $150,000 to $199,999 | 0 | 0.0% |
| $200,000+ | 0 | 0.0% |
Family Income by Famaliy Size in Cayuco
| Income Bracket | # Families | Median Income |
| 2-Person Families | 97 (36.2%) | $0 |
| 3-Person Families | 125 (46.6%) | $0 |
| 4-Person Families | 46 (17.2%) | $0 |
| 5-Person Families | 0 (0.0%) | $0 |
| 6-Person Families | 0 (0.0%) | $0 |
| 7+ Person Families | 0 (0.0%) | $0 |
| Total | 268 (100.0%) | $15,263 |
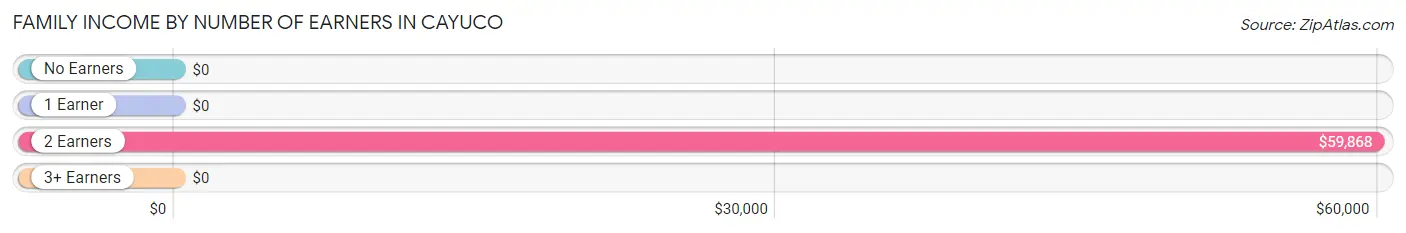
Family Income by Number of Earners in Cayuco
| Number of Earners | # Families | Median Income |
| No Earners | 148 (55.2%) | $0 |
| 1 Earner | 68 (25.4%) | $0 |
| 2 Earners | 52 (19.4%) | $59,868 |
| 3+ Earners | 0 (0.0%) | $0 |
| Total | 268 (100.0%) | $15,263 |
Household Income in Cayuco
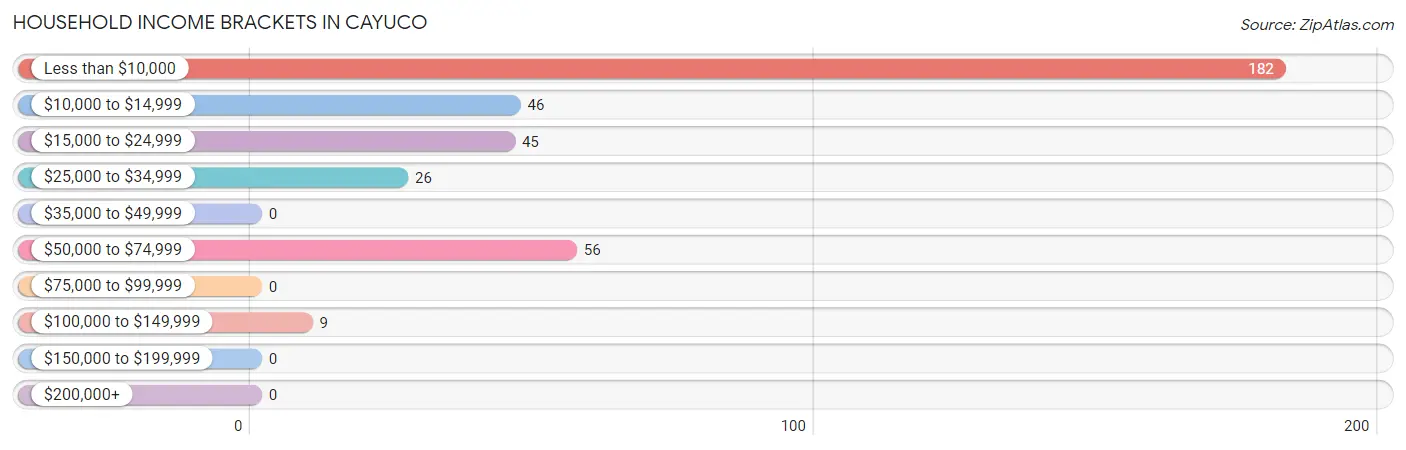
Household Income Brackets in Cayuco
With 182 households falling in the category, the less than $10,000 income range is the most frequent in Cayuco, accounting for 50.0% of all households.
| Income Bracket | # Households | % Households |
| Less than $10,000 | 182 | 50.0% |
| $10,000 to $14,999 | 46 | 12.6% |
| $15,000 to $24,999 | 45 | 12.4% |
| $25,000 to $34,999 | 26 | 7.1% |
| $35,000 to $49,999 | 0 | 0.0% |
| $50,000 to $74,999 | 56 | 15.4% |
| $75,000 to $99,999 | 0 | 0.0% |
| $100,000 to $149,999 | 9 | 2.5% |
| $150,000 to $199,999 | 0 | 0.0% |
| $200,000+ | 0 | 0.0% |
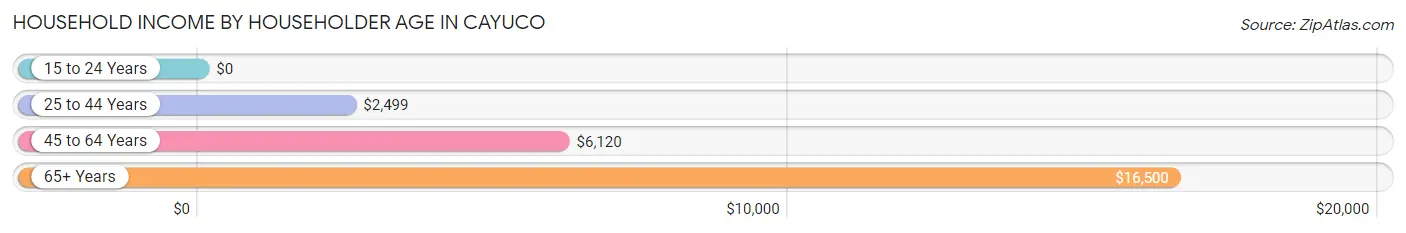
Household Income by Householder Age in Cayuco
The median household income in Cayuco is $0, with the highest median household income of $16,500 found in the 65+ years age bracket for the primary householder. A total of 130 households (35.7%) fall into this category.
| Income Bracket | # Households | Median Income |
| 15 to 24 Years | 0 (0.0%) | $0 |
| 25 to 44 Years | 89 (24.4%) | $2,499 |
| 45 to 64 Years | 145 (39.8%) | $6,120 |
| 65+ Years | 130 (35.7%) | $16,500 |
| Total | 364 (100.0%) | $0 |
Poverty in Cayuco
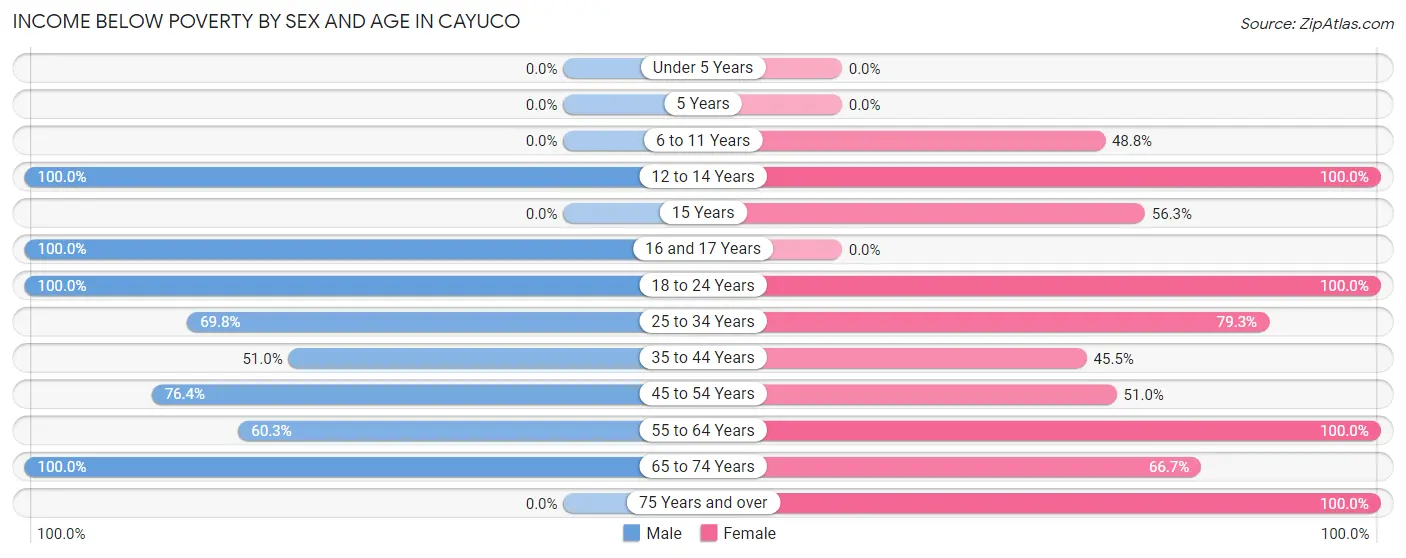
Income Below Poverty by Sex and Age in Cayuco
With 74.1% poverty level for males and 69.4% for females among the residents of Cayuco, 12 to 14 year old males and 12 to 14 year old females are the most vulnerable to poverty, with 109 males (100.0%) and 33 females (100.0%) in their respective age groups living below the poverty level.
| Age Bracket | Male | Female |
| Under 5 Years | 0 (0.0%) | 0 (0.0%) |
| 5 Years | 0 (0.0%) | 0 (0.0%) |
| 6 to 11 Years | 0 (0.0%) | 21 (48.8%) |
| 12 to 14 Years | 109 (100.0%) | 33 (100.0%) |
| 15 Years | 0 (0.0%) | 27 (56.2%) |
| 16 and 17 Years | 9 (100.0%) | 0 (0.0%) |
| 18 to 24 Years | 46 (100.0%) | 14 (100.0%) |
| 25 to 34 Years | 37 (69.8%) | 65 (79.3%) |
| 35 to 44 Years | 25 (51.0%) | 30 (45.5%) |
| 45 to 54 Years | 68 (76.4%) | 25 (51.0%) |
| 55 to 64 Years | 38 (60.3%) | 41 (100.0%) |
| 65 to 74 Years | 71 (100.0%) | 58 (66.7%) |
| 75 Years and over | 0 (0.0%) | 24 (100.0%) |
| Total | 403 (74.1%) | 338 (69.4%) |
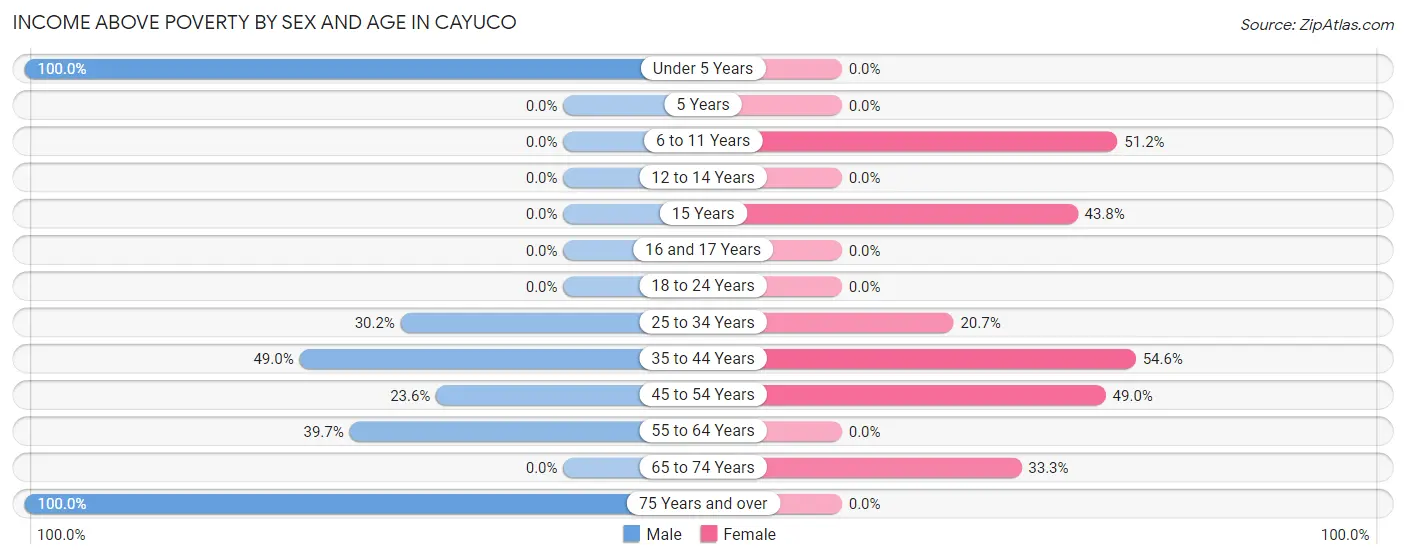
Income Above Poverty by Sex and Age in Cayuco
According to the poverty statistics in Cayuco, males aged under 5 years and females aged 35 to 44 years are the age groups that are most secure financially, with 100.0% of males and 54.5% of females in these age groups living above the poverty line.
| Age Bracket | Male | Female |
| Under 5 Years | 20 (100.0%) | 0 (0.0%) |
| 5 Years | 0 (0.0%) | 0 (0.0%) |
| 6 to 11 Years | 0 (0.0%) | 22 (51.2%) |
| 12 to 14 Years | 0 (0.0%) | 0 (0.0%) |
| 15 Years | 0 (0.0%) | 21 (43.8%) |
| 16 and 17 Years | 0 (0.0%) | 0 (0.0%) |
| 18 to 24 Years | 0 (0.0%) | 0 (0.0%) |
| 25 to 34 Years | 16 (30.2%) | 17 (20.7%) |
| 35 to 44 Years | 24 (49.0%) | 36 (54.5%) |
| 45 to 54 Years | 21 (23.6%) | 24 (49.0%) |
| 55 to 64 Years | 25 (39.7%) | 0 (0.0%) |
| 65 to 74 Years | 0 (0.0%) | 29 (33.3%) |
| 75 Years and over | 35 (100.0%) | 0 (0.0%) |
| Total | 141 (25.9%) | 149 (30.6%) |
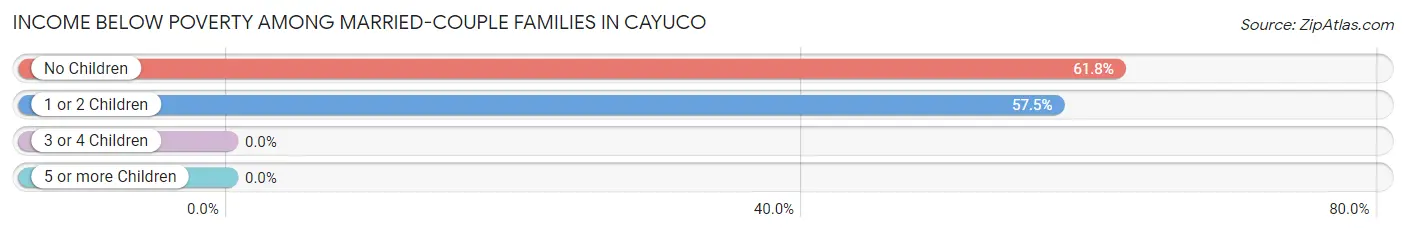
Income Below Poverty Among Married-Couple Families in Cayuco
The poverty statistics for married-couple families in Cayuco show that 59.4% or 120 of the total 202 families live below the poverty line. Families with no children have the highest poverty rate of 61.8%, comprising of 55 families. On the other hand, families with 1 or 2 children have the lowest poverty rate of 57.5%, which includes 65 families.
| Children | Above Poverty | Below Poverty |
| No Children | 34 (38.2%) | 55 (61.8%) |
| 1 or 2 Children | 48 (42.5%) | 65 (57.5%) |
| 3 or 4 Children | 0 (0.0%) | 0 (0.0%) |
| 5 or more Children | 0 (0.0%) | 0 (0.0%) |
| Total | 82 (40.6%) | 120 (59.4%) |
Income Below Poverty Among Single-Parent Households in Cayuco
According to the poverty data in Cayuco, 75.7% or 28 single-father households and 100.0% or 29 single-mother households are living below the poverty line. Among single-father households, those with no children have the highest poverty rate, with 28 households (75.7%) experiencing poverty. Likewise, among single-mother households, those with 1 or 2 children have the highest poverty rate, with 9 households (100.0%) falling below the poverty line.
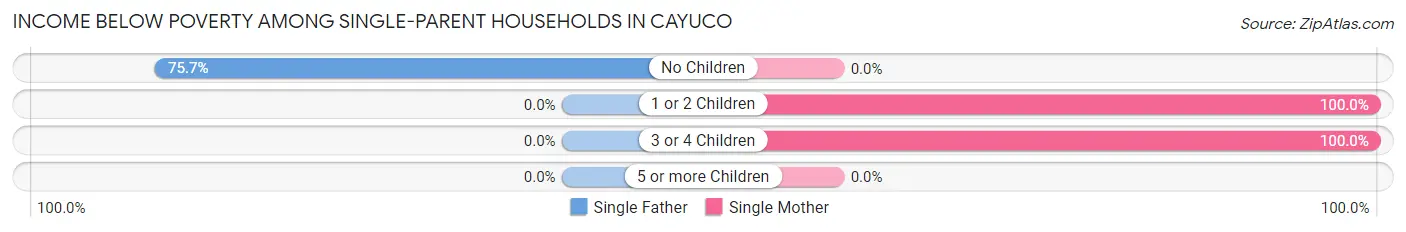
| Children | Single Father | Single Mother |
| No Children | 28 (75.7%) | 0 (0.0%) |
| 1 or 2 Children | 0 (0.0%) | 9 (100.0%) |
| 3 or 4 Children | 0 (0.0%) | 20 (100.0%) |
| 5 or more Children | 0 (0.0%) | 0 (0.0%) |
| Total | 28 (75.7%) | 29 (100.0%) |
Income Below Poverty Among Married-Couple vs Single-Parent Households in Cayuco
The poverty data for Cayuco shows that 120 of the married-couple family households (59.4%) and 57 of the single-parent households (86.4%) are living below the poverty level. Within the married-couple family households, those with no children have the highest poverty rate, with 55 households (61.8%) falling below the poverty line. Among the single-parent households, those with 1 or 2 children have the highest poverty rate, with 9 household (100.0%) living below poverty.
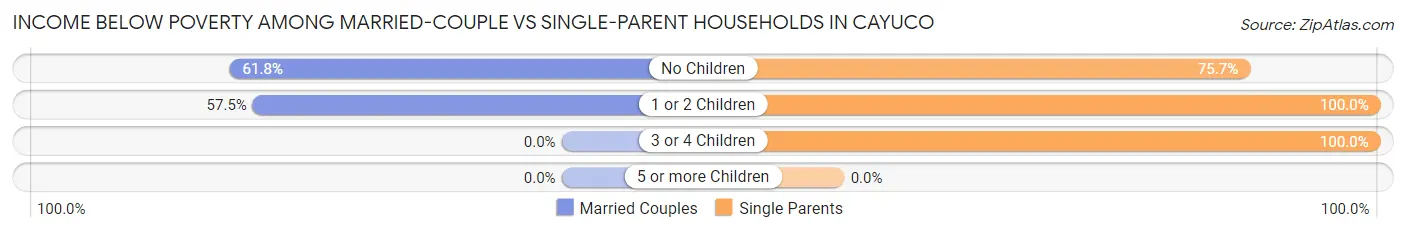
| Children | Married-Couple Families | Single-Parent Households |
| No Children | 55 (61.8%) | 28 (75.7%) |
| 1 or 2 Children | 65 (57.5%) | 9 (100.0%) |
| 3 or 4 Children | 0 (0.0%) | 20 (100.0%) |
| 5 or more Children | 0 (0.0%) | 0 (0.0%) |
| Total | 120 (59.4%) | 57 (86.4%) |
Race in Cayuco
The most populous races in Cayuco are Hispanic or Latino (985 | 95.5%), White / Caucasian (652 | 63.2%), and Some other Race (331 | 32.1%).
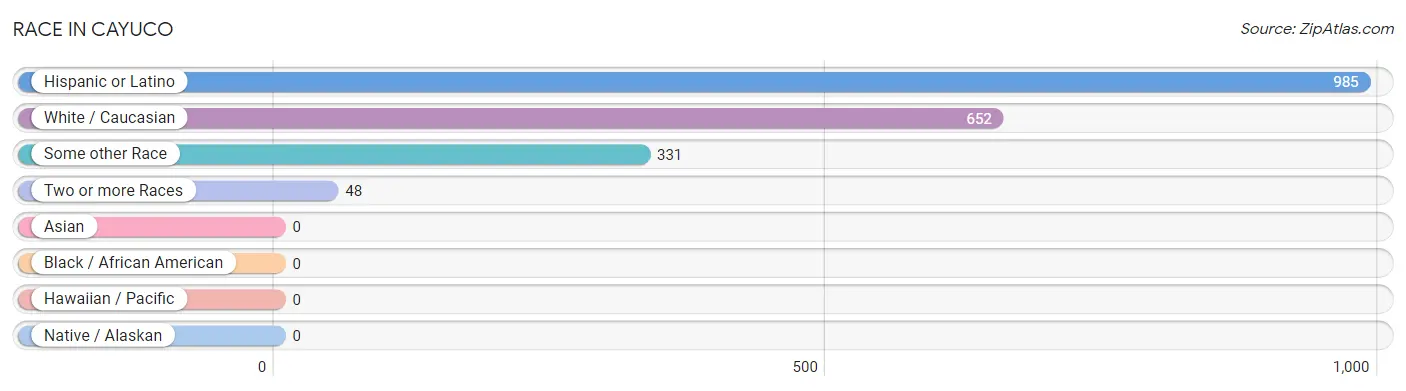
| Race | # Population | % Population |
| Asian | 0 | 0.0% |
| Black / African American | 0 | 0.0% |
| Hawaiian / Pacific | 0 | 0.0% |
| Hispanic or Latino | 985 | 95.5% |
| Native / Alaskan | 0 | 0.0% |
| White / Caucasian | 652 | 63.2% |
| Two or more Races | 48 | 4.7% |
| Some other Race | 331 | 32.1% |
| Total | 1,031 | 100.0% |
Ancestry in Cayuco
The most populous ancestries reported in Cayuco are Puerto Rican (985 | 95.5%), and American (54 | 5.2%), together accounting for 100.8% of all Cayuco residents.
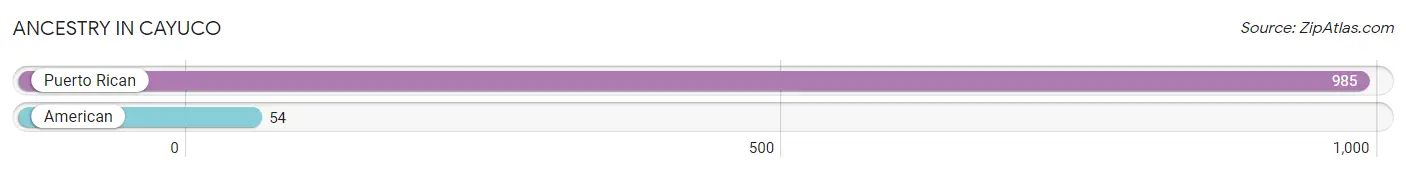
| Ancestry | # Population | % Population |
| American | 54 | 5.2% |
| Puerto Rican | 985 | 95.5% | View All 2 Rows |
Immigrants in Cayuco

| Immigration Origin | # Population | % Population | View All 0 Rows |
Sex and Age in Cayuco
Sex and Age in Cayuco
The most populous age groups in Cayuco are 10 to 14 Years (109 | 20.0%) for men and 30 to 34 Years (82 | 16.8%) for women.
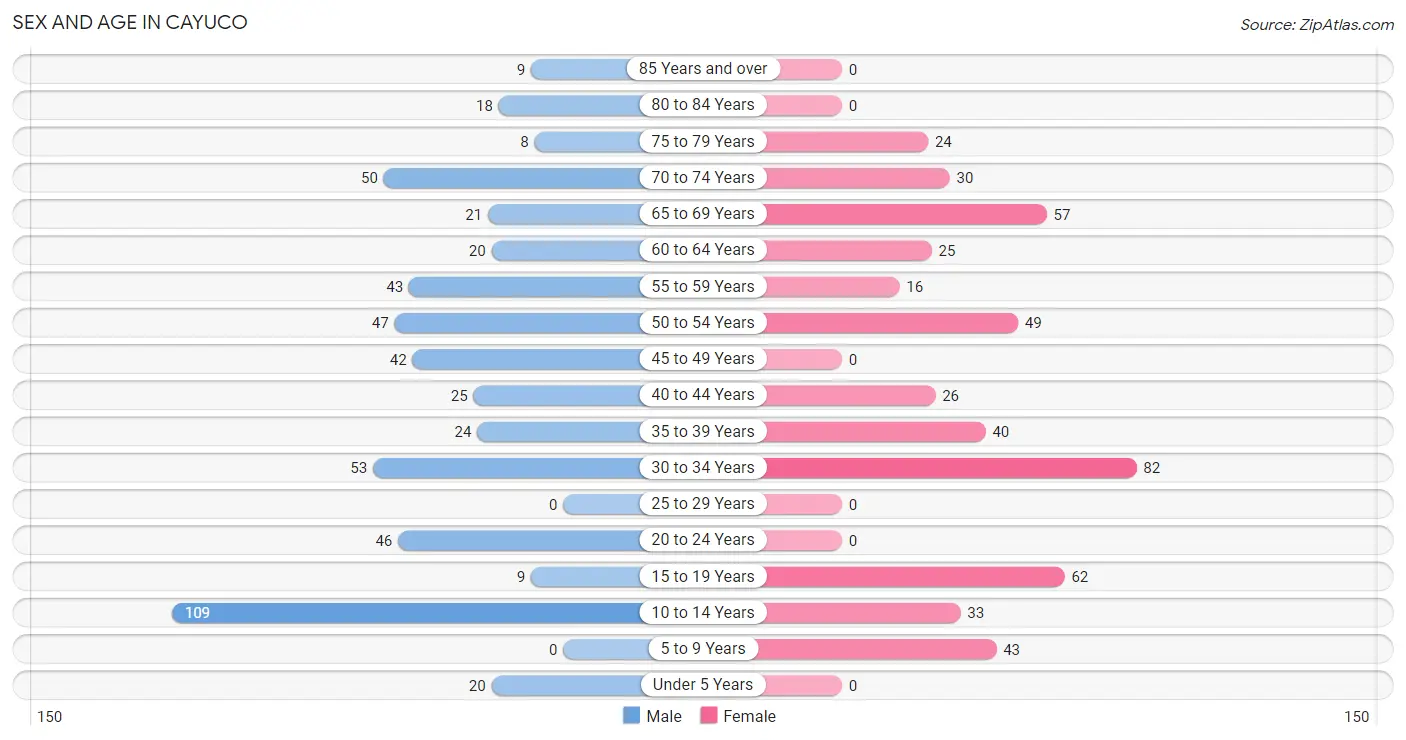
| Age Bracket | Male | Female |
| Under 5 Years | 20 (3.7%) | 0 (0.0%) |
| 5 to 9 Years | 0 (0.0%) | 43 (8.8%) |
| 10 to 14 Years | 109 (20.0%) | 33 (6.8%) |
| 15 to 19 Years | 9 (1.7%) | 62 (12.7%) |
| 20 to 24 Years | 46 (8.5%) | 0 (0.0%) |
| 25 to 29 Years | 0 (0.0%) | 0 (0.0%) |
| 30 to 34 Years | 53 (9.7%) | 82 (16.8%) |
| 35 to 39 Years | 24 (4.4%) | 40 (8.2%) |
| 40 to 44 Years | 25 (4.6%) | 26 (5.3%) |
| 45 to 49 Years | 42 (7.7%) | 0 (0.0%) |
| 50 to 54 Years | 47 (8.6%) | 49 (10.1%) |
| 55 to 59 Years | 43 (7.9%) | 16 (3.3%) |
| 60 to 64 Years | 20 (3.7%) | 25 (5.1%) |
| 65 to 69 Years | 21 (3.9%) | 57 (11.7%) |
| 70 to 74 Years | 50 (9.2%) | 30 (6.2%) |
| 75 to 79 Years | 8 (1.5%) | 24 (4.9%) |
| 80 to 84 Years | 18 (3.3%) | 0 (0.0%) |
| 85 Years and over | 9 (1.7%) | 0 (0.0%) |
| Total | 544 (100.0%) | 487 (100.0%) |
Families and Households in Cayuco
Median Family Size in Cayuco
The median family size in Cayuco is 3.41 persons per family, with single female/mother families (29 | 10.8%) accounting for the largest median family size of 4.34 persons per family. On the other hand, married-couple families (202 | 75.4%) represent the smallest median family size with 3.25 persons per family.
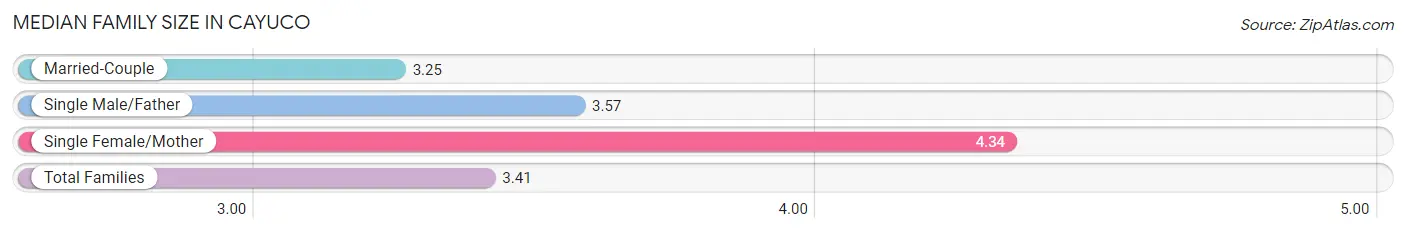
| Family Type | # Families | Family Size |
| Married-Couple | 202 (75.4%) | 3.25 |
| Single Male/Father | 37 (13.8%) | 3.57 |
| Single Female/Mother | 29 (10.8%) | 4.34 |
| Total Families | 268 (100.0%) | 3.41 |
Median Household Size in Cayuco
The median household size in Cayuco is 2.83 persons per household, with single female/mother households (29 | 8.0%) accounting for the largest median household size of 4.34 persons per household. non-family households (96 | 26.4%) represent the smallest median household size with 1.22 persons per household.
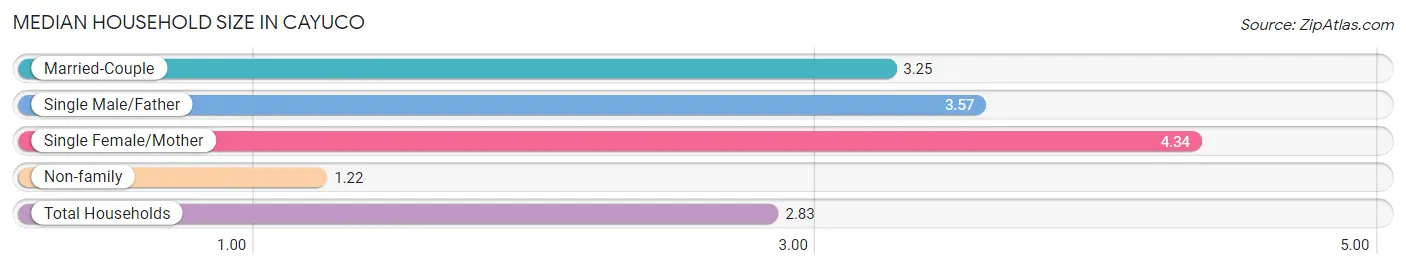
| Household Type | # Households | Household Size |
| Married-Couple | 202 (55.5%) | 3.25 |
| Single Male/Father | 37 (10.2%) | 3.57 |
| Single Female/Mother | 29 (8.0%) | 4.34 |
| Non-family | 96 (26.4%) | 1.22 |
| Total Households | 364 (100.0%) | 2.83 |
Household Size by Marriage Status in Cayuco
Out of a total of 364 households in Cayuco, 268 (73.6%) are family households, while 96 (26.4%) are nonfamily households. The most numerous type of family households are 3-person households, comprising 125, and the most common type of nonfamily households are 1-person households, comprising 75.
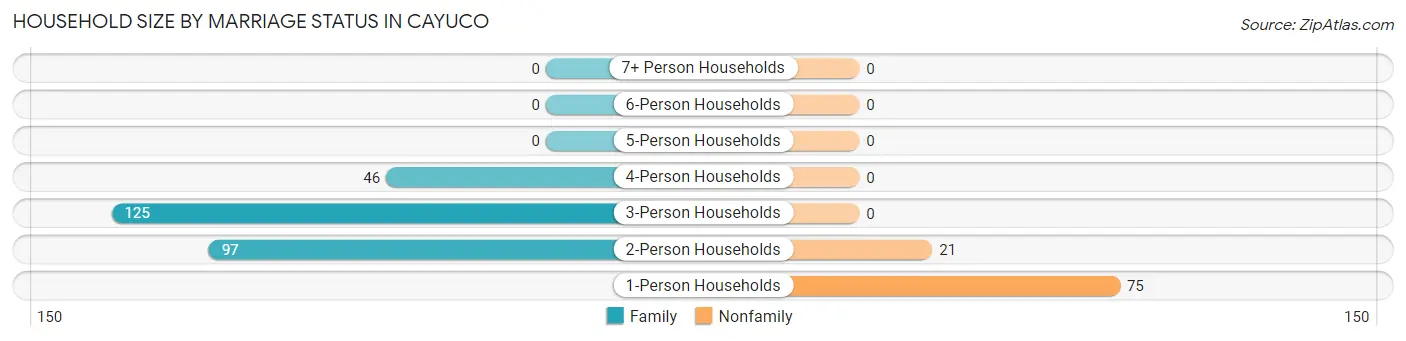
| Household Size | Family Households | Nonfamily Households |
| 1-Person Households | - | 75 (20.6%) |
| 2-Person Households | 97 (26.7%) | 21 (5.8%) |
| 3-Person Households | 125 (34.3%) | 0 (0.0%) |
| 4-Person Households | 46 (12.6%) | 0 (0.0%) |
| 5-Person Households | 0 (0.0%) | 0 (0.0%) |
| 6-Person Households | 0 (0.0%) | 0 (0.0%) |
| 7+ Person Households | 0 (0.0%) | 0 (0.0%) |
| Total | 268 (73.6%) | 96 (26.4%) |
Female Fertility in Cayuco
Fertility by Age in Cayuco
| Age Bracket | Women with Births | Births / 1,000 Women |
| 15 to 19 years | 0 (0.0%) | 0.0 |
| 20 to 34 years | 0 (0.0%) | 0.0 |
| 35 to 50 years | 0 (0.0%) | 0.0 |
| Total | 0 (0.0%) | 0.0 |
Fertility by Age by Marriage Status in Cayuco
| Age Bracket | Married | Unmarried |
| 15 to 19 years | 0 (0.0%) | 0 (0.0%) |
| 20 to 34 years | 0 (0.0%) | 0 (0.0%) |
| 35 to 50 years | 0 (0.0%) | 0 (0.0%) |
| Total | 0 (0.0%) | 0 (0.0%) |
Fertility by Education in Cayuco
| Educational Attainment | Women with Births | Births / 1,000 Women |
| Less than High School | 0 (0.0%) | 0.0 |
| High School Diploma | 0 (0.0%) | 0.0 |
| College or Associate's Degree | 0 (0.0%) | 0.0 |
| Bachelor's Degree | 0 (0.0%) | 0.0 |
| Graduate Degree | 0 (0.0%) | 0.0 |
| Total | 0 (0.0%) | 0.0 |
Fertility by Education by Marriage Status in Cayuco
| Educational Attainment | Married | Unmarried |
| Less than High School | 0 (0.0%) | 0 (0.0%) |
| High School Diploma | 0 (0.0%) | 0 (0.0%) |
| College or Associate's Degree | 0 (0.0%) | 0 (0.0%) |
| Bachelor's Degree | 0 (0.0%) | 0 (0.0%) |
| Graduate Degree | 0 (0.0%) | 0 (0.0%) |
| Total | 0 (0.0%) | 0 (0.0%) |
Employment Characteristics in Cayuco
Employment by Class of Employer in Cayuco
Among the 167 employed individuals in Cayuco, private company employees (106 | 63.5%), federal government employees (36 | 21.6%), and local government employees (25 | 15.0%) make up the most common classes of employment.
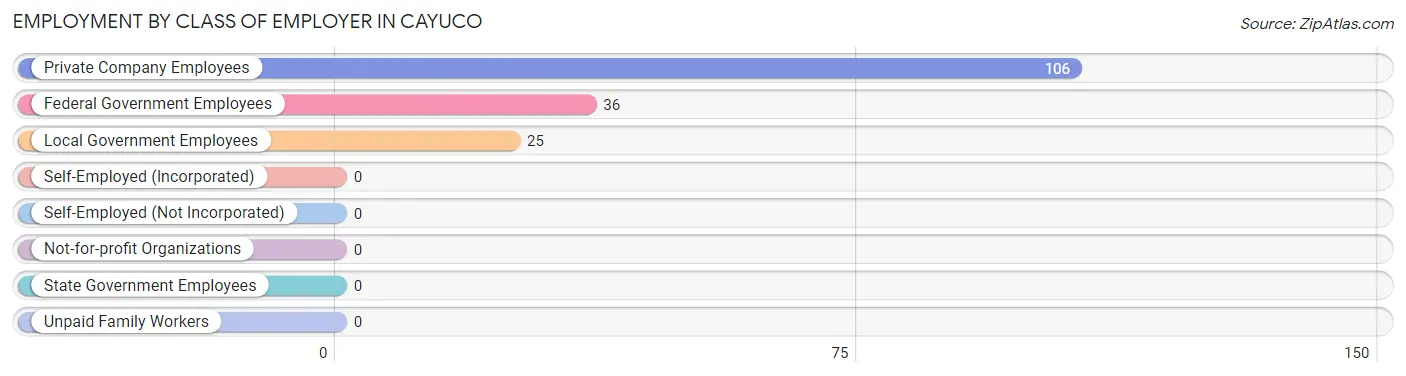
| Employer Class | # Employees | % Employees |
| Private Company Employees | 106 | 63.5% |
| Self-Employed (Incorporated) | 0 | 0.0% |
| Self-Employed (Not Incorporated) | 0 | 0.0% |
| Not-for-profit Organizations | 0 | 0.0% |
| Local Government Employees | 25 | 15.0% |
| State Government Employees | 0 | 0.0% |
| Federal Government Employees | 36 | 21.6% |
| Unpaid Family Workers | 0 | 0.0% |
| Total | 167 | 100.0% |
Employment Status by Age in Cayuco
According to the labor force statistics for Cayuco, out of the total population over 16 years of age (778), 37.8% or 294 individuals are in the labor force, with 43.2% or 127 of them unemployed. The age group with the highest labor force participation rate is 30 to 34 years, with 85.2% or 115 individuals in the labor force. Within the labor force, the 45 to 54 years age range has the highest percentage of unemployed individuals, with 100.0% or 45 of them being unemployed.
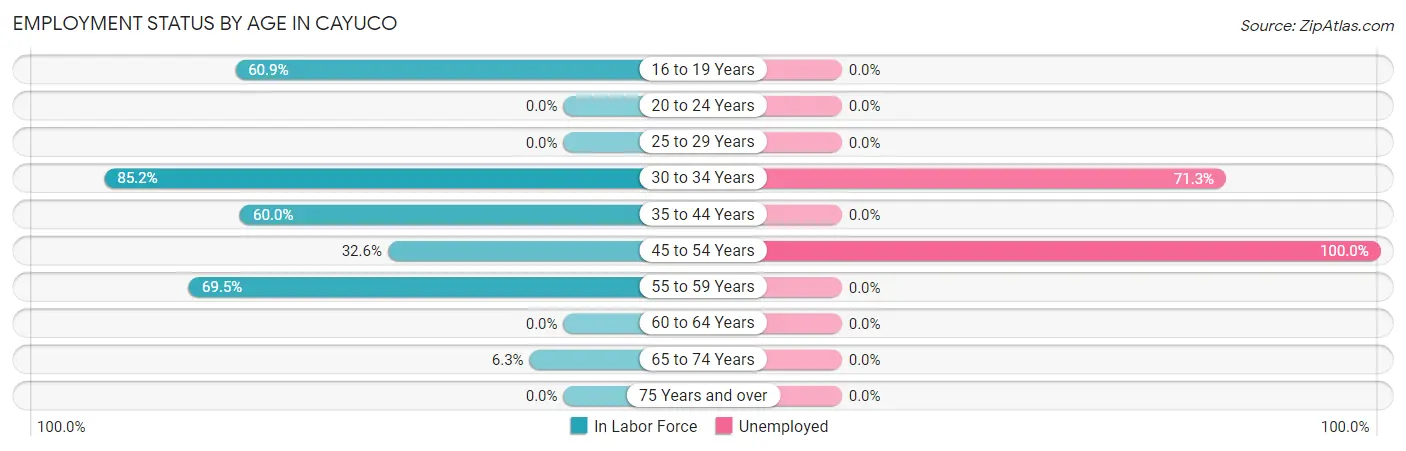
| Age Bracket | In Labor Force | Unemployed |
| 16 to 19 Years | 14 (60.9%) | 0 (0.0%) |
| 20 to 24 Years | 0 (0.0%) | 0 (0.0%) |
| 25 to 29 Years | 0 (0.0%) | 0 (0.0%) |
| 30 to 34 Years | 115 (85.2%) | 82 (71.3%) |
| 35 to 44 Years | 69 (60.0%) | 0 (0.0%) |
| 45 to 54 Years | 45 (32.6%) | 45 (100.0%) |
| 55 to 59 Years | 41 (69.5%) | 0 (0.0%) |
| 60 to 64 Years | 0 (0.0%) | 0 (0.0%) |
| 65 to 74 Years | 10 (6.3%) | 0 (0.0%) |
| 75 Years and over | 0 (0.0%) | 0 (0.0%) |
| Total | 294 (37.8%) | 127 (43.2%) |
Employment Status by Educational Attainment in Cayuco
According to labor force statistics for Cayuco, 54.9% of individuals (270) out of the total population between 25 and 64 years of age (492) are in the labor force, with 47.0% or 127 of them being unemployed. The group with the highest labor force participation rate are those with the educational attainment of bachelor's degree or higher, with 100.0% or 107 individuals in the labor force. Within the labor force, individuals with high school diploma education have the highest percentage of unemployment, with 100.0% or 61 of them being unemployed.
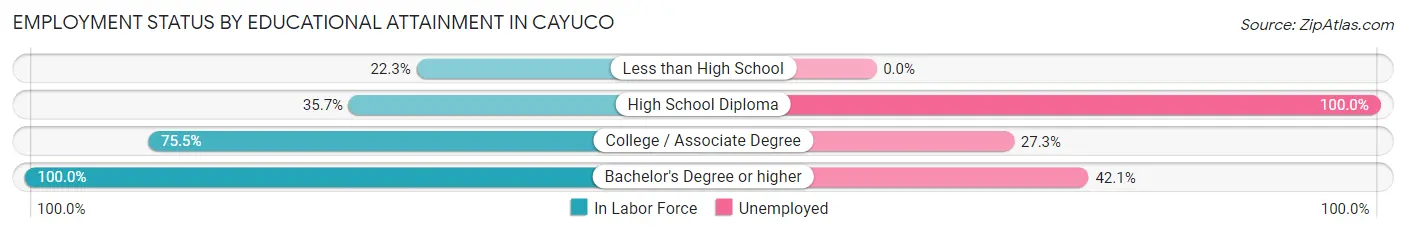
| Educational Attainment | In Labor Force | Unemployed |
| Less than High School | 25 (22.3%) | 0 (0.0%) |
| High School Diploma | 61 (35.7%) | 171 (100.0%) |
| College / Associate Degree | 77 (75.5%) | 28 (27.3%) |
| Bachelor's Degree or higher | 107 (100.0%) | 45 (42.1%) |
| Total | 270 (54.9%) | 231 (47.0%) |
Employment Occupations by Sex in Cayuco
Management, Business, Science and Arts Occupations
The most common Management, Business, Science and Arts occupations in Cayuco are Community & Social Service (36 | 21.6%), Education, Arts & Media (19 | 11.4%), Business & Financial (17 | 10.2%), and Legal Services & Support (17 | 10.2%).
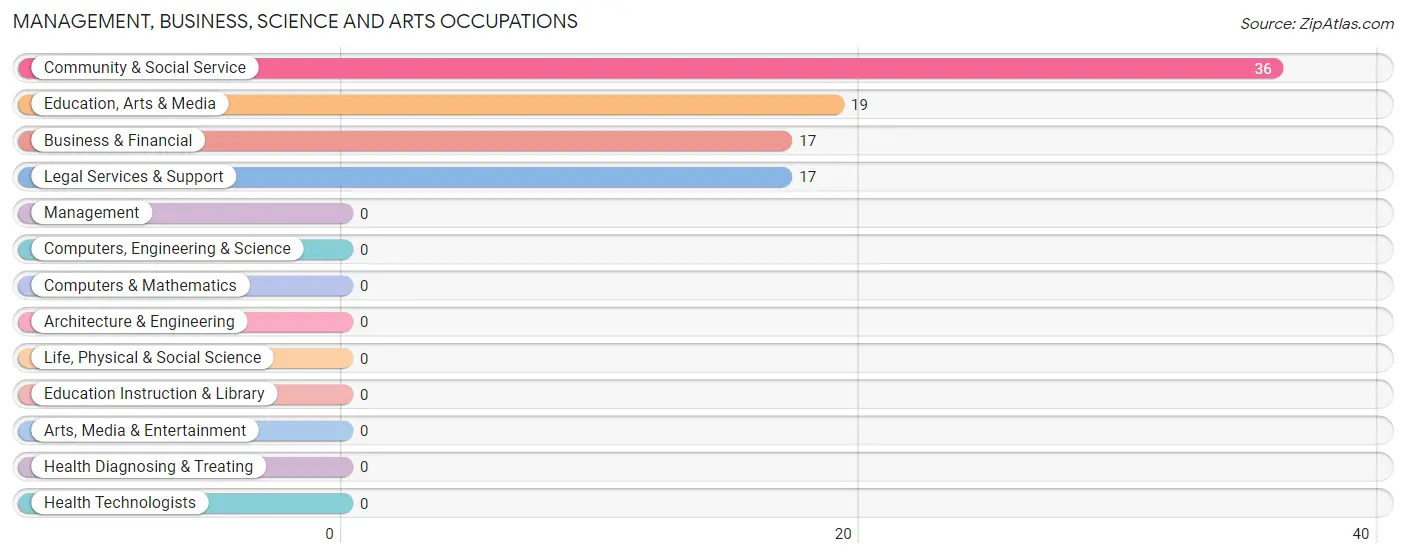
Management, Business, Science and Arts Occupations by Sex
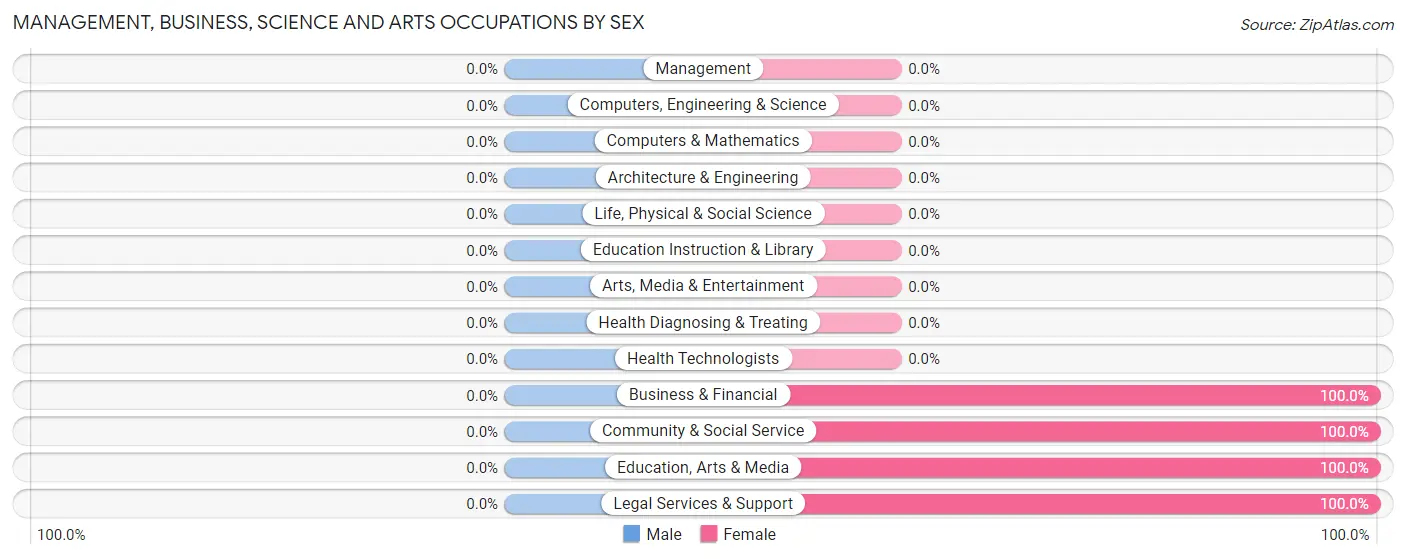
| Occupation | Male | Female |
| Management | 0 (0.0%) | 0 (0.0%) |
| Business & Financial | 0 (0.0%) | 17 (100.0%) |
| Computers, Engineering & Science | 0 (0.0%) | 0 (0.0%) |
| Computers & Mathematics | 0 (0.0%) | 0 (0.0%) |
| Architecture & Engineering | 0 (0.0%) | 0 (0.0%) |
| Life, Physical & Social Science | 0 (0.0%) | 0 (0.0%) |
| Community & Social Service | 0 (0.0%) | 36 (100.0%) |
| Education, Arts & Media | 0 (0.0%) | 19 (100.0%) |
| Legal Services & Support | 0 (0.0%) | 17 (100.0%) |
| Education Instruction & Library | 0 (0.0%) | 0 (0.0%) |
| Arts, Media & Entertainment | 0 (0.0%) | 0 (0.0%) |
| Health Diagnosing & Treating | 0 (0.0%) | 0 (0.0%) |
| Health Technologists | 0 (0.0%) | 0 (0.0%) |
| Total (Category) | 0 (0.0%) | 53 (100.0%) |
| Total (Overall) | 65 (38.9%) | 102 (61.1%) |
Services Occupations
The most common Services occupations in Cayuco are Food Preparation & Serving (30 | 18.0%), Security & Protection (25 | 15.0%), and Firefighting & Prevention (25 | 15.0%).
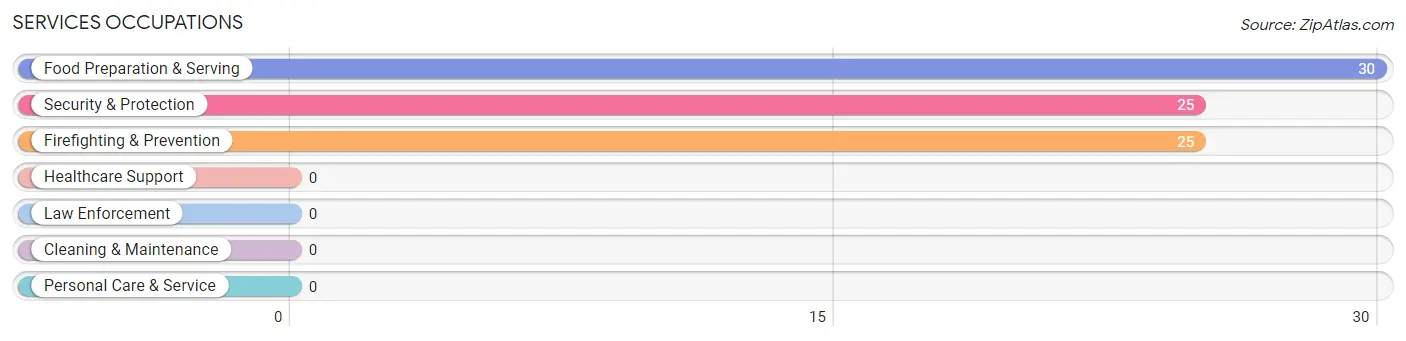
Services Occupations by Sex
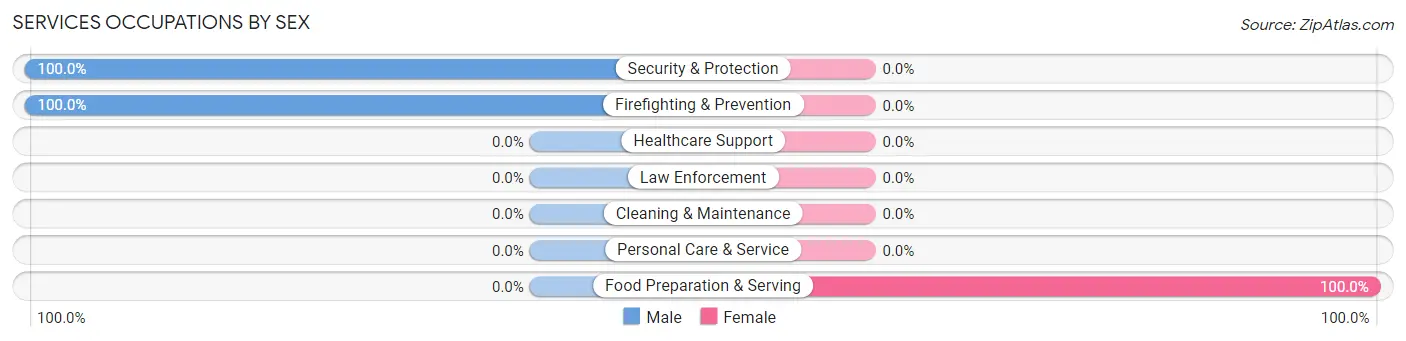
| Occupation | Male | Female |
| Healthcare Support | 0 (0.0%) | 0 (0.0%) |
| Security & Protection | 25 (100.0%) | 0 (0.0%) |
| Firefighting & Prevention | 25 (100.0%) | 0 (0.0%) |
| Law Enforcement | 0 (0.0%) | 0 (0.0%) |
| Food Preparation & Serving | 0 (0.0%) | 30 (100.0%) |
| Cleaning & Maintenance | 0 (0.0%) | 0 (0.0%) |
| Personal Care & Service | 0 (0.0%) | 0 (0.0%) |
| Total (Category) | 25 (45.5%) | 30 (54.5%) |
| Total (Overall) | 65 (38.9%) | 102 (61.1%) |
Sales and Office Occupations
The most common Sales and Office occupations in Cayuco are , and Office & Administration (25 | 15.0%).

Sales and Office Occupations by Sex
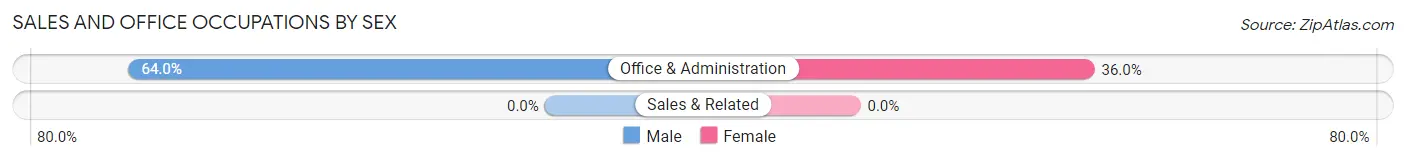
| Occupation | Male | Female |
| Sales & Related | 0 (0.0%) | 0 (0.0%) |
| Office & Administration | 16 (64.0%) | 9 (36.0%) |
| Total (Category) | 16 (64.0%) | 9 (36.0%) |
| Total (Overall) | 65 (38.9%) | 102 (61.1%) |
Natural Resources, Construction and Maintenance Occupations
The most common Natural Resources, Construction and Maintenance occupations in Cayuco are , and Installation, Maintenance & Repair (24 | 14.4%).
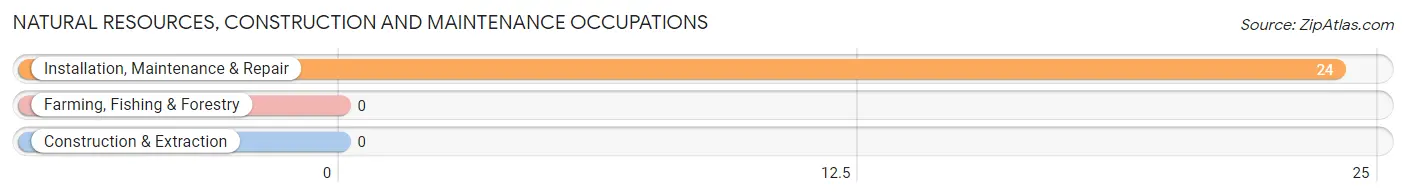
Natural Resources, Construction and Maintenance Occupations by Sex
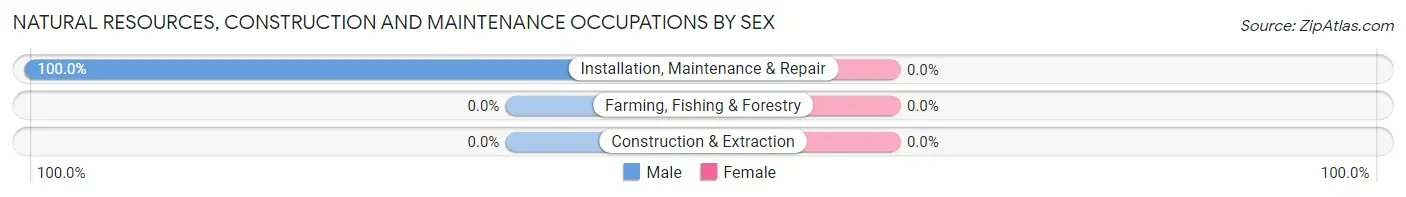
| Occupation | Male | Female |
| Farming, Fishing & Forestry | 0 (0.0%) | 0 (0.0%) |
| Construction & Extraction | 0 (0.0%) | 0 (0.0%) |
| Installation, Maintenance & Repair | 24 (100.0%) | 0 (0.0%) |
| Total (Category) | 24 (100.0%) | 0 (0.0%) |
| Total (Overall) | 65 (38.9%) | 102 (61.1%) |
Production, Transportation and Moving Occupations
The most common Production, Transportation and Moving occupations in Cayuco are , and Production (10 | 6.0%).
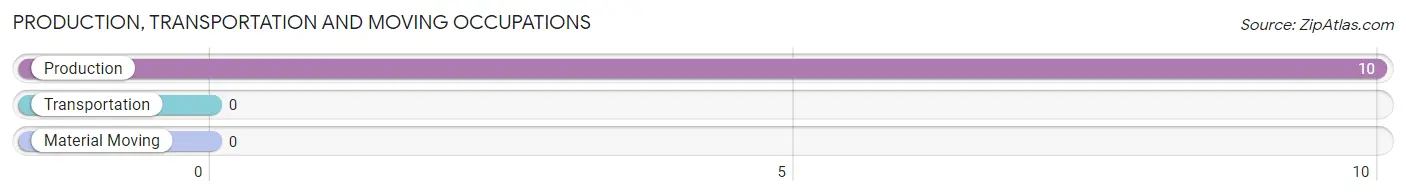
Production, Transportation and Moving Occupations by Sex
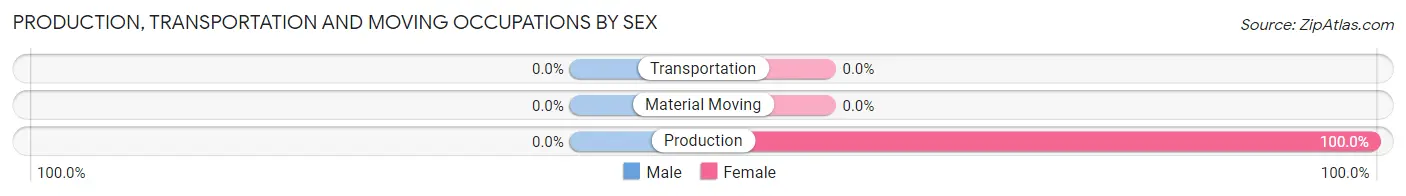
| Occupation | Male | Female |
| Production | 0 (0.0%) | 10 (100.0%) |
| Transportation | 0 (0.0%) | 0 (0.0%) |
| Material Moving | 0 (0.0%) | 0 (0.0%) |
| Total (Category) | 0 (0.0%) | 10 (100.0%) |
| Total (Overall) | 65 (38.9%) | 102 (61.1%) |
Employment Industries by Sex in Cayuco
Employment Industries in Cayuco
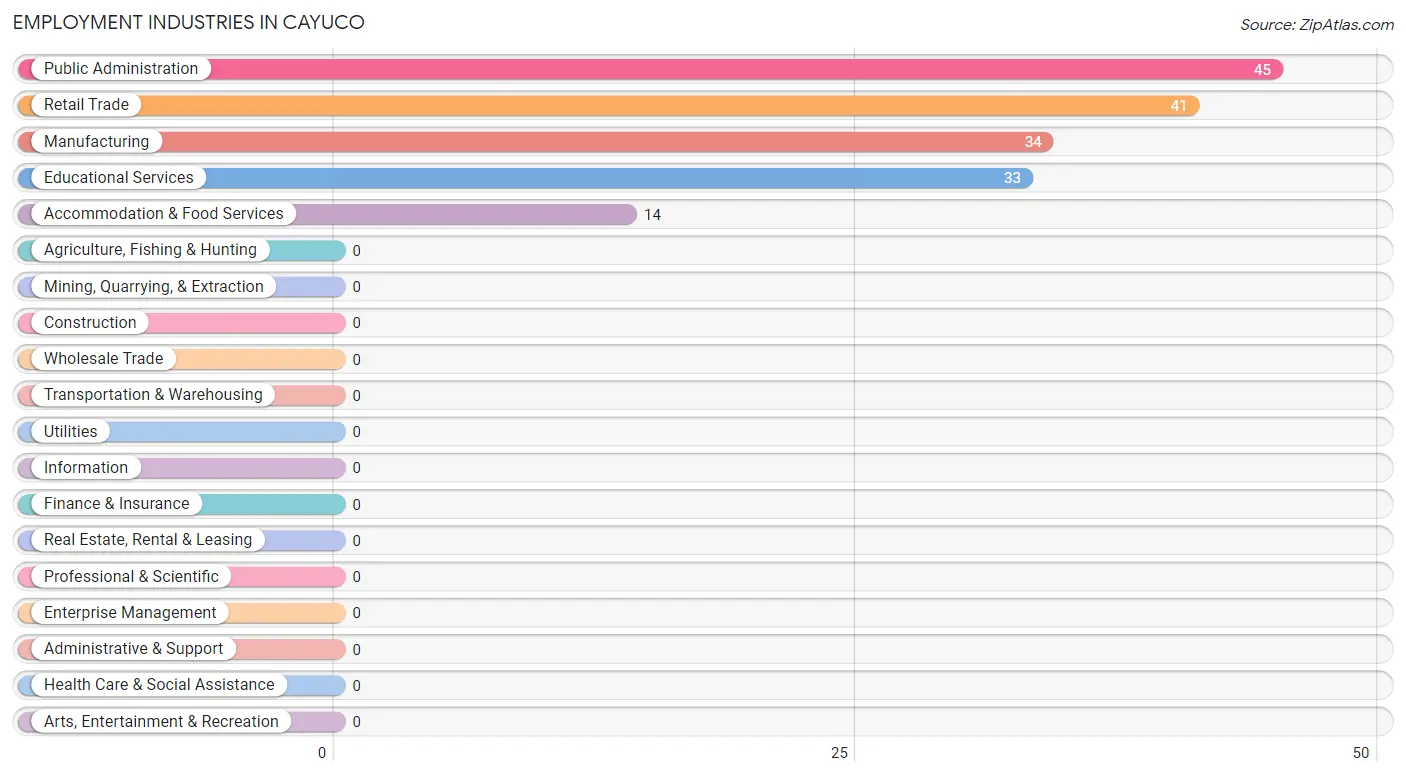
The major employment industries in Cayuco include Public Administration (45 | 27.0%), Retail Trade (41 | 24.5%), Manufacturing (34 | 20.4%), Educational Services (33 | 19.8%), and Accommodation & Food Services (14 | 8.4%).
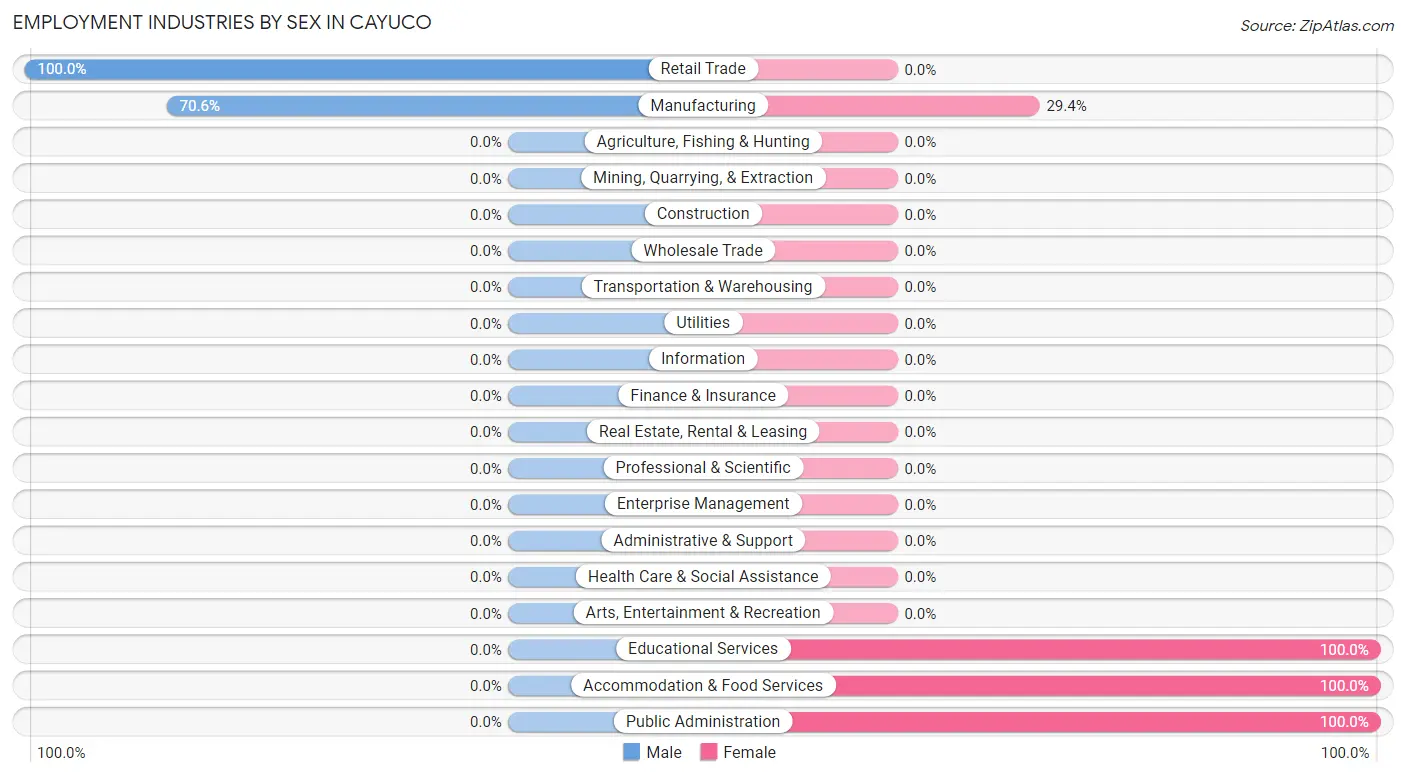
Employment Industries by Sex in Cayuco
The Cayuco industries that see more men than women are Retail Trade (100.0%), and Manufacturing (70.6%), whereas the industries that tend to have a higher number of women are Educational Services (100.0%), Accommodation & Food Services (100.0%), and Public Administration (100.0%).
| Industry | Male | Female |
| Agriculture, Fishing & Hunting | 0 (0.0%) | 0 (0.0%) |
| Mining, Quarrying, & Extraction | 0 (0.0%) | 0 (0.0%) |
| Construction | 0 (0.0%) | 0 (0.0%) |
| Manufacturing | 24 (70.6%) | 10 (29.4%) |
| Wholesale Trade | 0 (0.0%) | 0 (0.0%) |
| Retail Trade | 41 (100.0%) | 0 (0.0%) |
| Transportation & Warehousing | 0 (0.0%) | 0 (0.0%) |
| Utilities | 0 (0.0%) | 0 (0.0%) |
| Information | 0 (0.0%) | 0 (0.0%) |
| Finance & Insurance | 0 (0.0%) | 0 (0.0%) |
| Real Estate, Rental & Leasing | 0 (0.0%) | 0 (0.0%) |
| Professional & Scientific | 0 (0.0%) | 0 (0.0%) |
| Enterprise Management | 0 (0.0%) | 0 (0.0%) |
| Administrative & Support | 0 (0.0%) | 0 (0.0%) |
| Educational Services | 0 (0.0%) | 33 (100.0%) |
| Health Care & Social Assistance | 0 (0.0%) | 0 (0.0%) |
| Arts, Entertainment & Recreation | 0 (0.0%) | 0 (0.0%) |
| Accommodation & Food Services | 0 (0.0%) | 14 (100.0%) |
| Public Administration | 0 (0.0%) | 45 (100.0%) |
| Total | 65 (38.9%) | 102 (61.1%) |
Education in Cayuco
School Enrollment in Cayuco
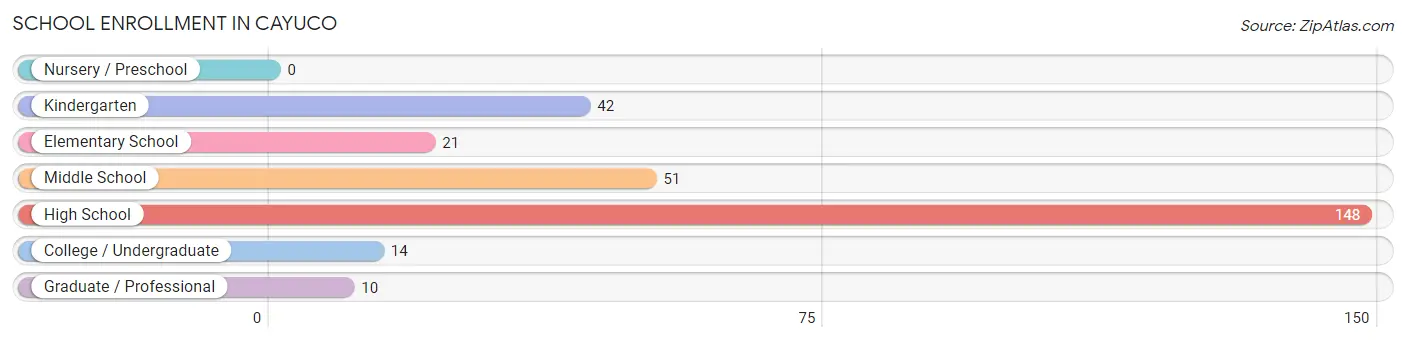
The most common levels of schooling among the 286 students in Cayuco are high school (148 | 51.7%), middle school (51 | 17.8%), and kindergarten (42 | 14.7%).
| School Level | # Students | % Students |
| Nursery / Preschool | 0 | 0.0% |
| Kindergarten | 42 | 14.7% |
| Elementary School | 21 | 7.3% |
| Middle School | 51 | 17.8% |
| High School | 148 | 51.7% |
| College / Undergraduate | 14 | 4.9% |
| Graduate / Professional | 10 | 3.5% |
| Total | 286 | 100.0% |
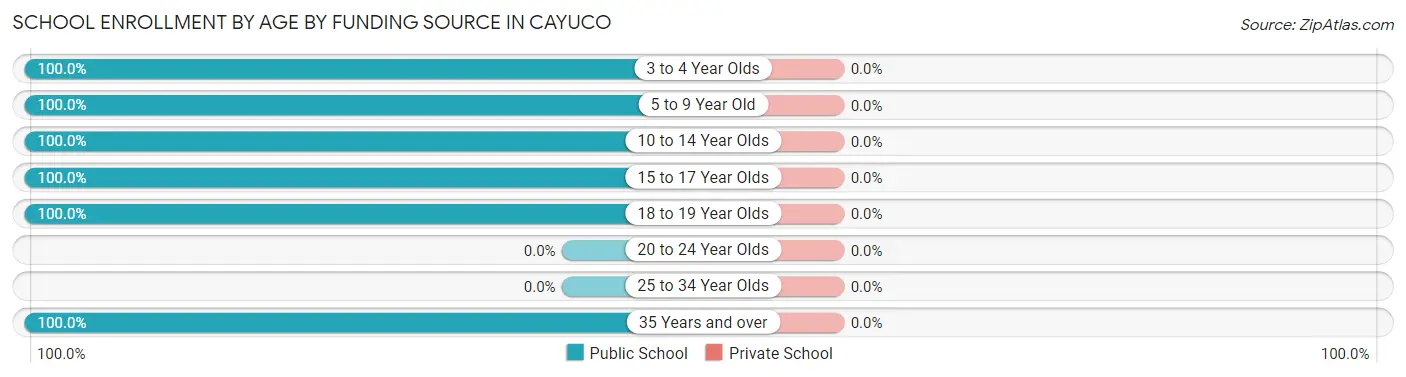
School Enrollment by Age by Funding Source in Cayuco
| Age Bracket | Public School | Private School |
| 3 to 4 Year Olds | 20 (100.0%) | 0 (0.0%) |
| 5 to 9 Year Old | 43 (100.0%) | 0 (0.0%) |
| 10 to 14 Year Olds | 142 (100.0%) | 0 (0.0%) |
| 15 to 17 Year Olds | 57 (100.0%) | 0 (0.0%) |
| 18 to 19 Year Olds | 14 (100.0%) | 0 (0.0%) |
| 20 to 24 Year Olds | 0 (0.0%) | 0 (0.0%) |
| 25 to 34 Year Olds | 0 (0.0%) | 0 (0.0%) |
| 35 Years and over | 10 (100.0%) | 0 (0.0%) |
| Total | 286 (100.0%) | 0 (0.0%) |
Educational Attainment by Field of Study in Cayuco
Education (76 | 51.3%), arts & humanities (36 | 24.3%), business (17 | 11.5%), social sciences (10 | 6.8%), and bio, nature & agricultural (9 | 6.1%) are the most common fields of study among 148 individuals in Cayuco who have obtained a bachelor's degree or higher.
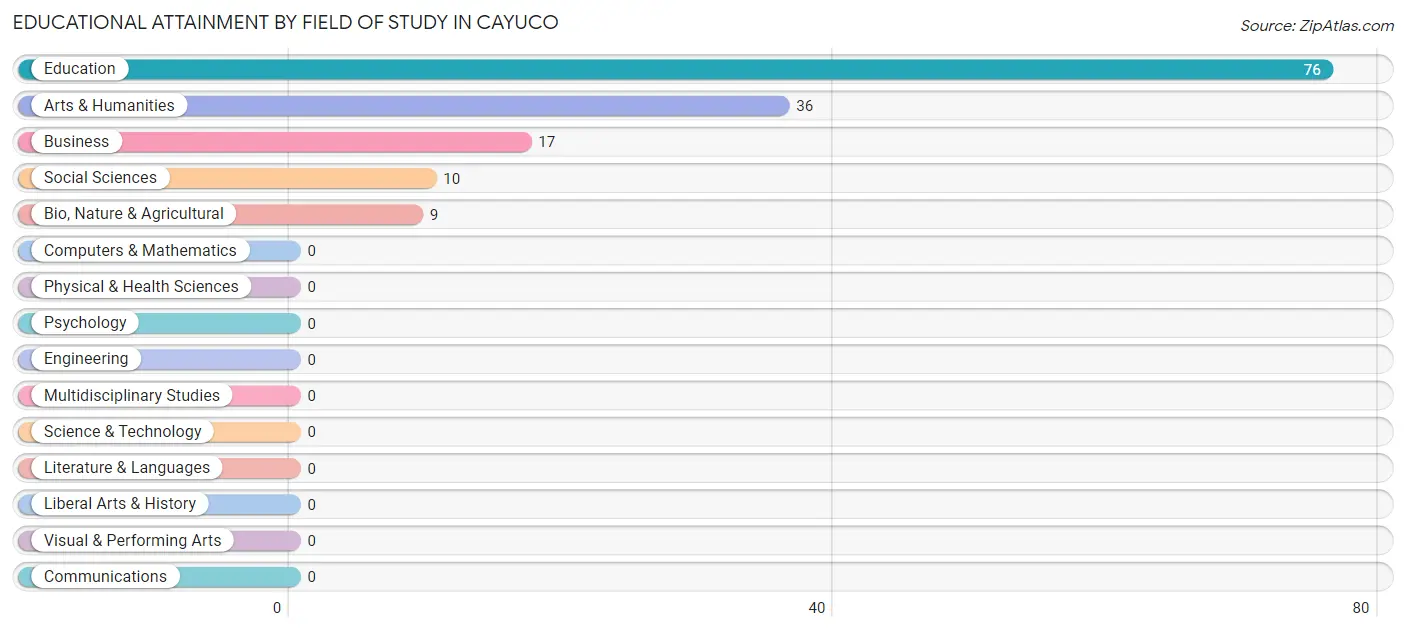
| Field of Study | # Graduates | % Graduates |
| Computers & Mathematics | 0 | 0.0% |
| Bio, Nature & Agricultural | 9 | 6.1% |
| Physical & Health Sciences | 0 | 0.0% |
| Psychology | 0 | 0.0% |
| Social Sciences | 10 | 6.8% |
| Engineering | 0 | 0.0% |
| Multidisciplinary Studies | 0 | 0.0% |
| Science & Technology | 0 | 0.0% |
| Business | 17 | 11.5% |
| Education | 76 | 51.3% |
| Literature & Languages | 0 | 0.0% |
| Liberal Arts & History | 0 | 0.0% |
| Visual & Performing Arts | 0 | 0.0% |
| Communications | 0 | 0.0% |
| Arts & Humanities | 36 | 24.3% |
| Total | 148 | 100.0% |
Transportation & Commute in Cayuco
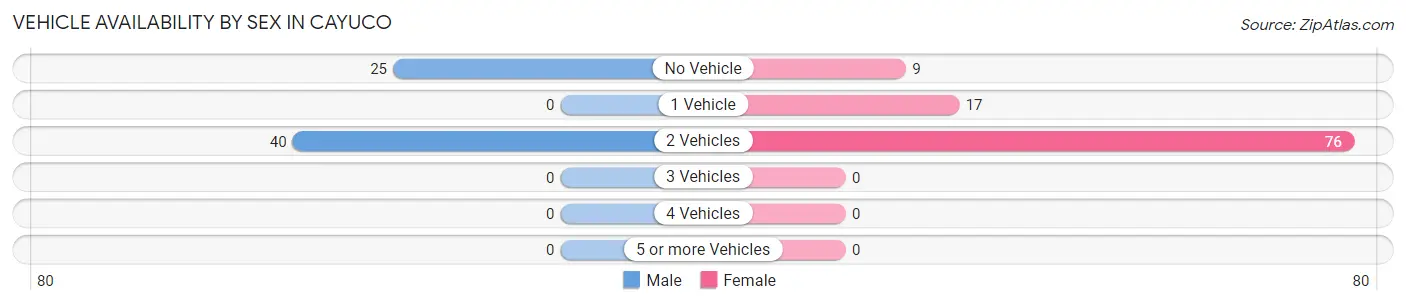
Vehicle Availability by Sex in Cayuco
The most prevalent vehicle ownership categories in Cayuco are males with 2 vehicles (40, accounting for 61.5%) and females with 2 vehicles (76, making up 39.2%).
| Vehicles Available | Male | Female |
| No Vehicle | 25 (38.5%) | 9 (8.8%) |
| 1 Vehicle | 0 (0.0%) | 17 (16.7%) |
| 2 Vehicles | 40 (61.5%) | 76 (74.5%) |
| 3 Vehicles | 0 (0.0%) | 0 (0.0%) |
| 4 Vehicles | 0 (0.0%) | 0 (0.0%) |
| 5 or more Vehicles | 0 (0.0%) | 0 (0.0%) |
| Total | 65 (100.0%) | 102 (100.0%) |
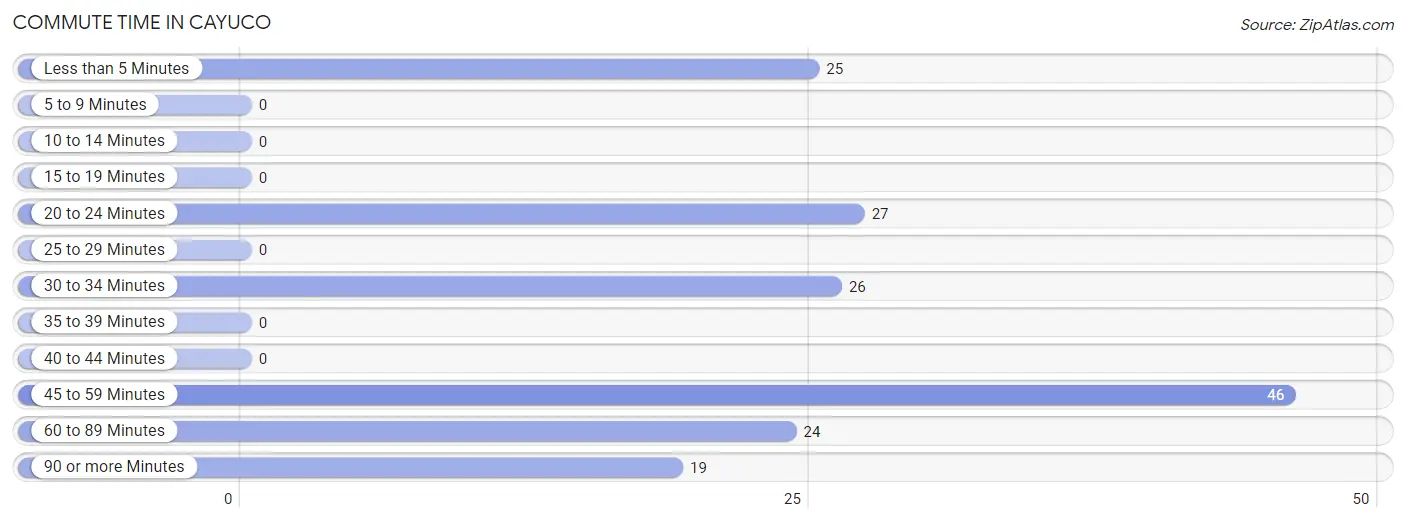
Commute Time in Cayuco
The most frequently occuring commute durations in Cayuco are 45 to 59 minutes (46 commuters, 27.5%), 20 to 24 minutes (27 commuters, 16.2%), and 30 to 34 minutes (26 commuters, 15.6%).
| Commute Time | # Commuters | % Commuters |
| Less than 5 Minutes | 25 | 15.0% |
| 5 to 9 Minutes | 0 | 0.0% |
| 10 to 14 Minutes | 0 | 0.0% |
| 15 to 19 Minutes | 0 | 0.0% |
| 20 to 24 Minutes | 27 | 16.2% |
| 25 to 29 Minutes | 0 | 0.0% |
| 30 to 34 Minutes | 26 | 15.6% |
| 35 to 39 Minutes | 0 | 0.0% |
| 40 to 44 Minutes | 0 | 0.0% |
| 45 to 59 Minutes | 46 | 27.5% |
| 60 to 89 Minutes | 24 | 14.4% |
| 90 or more Minutes | 19 | 11.4% |
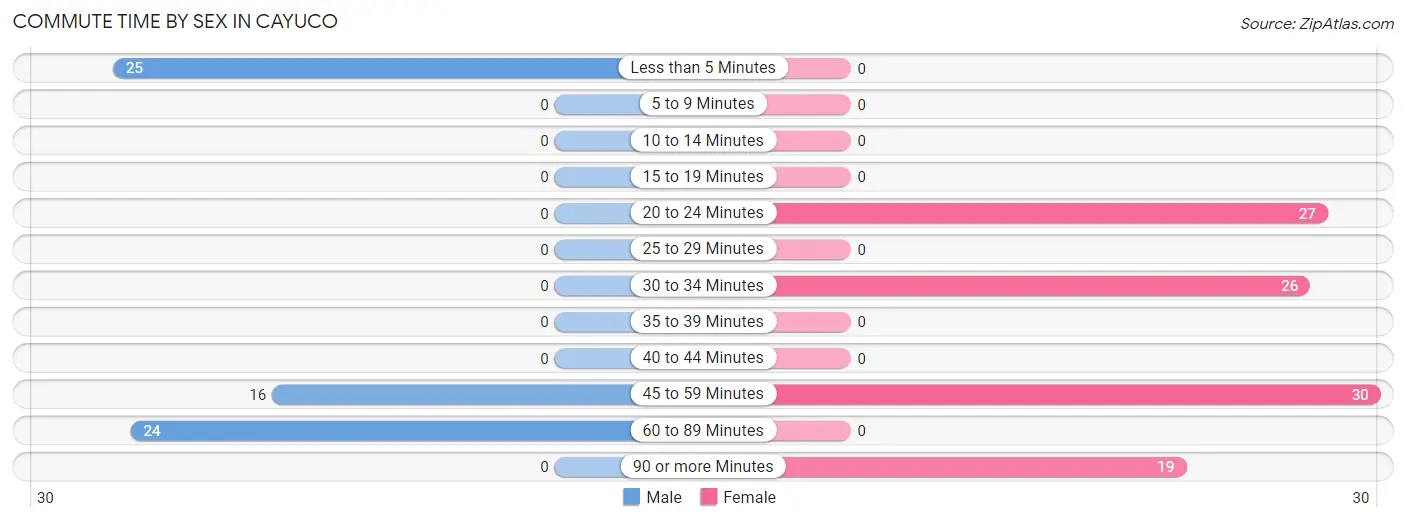
Commute Time by Sex in Cayuco
The most common commute times in Cayuco are less than 5 minutes (25 commuters, 38.5%) for males and 45 to 59 minutes (30 commuters, 29.4%) for females.
| Commute Time | Male | Female |
| Less than 5 Minutes | 25 (38.5%) | 0 (0.0%) |
| 5 to 9 Minutes | 0 (0.0%) | 0 (0.0%) |
| 10 to 14 Minutes | 0 (0.0%) | 0 (0.0%) |
| 15 to 19 Minutes | 0 (0.0%) | 0 (0.0%) |
| 20 to 24 Minutes | 0 (0.0%) | 27 (26.5%) |
| 25 to 29 Minutes | 0 (0.0%) | 0 (0.0%) |
| 30 to 34 Minutes | 0 (0.0%) | 26 (25.5%) |
| 35 to 39 Minutes | 0 (0.0%) | 0 (0.0%) |
| 40 to 44 Minutes | 0 (0.0%) | 0 (0.0%) |
| 45 to 59 Minutes | 16 (24.6%) | 30 (29.4%) |
| 60 to 89 Minutes | 24 (36.9%) | 0 (0.0%) |
| 90 or more Minutes | 0 (0.0%) | 19 (18.6%) |
Time of Departure to Work by Sex in Cayuco
The most frequent times of departure to work in Cayuco are 9:00 AM to 9:59 AM (40, 61.5%) for males and 7:30 AM to 7:59 AM (44, 43.1%) for females.
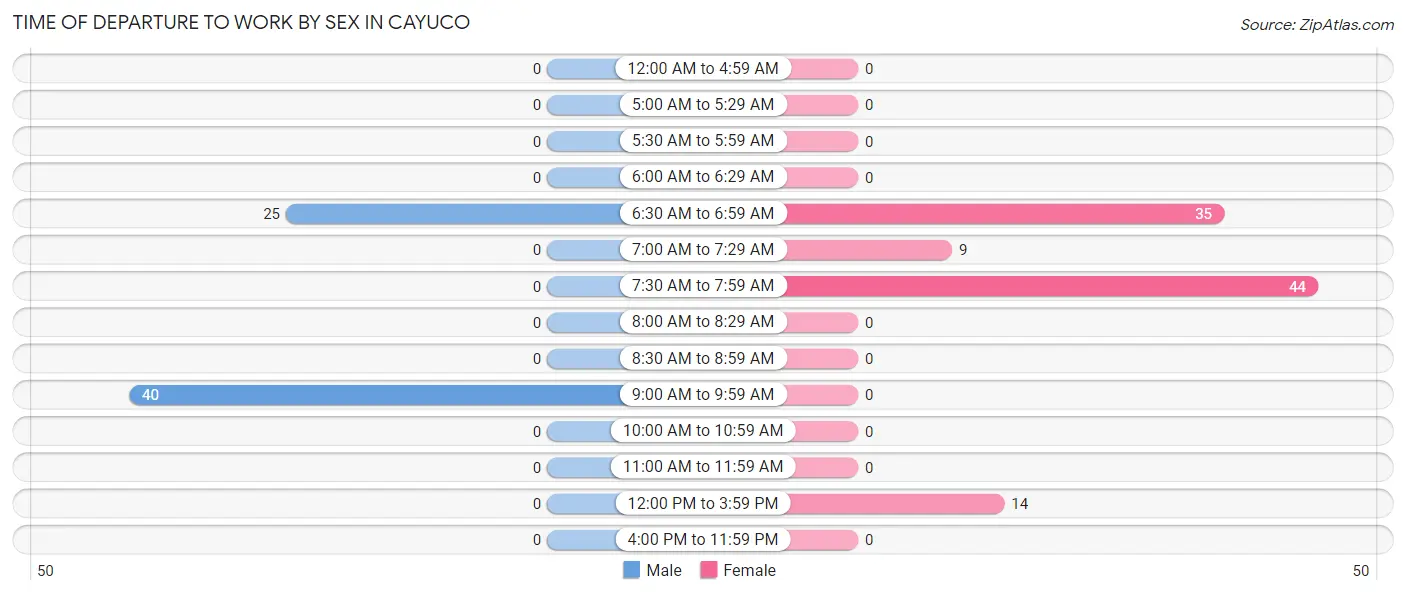
| Time of Departure | Male | Female |
| 12:00 AM to 4:59 AM | 0 (0.0%) | 0 (0.0%) |
| 5:00 AM to 5:29 AM | 0 (0.0%) | 0 (0.0%) |
| 5:30 AM to 5:59 AM | 0 (0.0%) | 0 (0.0%) |
| 6:00 AM to 6:29 AM | 0 (0.0%) | 0 (0.0%) |
| 6:30 AM to 6:59 AM | 25 (38.5%) | 35 (34.3%) |
| 7:00 AM to 7:29 AM | 0 (0.0%) | 9 (8.8%) |
| 7:30 AM to 7:59 AM | 0 (0.0%) | 44 (43.1%) |
| 8:00 AM to 8:29 AM | 0 (0.0%) | 0 (0.0%) |
| 8:30 AM to 8:59 AM | 0 (0.0%) | 0 (0.0%) |
| 9:00 AM to 9:59 AM | 40 (61.5%) | 0 (0.0%) |
| 10:00 AM to 10:59 AM | 0 (0.0%) | 0 (0.0%) |
| 11:00 AM to 11:59 AM | 0 (0.0%) | 0 (0.0%) |
| 12:00 PM to 3:59 PM | 0 (0.0%) | 14 (13.7%) |
| 4:00 PM to 11:59 PM | 0 (0.0%) | 0 (0.0%) |
| Total | 65 (100.0%) | 102 (100.0%) |
Housing Occupancy in Cayuco
Occupancy by Ownership in Cayuco
Of the total 364 dwellings in Cayuco, owner-occupied units account for 265 (72.8%), while renter-occupied units make up 99 (27.2%).
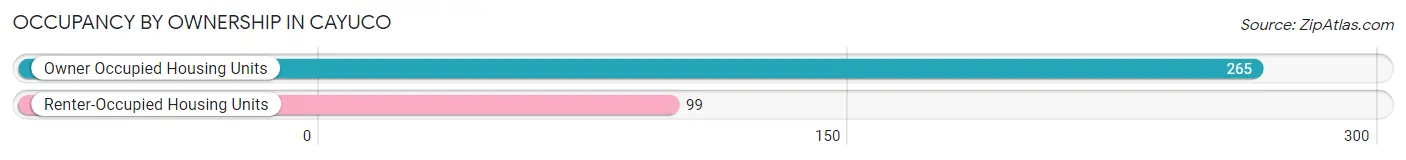
| Occupancy | # Housing Units | % Housing Units |
| Owner Occupied Housing Units | 265 | 72.8% |
| Renter-Occupied Housing Units | 99 | 27.2% |
| Total Occupied Housing Units | 364 | 100.0% |
Occupancy by Household Size in Cayuco
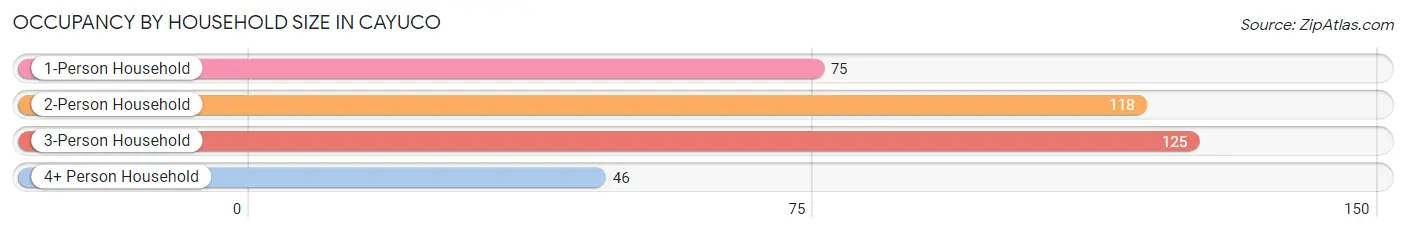
| Household Size | # Housing Units | % Housing Units |
| 1-Person Household | 75 | 20.6% |
| 2-Person Household | 118 | 32.4% |
| 3-Person Household | 125 | 34.3% |
| 4+ Person Household | 46 | 12.6% |
| Total Housing Units | 364 | 100.0% |
Occupancy by Ownership by Household Size in Cayuco
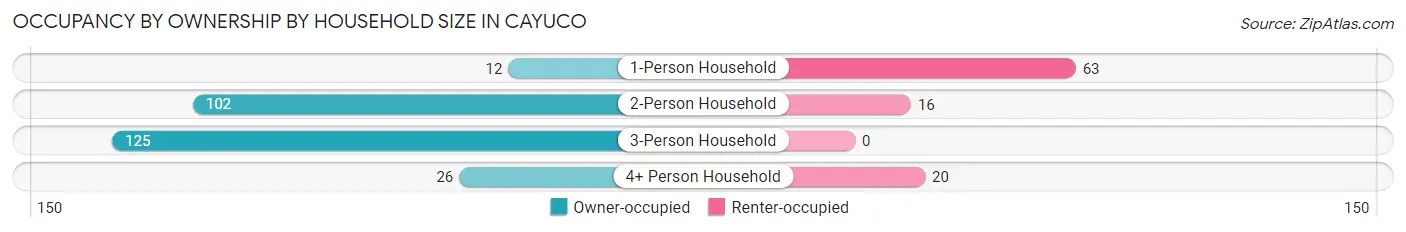
| Household Size | Owner-occupied | Renter-occupied |
| 1-Person Household | 12 (16.0%) | 63 (84.0%) |
| 2-Person Household | 102 (86.4%) | 16 (13.6%) |
| 3-Person Household | 125 (100.0%) | 0 (0.0%) |
| 4+ Person Household | 26 (56.5%) | 20 (43.5%) |
| Total Housing Units | 265 (72.8%) | 99 (27.2%) |
Occupancy by Educational Attainment in Cayuco
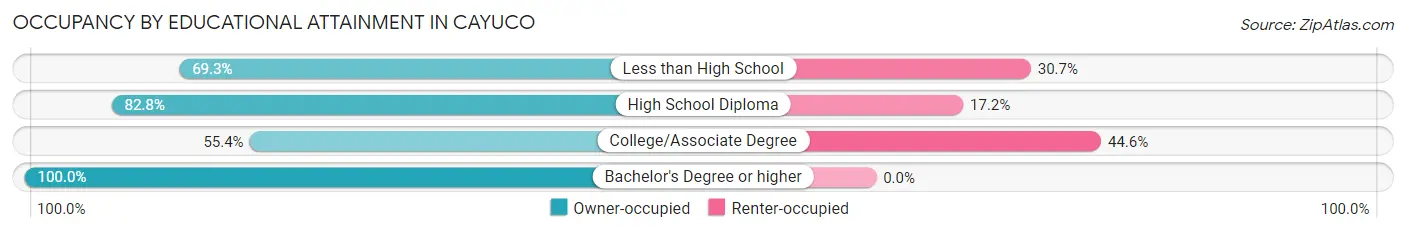
| Household Size | Owner-occupied | Renter-occupied |
| Less than High School | 95 (69.3%) | 42 (30.7%) |
| High School Diploma | 96 (82.8%) | 20 (17.2%) |
| College/Associate Degree | 46 (55.4%) | 37 (44.6%) |
| Bachelor's Degree or higher | 28 (100.0%) | 0 (0.0%) |
Occupancy by Age of Householder in Cayuco
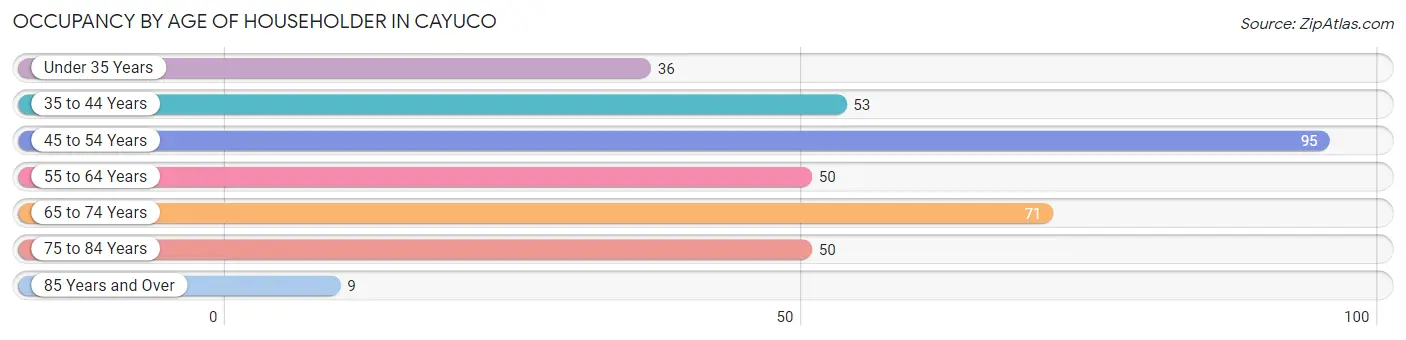
| Age Bracket | # Households | % Households |
| Under 35 Years | 36 | 9.9% |
| 35 to 44 Years | 53 | 14.6% |
| 45 to 54 Years | 95 | 26.1% |
| 55 to 64 Years | 50 | 13.7% |
| 65 to 74 Years | 71 | 19.5% |
| 75 to 84 Years | 50 | 13.7% |
| 85 Years and Over | 9 | 2.5% |
| Total | 364 | 100.0% |
Housing Finances in Cayuco
Median Income by Occupancy in Cayuco
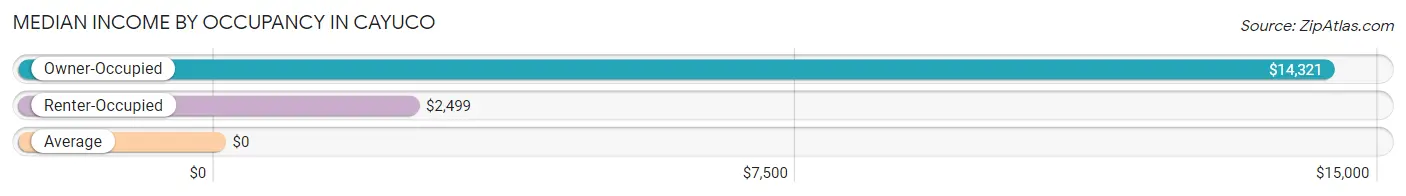
| Occupancy Type | # Households | Median Income |
| Owner-Occupied | 265 (72.8%) | $14,321 |
| Renter-Occupied | 99 (27.2%) | $2,499 |
| Average | 364 (100.0%) | $0 |
Occupancy by Householder Income Bracket in Cayuco
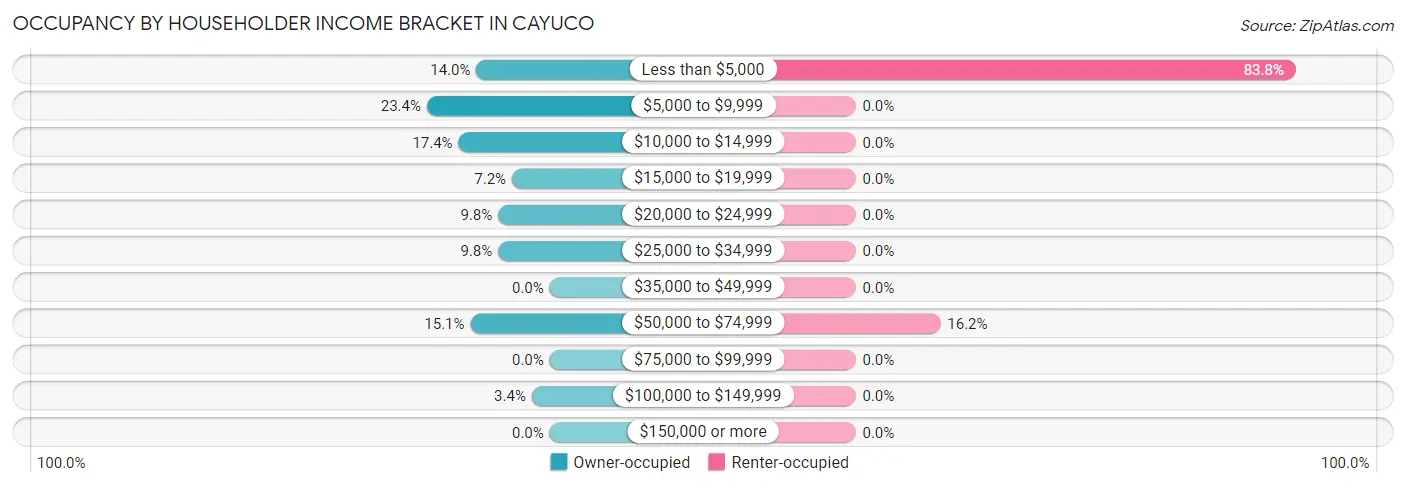
| Income Bracket | Owner-occupied | Renter-occupied |
| Less than $5,000 | 37 (14.0%) | 83 (83.8%) |
| $5,000 to $9,999 | 62 (23.4%) | 0 (0.0%) |
| $10,000 to $14,999 | 46 (17.4%) | 0 (0.0%) |
| $15,000 to $19,999 | 19 (7.2%) | 0 (0.0%) |
| $20,000 to $24,999 | 26 (9.8%) | 0 (0.0%) |
| $25,000 to $34,999 | 26 (9.8%) | 0 (0.0%) |
| $35,000 to $49,999 | 0 (0.0%) | 0 (0.0%) |
| $50,000 to $74,999 | 40 (15.1%) | 16 (16.2%) |
| $75,000 to $99,999 | 0 (0.0%) | 0 (0.0%) |
| $100,000 to $149,999 | 9 (3.4%) | 0 (0.0%) |
| $150,000 or more | 0 (0.0%) | 0 (0.0%) |
| Total | 265 (100.0%) | 99 (100.0%) |
Monthly Housing Cost Tiers in Cayuco
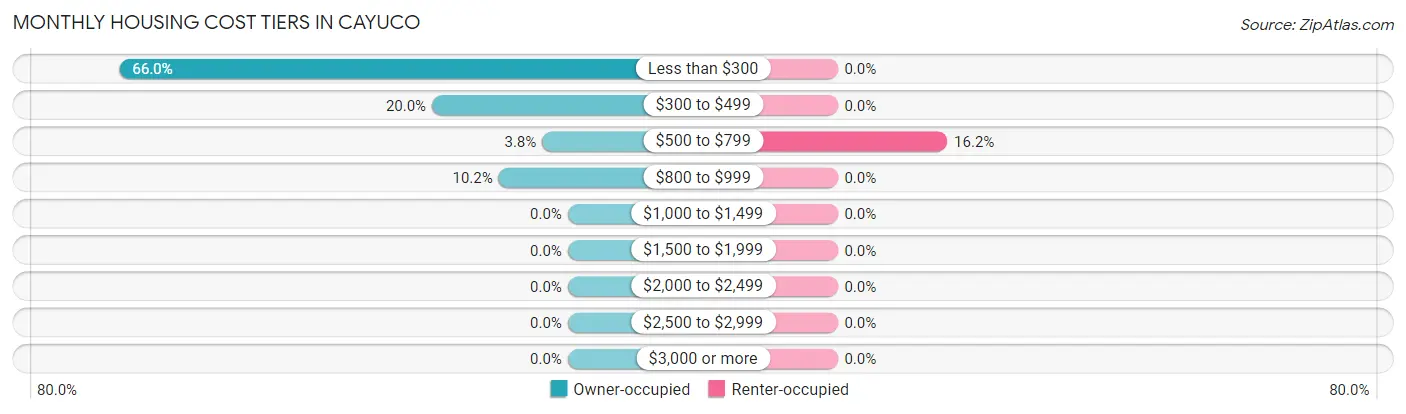
| Monthly Cost | Owner-occupied | Renter-occupied |
| Less than $300 | 175 (66.0%) | 0 (0.0%) |
| $300 to $499 | 53 (20.0%) | 0 (0.0%) |
| $500 to $799 | 10 (3.8%) | 16 (16.2%) |
| $800 to $999 | 27 (10.2%) | 0 (0.0%) |
| $1,000 to $1,499 | 0 (0.0%) | 0 (0.0%) |
| $1,500 to $1,999 | 0 (0.0%) | 0 (0.0%) |
| $2,000 to $2,499 | 0 (0.0%) | 0 (0.0%) |
| $2,500 to $2,999 | 0 (0.0%) | 0 (0.0%) |
| $3,000 or more | 0 (0.0%) | 0 (0.0%) |
| Total | 265 (100.0%) | 99 (100.0%) |
Physical Housing Characteristics in Cayuco
Housing Structures in Cayuco
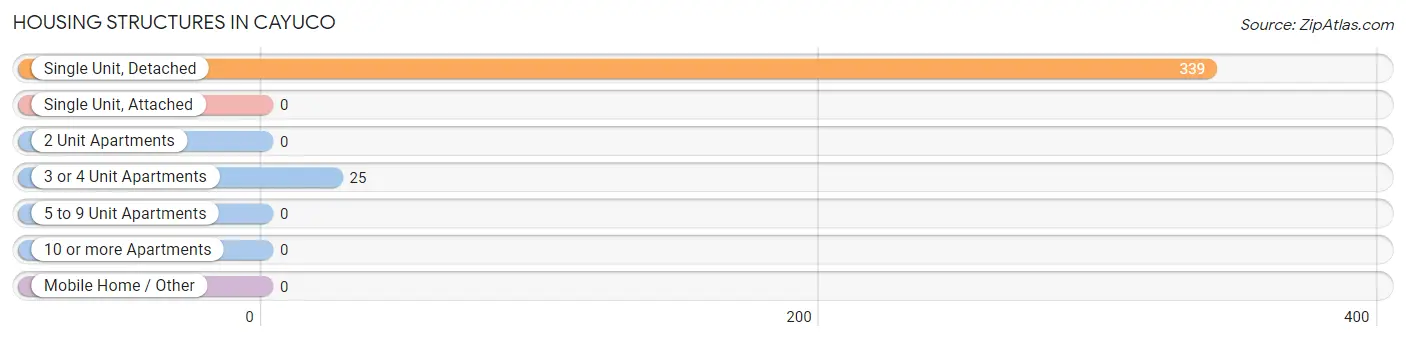
| Structure Type | # Housing Units | % Housing Units |
| Single Unit, Detached | 339 | 93.1% |
| Single Unit, Attached | 0 | 0.0% |
| 2 Unit Apartments | 0 | 0.0% |
| 3 or 4 Unit Apartments | 25 | 6.9% |
| 5 to 9 Unit Apartments | 0 | 0.0% |
| 10 or more Apartments | 0 | 0.0% |
| Mobile Home / Other | 0 | 0.0% |
| Total | 364 | 100.0% |
Housing Structures by Occupancy in Cayuco
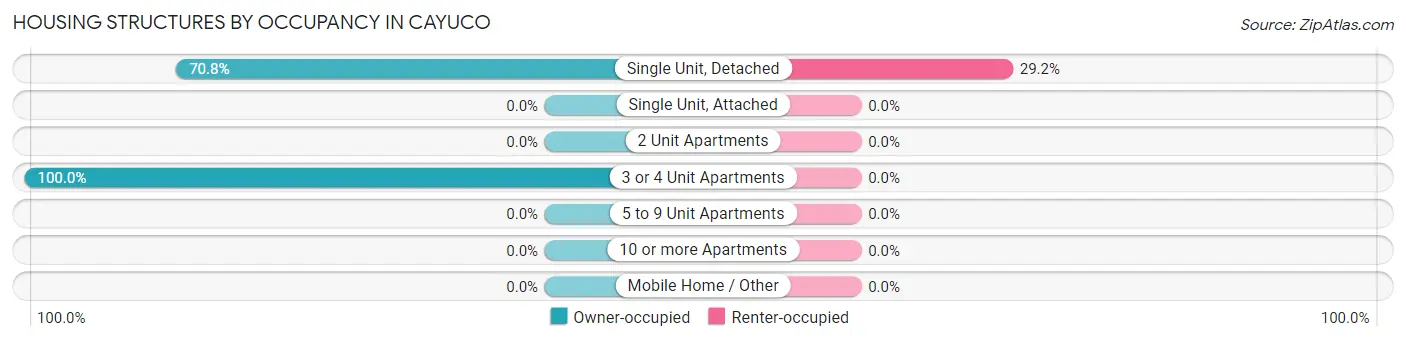
| Structure Type | Owner-occupied | Renter-occupied |
| Single Unit, Detached | 240 (70.8%) | 99 (29.2%) |
| Single Unit, Attached | 0 (0.0%) | 0 (0.0%) |
| 2 Unit Apartments | 0 (0.0%) | 0 (0.0%) |
| 3 or 4 Unit Apartments | 25 (100.0%) | 0 (0.0%) |
| 5 to 9 Unit Apartments | 0 (0.0%) | 0 (0.0%) |
| 10 or more Apartments | 0 (0.0%) | 0 (0.0%) |
| Mobile Home / Other | 0 (0.0%) | 0 (0.0%) |
| Total | 265 (72.8%) | 99 (27.2%) |
Housing Structures by Number of Rooms in Cayuco
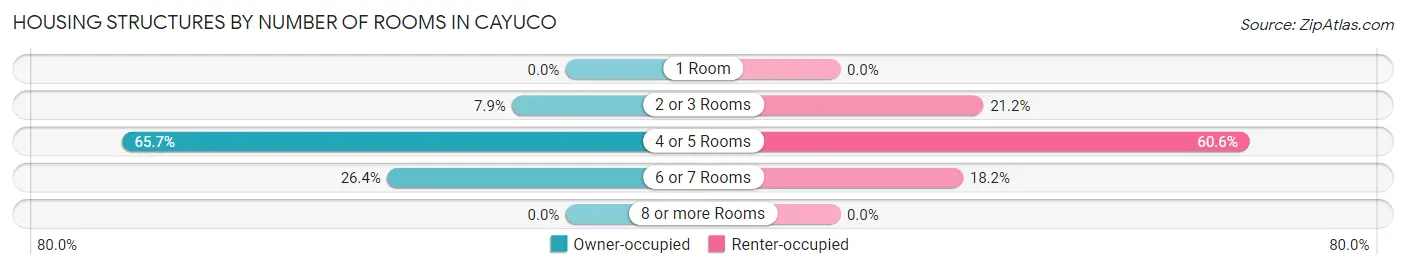
| Number of Rooms | Owner-occupied | Renter-occupied |
| 1 Room | 0 (0.0%) | 0 (0.0%) |
| 2 or 3 Rooms | 21 (7.9%) | 21 (21.2%) |
| 4 or 5 Rooms | 174 (65.7%) | 60 (60.6%) |
| 6 or 7 Rooms | 70 (26.4%) | 18 (18.2%) |
| 8 or more Rooms | 0 (0.0%) | 0 (0.0%) |
| Total | 265 (100.0%) | 99 (100.0%) |
Housing Structure by Heating Type in Cayuco
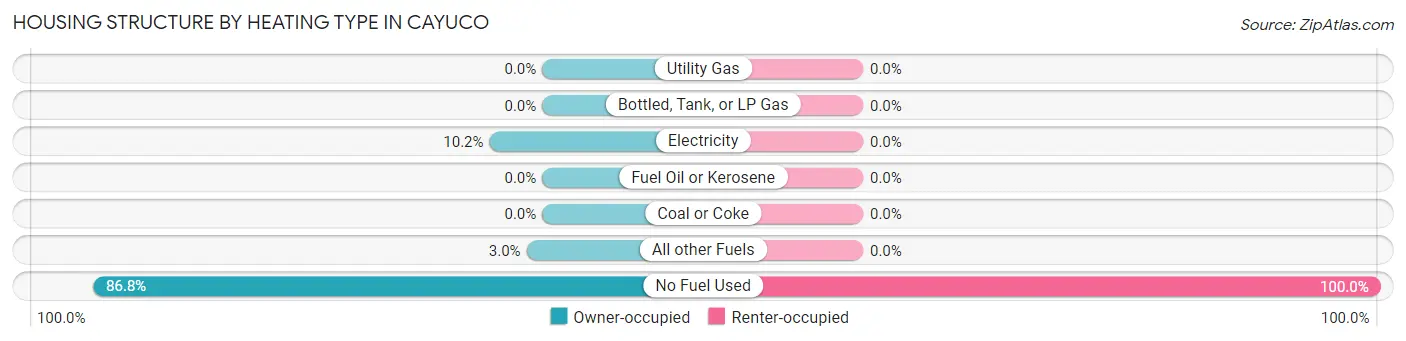
| Heating Type | Owner-occupied | Renter-occupied |
| Utility Gas | 0 (0.0%) | 0 (0.0%) |
| Bottled, Tank, or LP Gas | 0 (0.0%) | 0 (0.0%) |
| Electricity | 27 (10.2%) | 0 (0.0%) |
| Fuel Oil or Kerosene | 0 (0.0%) | 0 (0.0%) |
| Coal or Coke | 0 (0.0%) | 0 (0.0%) |
| All other Fuels | 8 (3.0%) | 0 (0.0%) |
| No Fuel Used | 230 (86.8%) | 99 (100.0%) |
| Total | 265 (100.0%) | 99 (100.0%) |
Household Vehicle Usage in Cayuco
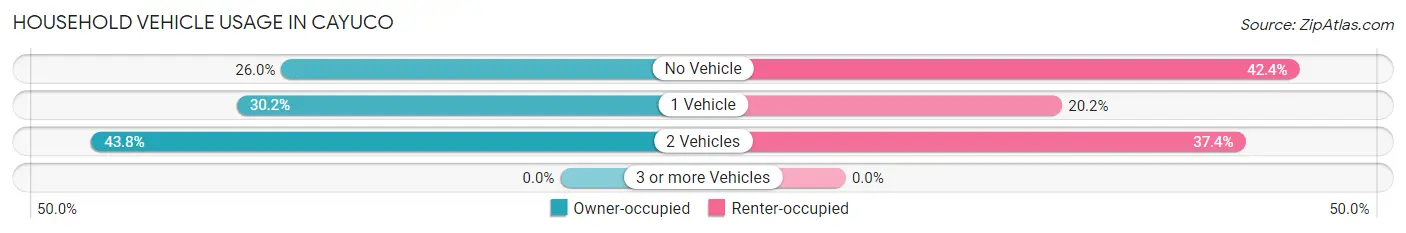
| Vehicles per Household | Owner-occupied | Renter-occupied |
| No Vehicle | 69 (26.0%) | 42 (42.4%) |
| 1 Vehicle | 80 (30.2%) | 20 (20.2%) |
| 2 Vehicles | 116 (43.8%) | 37 (37.4%) |
| 3 or more Vehicles | 0 (0.0%) | 0 (0.0%) |
| Total | 265 (100.0%) | 99 (100.0%) |
Real Estate & Mortgages in Cayuco
Real Estate and Mortgage Overview in Cayuco
| Characteristic | Without Mortgage | With Mortgage |
| Housing Units | 175 | 90 |
| Median Property Value | $89,300 | $76,600 |
| Median Household Income | $14,755 | $0 |
| Monthly Housing Costs | $135 | $0 |
| Real Estate Taxes | - | - |
Property Value by Mortgage Status in Cayuco
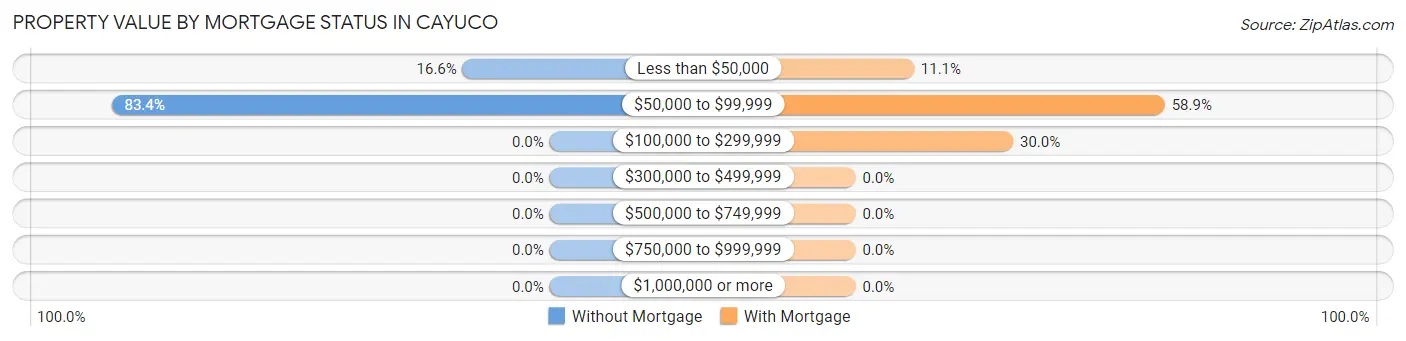
| Property Value | Without Mortgage | With Mortgage |
| Less than $50,000 | 29 (16.6%) | 10 (11.1%) |
| $50,000 to $99,999 | 146 (83.4%) | 53 (58.9%) |
| $100,000 to $299,999 | 0 (0.0%) | 27 (30.0%) |
| $300,000 to $499,999 | 0 (0.0%) | 0 (0.0%) |
| $500,000 to $749,999 | 0 (0.0%) | 0 (0.0%) |
| $750,000 to $999,999 | 0 (0.0%) | 0 (0.0%) |
| $1,000,000 or more | 0 (0.0%) | 0 (0.0%) |
| Total | 175 (100.0%) | 90 (100.0%) |
Household Income by Mortgage Status in Cayuco
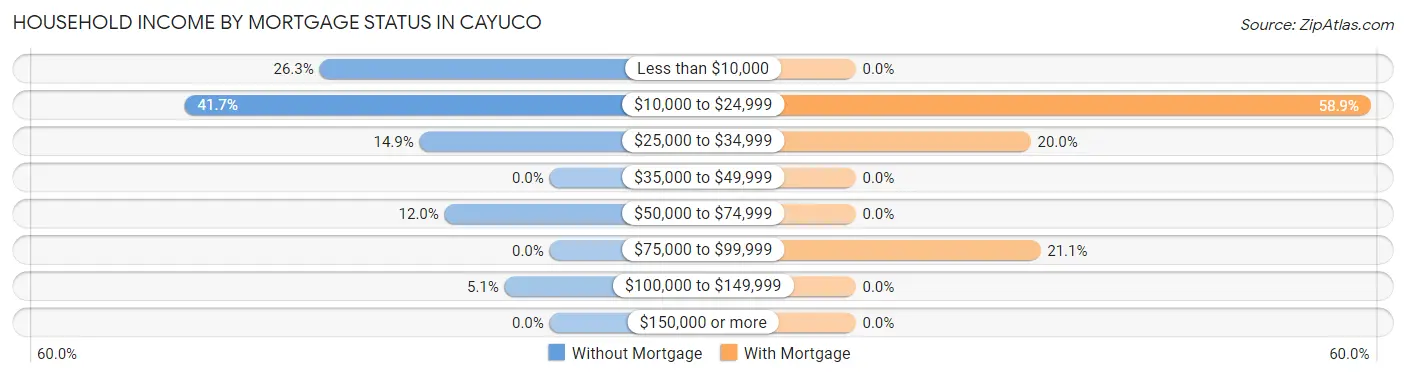
| Household Income | Without Mortgage | With Mortgage |
| Less than $10,000 | 46 (26.3%) | 0 (0.0%) |
| $10,000 to $24,999 | 73 (41.7%) | 53 (58.9%) |
| $25,000 to $34,999 | 26 (14.9%) | 18 (20.0%) |
| $35,000 to $49,999 | 0 (0.0%) | 0 (0.0%) |
| $50,000 to $74,999 | 21 (12.0%) | 0 (0.0%) |
| $75,000 to $99,999 | 0 (0.0%) | 19 (21.1%) |
| $100,000 to $149,999 | 9 (5.1%) | 0 (0.0%) |
| $150,000 or more | 0 (0.0%) | 0 (0.0%) |
| Total | 175 (100.0%) | 90 (100.0%) |
Property Value to Household Income Ratio in Cayuco
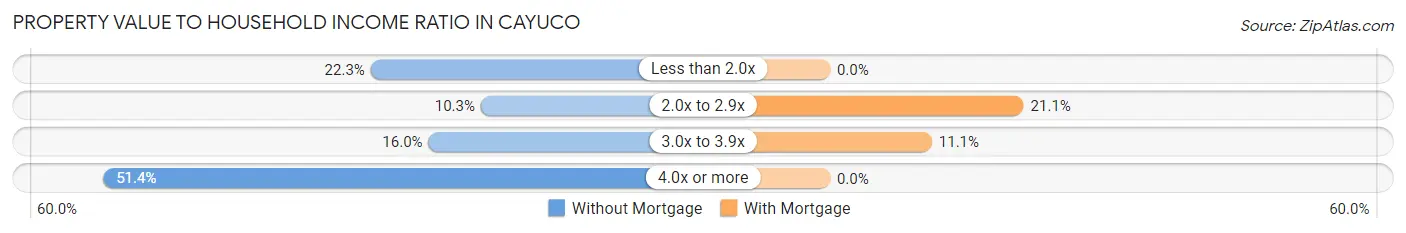
| Value-to-Income Ratio | Without Mortgage | With Mortgage |
| Less than 2.0x | 39 (22.3%) | 0 (0.0%) |
| 2.0x to 2.9x | 18 (10.3%) | 19 (21.1%) |
| 3.0x to 3.9x | 28 (16.0%) | 10 (11.1%) |
| 4.0x or more | 90 (51.4%) | 0 (0.0%) |
| Total | 175 (100.0%) | 90 (100.0%) |
Real Estate Taxes by Mortgage Status in Cayuco
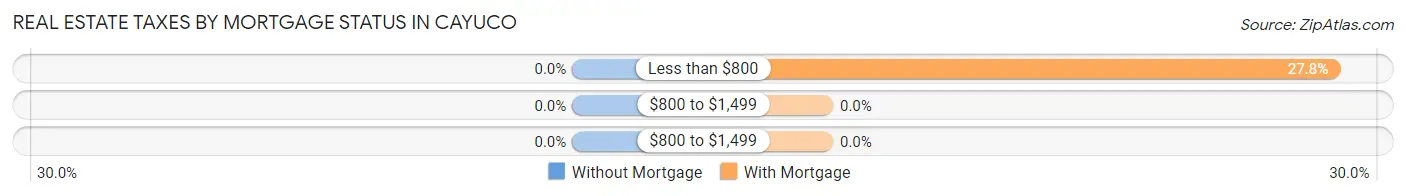
| Property Taxes | Without Mortgage | With Mortgage |
| Less than $800 | 0 (0.0%) | 25 (27.8%) |
| $800 to $1,499 | 0 (0.0%) | 0 (0.0%) |
| $800 to $1,499 | 0 (0.0%) | 0 (0.0%) |
| Total | 175 (100.0%) | 90 (100.0%) |
Health & Disability in Cayuco
Health Insurance Coverage by Age in Cayuco
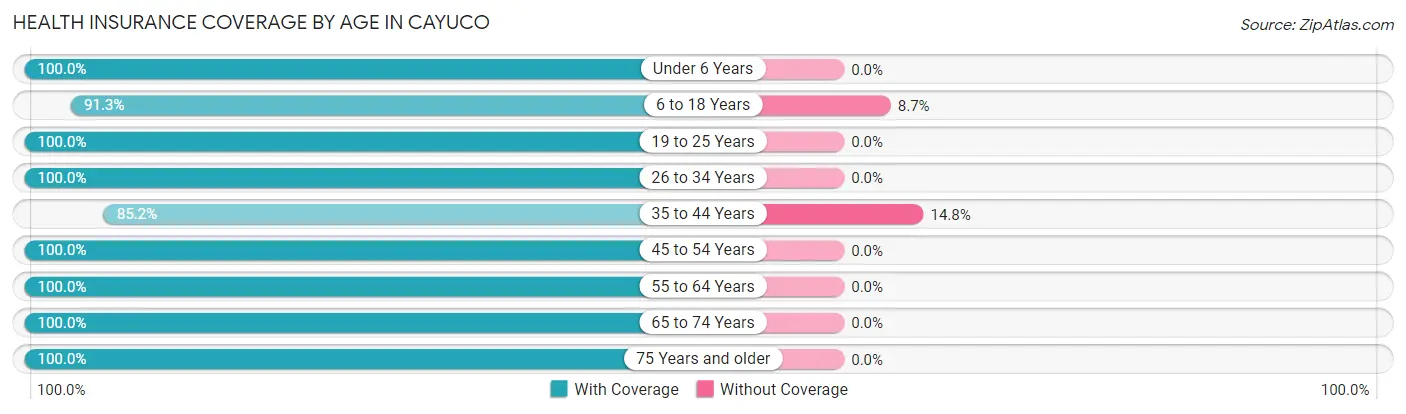
| Age Bracket | With Coverage | Without Coverage |
| Under 6 Years | 20 (100.0%) | 0 (0.0%) |
| 6 to 18 Years | 221 (91.3%) | 21 (8.7%) |
| 19 to 25 Years | 60 (100.0%) | 0 (0.0%) |
| 26 to 34 Years | 135 (100.0%) | 0 (0.0%) |
| 35 to 44 Years | 98 (85.2%) | 17 (14.8%) |
| 45 to 54 Years | 138 (100.0%) | 0 (0.0%) |
| 55 to 64 Years | 104 (100.0%) | 0 (0.0%) |
| 65 to 74 Years | 158 (100.0%) | 0 (0.0%) |
| 75 Years and older | 59 (100.0%) | 0 (0.0%) |
| Total | 993 (96.3%) | 38 (3.7%) |
Health Insurance Coverage by Citizenship Status in Cayuco
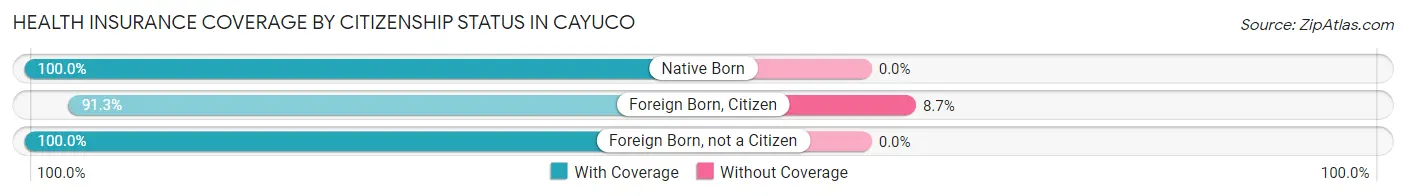
| Citizenship Status | With Coverage | Without Coverage |
| Native Born | 20 (100.0%) | 0 (0.0%) |
| Foreign Born, Citizen | 221 (91.3%) | 21 (8.7%) |
| Foreign Born, not a Citizen | 60 (100.0%) | 0 (0.0%) |
Health Insurance Coverage by Household Income in Cayuco
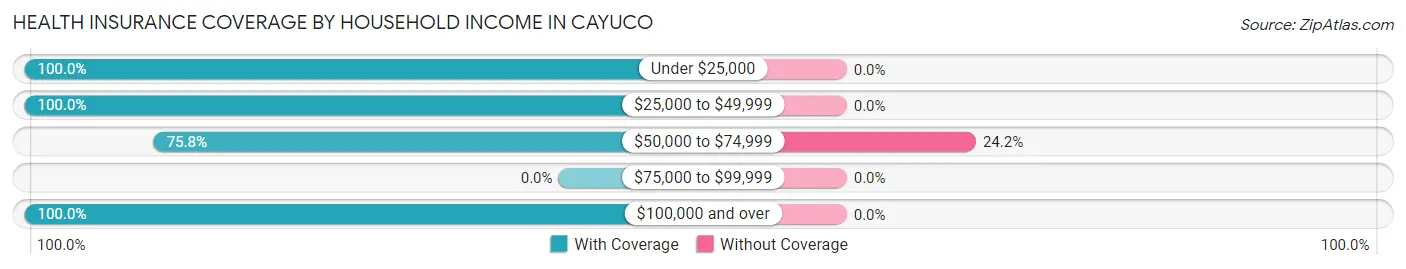
| Household Income | With Coverage | Without Coverage |
| Under $25,000 | 741 (100.0%) | 0 (0.0%) |
| $25,000 to $49,999 | 75 (100.0%) | 0 (0.0%) |
| $50,000 to $74,999 | 119 (75.8%) | 38 (24.2%) |
| $75,000 to $99,999 | 0 (0.0%) | 0 (0.0%) |
| $100,000 and over | 58 (100.0%) | 0 (0.0%) |
Public vs Private Health Insurance Coverage by Age in Cayuco
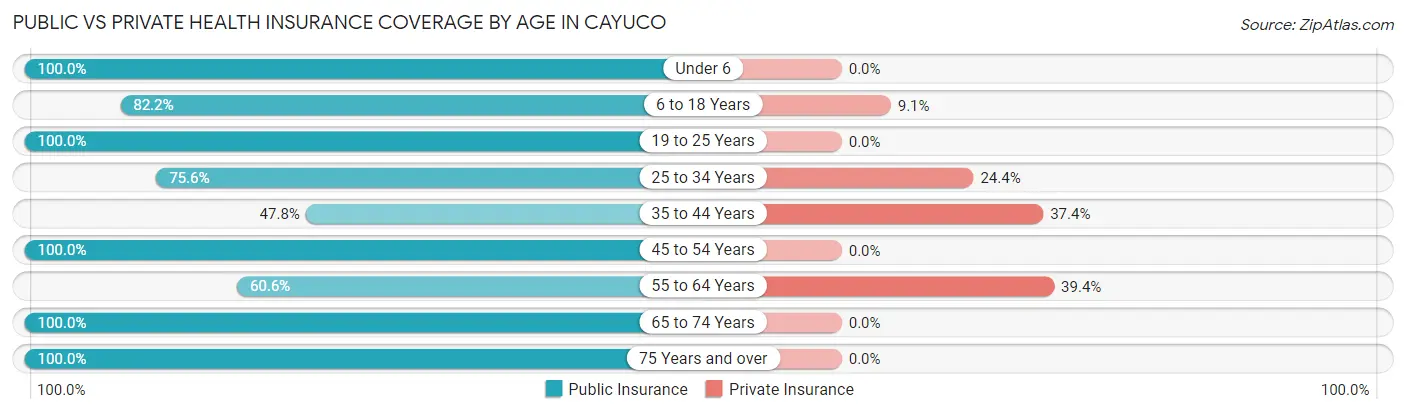
| Age Bracket | Public Insurance | Private Insurance |
| Under 6 | 20 (100.0%) | 0 (0.0%) |
| 6 to 18 Years | 199 (82.2%) | 22 (9.1%) |
| 19 to 25 Years | 60 (100.0%) | 0 (0.0%) |
| 25 to 34 Years | 102 (75.6%) | 33 (24.4%) |
| 35 to 44 Years | 55 (47.8%) | 43 (37.4%) |
| 45 to 54 Years | 138 (100.0%) | 0 (0.0%) |
| 55 to 64 Years | 63 (60.6%) | 41 (39.4%) |
| 65 to 74 Years | 158 (100.0%) | 0 (0.0%) |
| 75 Years and over | 59 (100.0%) | 0 (0.0%) |
| Total | 854 (82.8%) | 139 (13.5%) |
Disability Status by Sex by Age in Cayuco
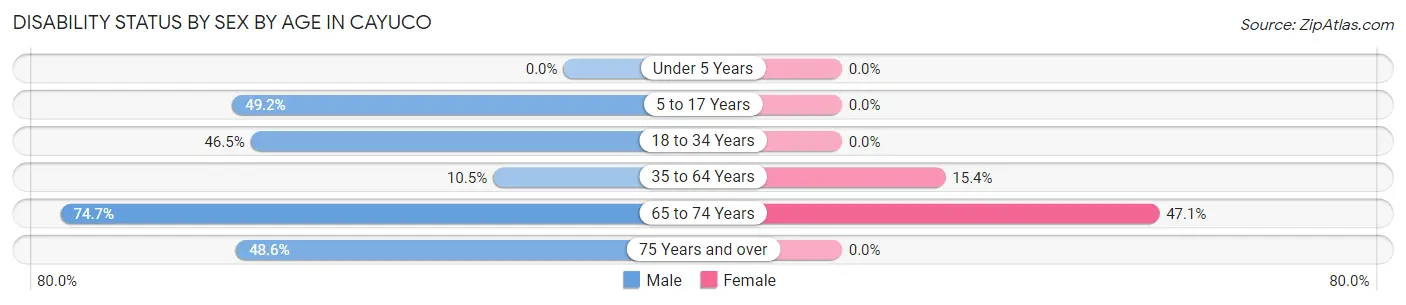
| Age Bracket | Male | Female |
| Under 5 Years | 0 (0.0%) | 0 (0.0%) |
| 5 to 17 Years | 58 (49.1%) | 0 (0.0%) |
| 18 to 34 Years | 46 (46.5%) | 0 (0.0%) |
| 35 to 64 Years | 21 (10.4%) | 24 (15.4%) |
| 65 to 74 Years | 53 (74.7%) | 41 (47.1%) |
| 75 Years and over | 17 (48.6%) | 0 (0.0%) |
Disability Class by Sex by Age in Cayuco
Disability Class: Hearing Difficulty
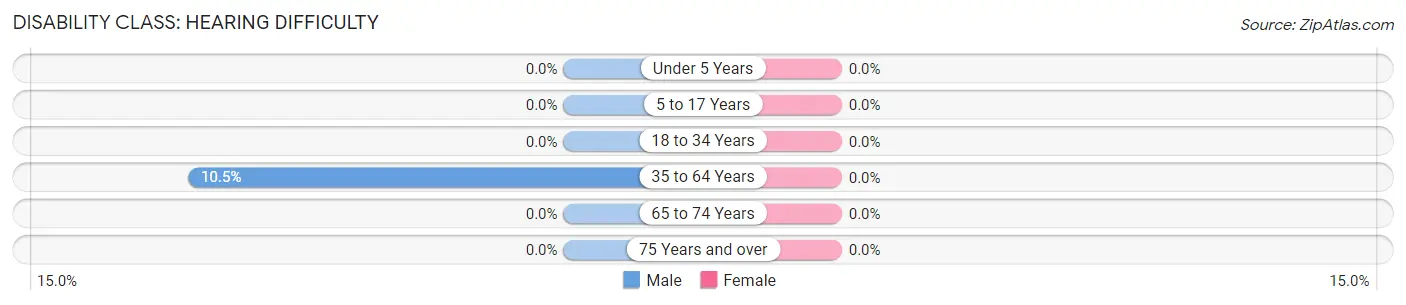
| Age Bracket | Male | Female |
| Under 5 Years | 0 (0.0%) | 0 (0.0%) |
| 5 to 17 Years | 0 (0.0%) | 0 (0.0%) |
| 18 to 34 Years | 0 (0.0%) | 0 (0.0%) |
| 35 to 64 Years | 21 (10.4%) | 0 (0.0%) |
| 65 to 74 Years | 0 (0.0%) | 0 (0.0%) |
| 75 Years and over | 0 (0.0%) | 0 (0.0%) |
Disability Class: Vision Difficulty
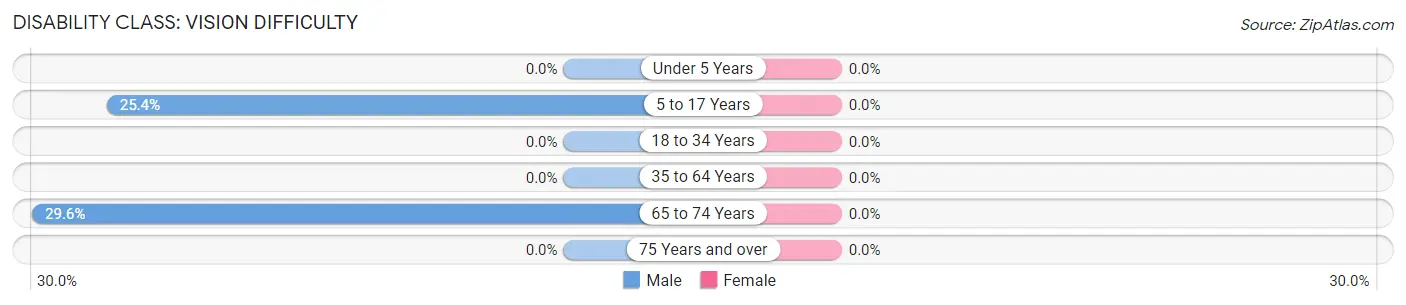
| Age Bracket | Male | Female |
| Under 5 Years | 0 (0.0%) | 0 (0.0%) |
| 5 to 17 Years | 30 (25.4%) | 0 (0.0%) |
| 18 to 34 Years | 0 (0.0%) | 0 (0.0%) |
| 35 to 64 Years | 0 (0.0%) | 0 (0.0%) |
| 65 to 74 Years | 21 (29.6%) | 0 (0.0%) |
| 75 Years and over | 0 (0.0%) | 0 (0.0%) |
Disability Class: Cognitive Difficulty
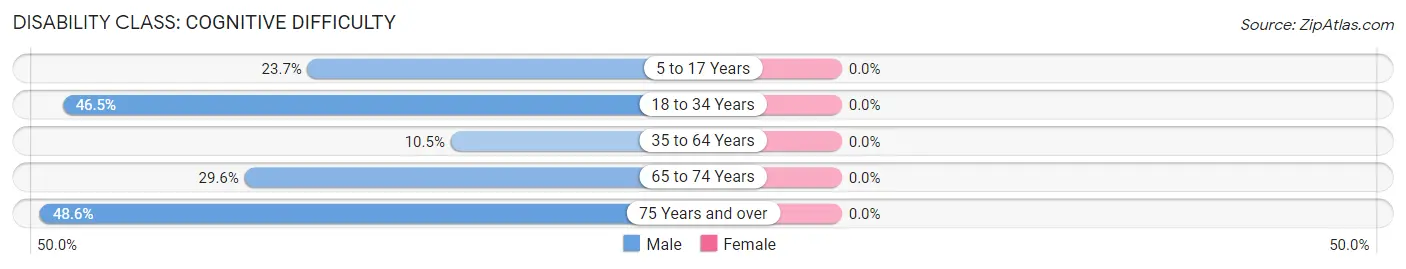
| Age Bracket | Male | Female |
| 5 to 17 Years | 28 (23.7%) | 0 (0.0%) |
| 18 to 34 Years | 46 (46.5%) | 0 (0.0%) |
| 35 to 64 Years | 21 (10.4%) | 0 (0.0%) |
| 65 to 74 Years | 21 (29.6%) | 0 (0.0%) |
| 75 Years and over | 17 (48.6%) | 0 (0.0%) |
Disability Class: Ambulatory Difficulty
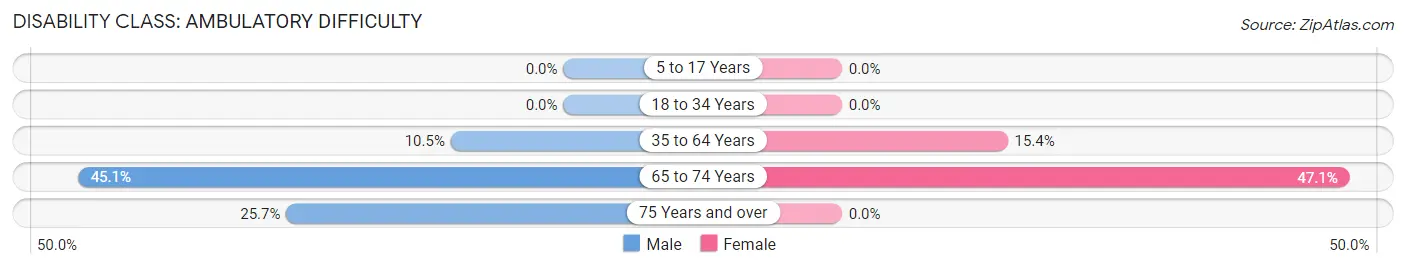
| Age Bracket | Male | Female |
| 5 to 17 Years | 0 (0.0%) | 0 (0.0%) |
| 18 to 34 Years | 0 (0.0%) | 0 (0.0%) |
| 35 to 64 Years | 21 (10.4%) | 24 (15.4%) |
| 65 to 74 Years | 32 (45.1%) | 41 (47.1%) |
| 75 Years and over | 9 (25.7%) | 0 (0.0%) |
Disability Class: Self-Care Difficulty
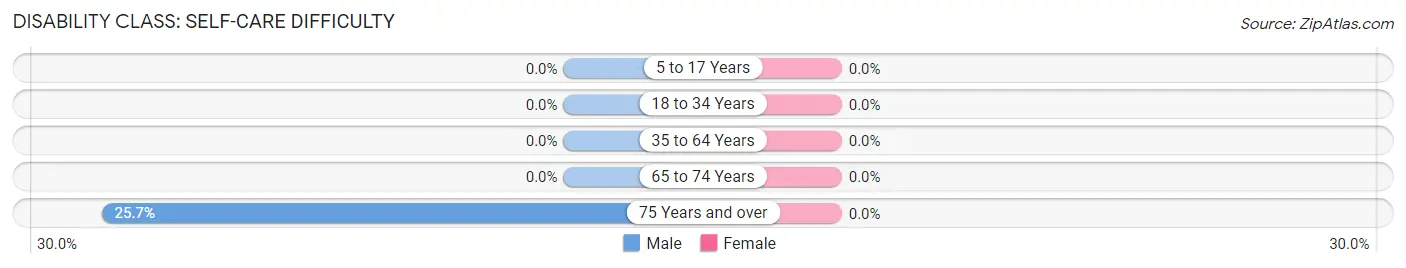
| Age Bracket | Male | Female |
| 5 to 17 Years | 0 (0.0%) | 0 (0.0%) |
| 18 to 34 Years | 0 (0.0%) | 0 (0.0%) |
| 35 to 64 Years | 0 (0.0%) | 0 (0.0%) |
| 65 to 74 Years | 0 (0.0%) | 0 (0.0%) |
| 75 Years and over | 9 (25.7%) | 0 (0.0%) |
Technology Access in Cayuco
Computing Device Access in Cayuco
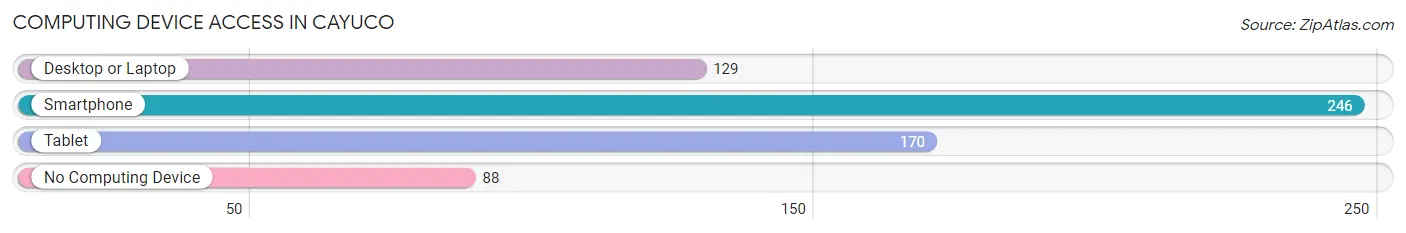
| Device Type | # Households | % Households |
| Desktop or Laptop | 129 | 35.4% |
| Smartphone | 246 | 67.6% |
| Tablet | 170 | 46.7% |
| No Computing Device | 88 | 24.2% |
| Total | 364 | 100.0% |
Internet Access in Cayuco
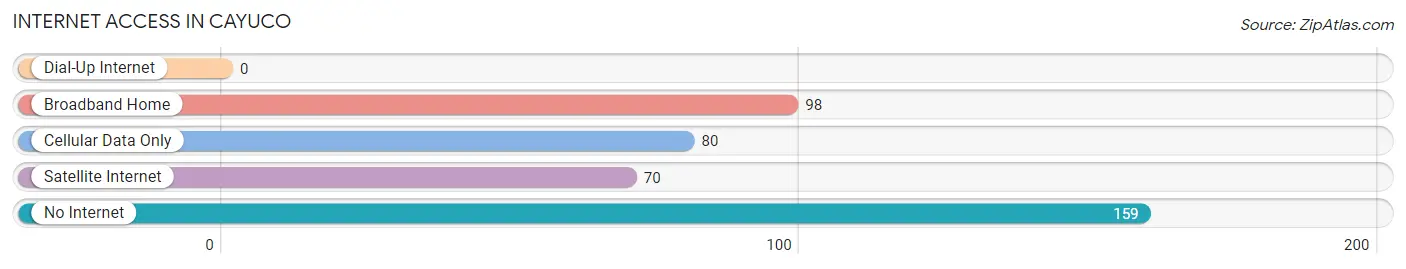
| Internet Type | # Households | % Households |
| Dial-Up Internet | 0 | 0.0% |
| Broadband Home | 98 | 26.9% |
| Cellular Data Only | 80 | 22.0% |
| Satellite Internet | 70 | 19.2% |
| No Internet | 159 | 43.7% |
| Total | 364 | 100.0% |
Cayuco Summary
Cayuco is a small municipality located in the eastern part of Puerto Rico, in the region known as the Eastern Coastal Valley. It is bordered by the municipalities of Loíza, Canóvanas, and Río Grande. The municipality has a total area of 8.3 square miles and a population of 8,845 as of the 2010 census.
History
The area of Cayuco was originally inhabited by the Taíno Indians, who were the first inhabitants of Puerto Rico. The Taíno Indians were a peaceful people who lived in small villages and were skilled farmers and fishermen. The Taíno Indians were eventually displaced by the Spanish, who arrived in Puerto Rico in the early 16th century. The Spanish established a settlement in the area of Cayuco in the late 16th century and named it San Antonio de Cayuco. The settlement was destroyed by a hurricane in 1625 and was later rebuilt in 1630.
In the late 19th century, the area of Cayuco was part of the municipality of Loíza. In 1878, the area was separated from Loíza and became its own municipality. The municipality was named after the Taíno word for “small canoe”, which was used by the Taíno Indians to travel between the islands of Puerto Rico.
Geography
Cayuco is located in the eastern part of Puerto Rico, in the region known as the Eastern Coastal Valley. It is bordered by the municipalities of Loíza, Canóvanas, and Río Grande. The municipality has a total area of 8.3 square miles and a population of 8,845 as of the 2010 census.
The terrain of Cayuco is mostly flat, with some hills in the northern part of the municipality. The climate is tropical, with temperatures ranging from the mid-70s to the mid-80s throughout the year. The average annual rainfall is around 50 inches.
Economy
The economy of Cayuco is largely based on agriculture and tourism. The main agricultural products are sugarcane, bananas, and coffee. The municipality also has several small businesses, including restaurants, shops, and hotels.
Tourism is an important part of the economy of Cayuco. The municipality is home to several beaches, including Playa de Cayuco, Playa de Loíza, and Playa de Canóvanas. The beaches are popular with both locals and tourists, and the municipality also has several hotels and resorts.
Demographics
As of the 2010 census, the population of Cayuco was 8,845. The population is mostly of Puerto Rican descent, with a small percentage of African and Taíno descent. The majority of the population is Roman Catholic, with a small percentage of other religions. The median household income is around $20,000, and the unemployment rate is around 10%.
Conclusion
Cayuco is a small municipality located in the eastern part of Puerto Rico. It has a total area of 8.3 square miles and a population of 8,845 as of the 2010 census. The economy of Cayuco is largely based on agriculture and tourism, and the population is mostly of Puerto Rican descent. Cayuco is home to several beaches, which are popular with both locals and tourists, and the municipality also has several small businesses.
Common Questions
What is Per Capita Income in Cayuco?
Per Capita income in Cayuco is $8,255.
What is the Median Family Income in Cayuco?
Median Family Income in Cayuco is $15,263.
What is Income or Wage Gap in Cayuco?
Income or Wage Gap in Cayuco is 2.3%.
Women in Cayuco earn 97.7 cents for every dollar earned by a man.
What is Inequality or Gini Index in Cayuco?
Inequality or Gini Index in Cayuco is 0.62.
What is the Total Population of Cayuco?
Total Population of Cayuco is 1,031.
What is the Total Male Population of Cayuco?
Total Male Population of Cayuco is 544.
What is the Total Female Population of Cayuco?
Total Female Population of Cayuco is 487.
What is the Ratio of Males per 100 Females in Cayuco?
There are 111.70 Males per 100 Females in Cayuco.
What is the Ratio of Females per 100 Males in Cayuco?
There are 89.52 Females per 100 Males in Cayuco.
What is the Median Population Age in Cayuco?
Median Population Age in Cayuco is 37.9 Years.
What is the Average Family Size in Cayuco
Average Family Size in Cayuco is 3.4 People.
What is the Average Household Size in Cayuco
Average Household Size in Cayuco is 2.8 People.
How Large is the Labor Force in Cayuco?
There are 294 People in the Labor Forcein in Cayuco.
What is the Percentage of People in the Labor Force in Cayuco?
37.8% of People are in the Labor Force in Cayuco.
What is the Unemployment Rate in Cayuco?
Unemployment Rate in Cayuco is 43.2%.