Patillas Municipio, PR Map & Demographics
Patillas Municipio Map
Patillas Municipio Overview
$11,832
PER CAPITA INCOME
$23,811
AVG FAMILY INCOME
$20,778
AVG HOUSEHOLD INCOME
12.0%
WAGE / INCOME GAP [ % ]
88.0¢/ $1
WAGE / INCOME GAP [ $ ]
$10,956
FAMILY INCOME DEFICIT
0.48
INEQUALITY / GINI INDEX
15,927
TOTAL POPULATION
7,633
MALE POPULATION
8,294
FEMALE POPULATION
92.03
MALES / 100 FEMALES
108.66
FEMALES / 100 MALES
46.9
MEDIAN AGE
3.2
AVG FAMILY SIZE
2.6
AVG HOUSEHOLD SIZE
4,985
LABOR FORCE [ PEOPLE ]
36.5%
PERCENT IN LABOR FORCE
13.0%
UNEMPLOYMENT RATE
Income in Patillas Municipio
Income Overview in Patillas Municipio
Per Capita Income in Patillas Municipio is $11,832, while median incomes of families and households are $23,811 and $20,778 respectively.
| Characteristic | Number | Measure |
| Per Capita Income | 15,927 | $11,832 |
| Median Family Income | 4,198 | $23,811 |
| Mean Family Income | 4,198 | $30,146 |
| Median Household Income | 6,196 | $20,778 |
| Mean Household Income | 6,196 | $27,279 |
| Income Deficit | 4,198 | $10,956 |
| Wage / Income Gap (%) | 15,927 | 11.97% |
| Wage / Income Gap ($) | 15,927 | 88.03¢ per $1 |
| Gini / Inequality Index | 15,927 | 0.48 |
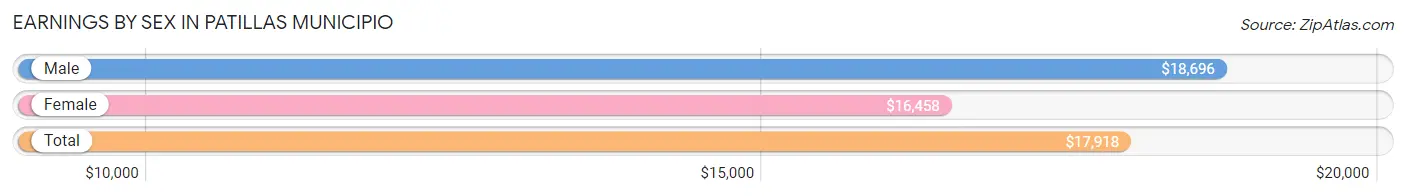
Earnings by Sex in Patillas Municipio
Average Earnings in Patillas Municipio are $17,918, $18,696 for men and $16,458 for women, a difference of 12.0%.
| Sex | Number | Average Earnings |
| Male | 2,814 (57.2%) | $18,696 |
| Female | 2,108 (42.8%) | $16,458 |
| Total | 4,922 (100.0%) | $17,918 |
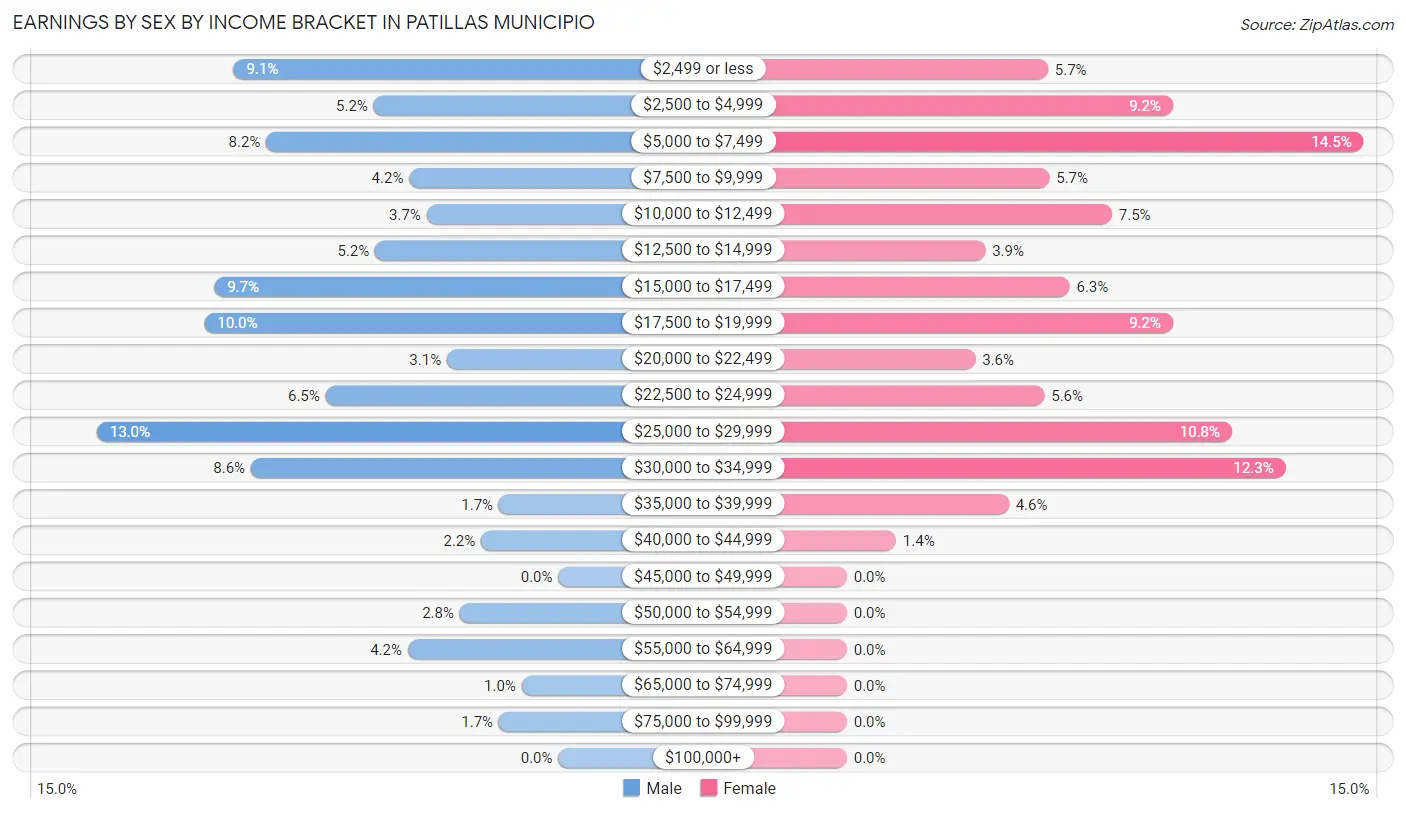
Earnings by Sex by Income Bracket in Patillas Municipio
The most common earnings brackets in Patillas Municipio are $25,000 to $29,999 for men (365 | 13.0%) and $5,000 to $7,499 for women (306 | 14.5%).
| Income | Male | Female |
| $2,499 or less | 257 (9.1%) | 119 (5.7%) |
| $2,500 to $4,999 | 146 (5.2%) | 193 (9.2%) |
| $5,000 to $7,499 | 231 (8.2%) | 306 (14.5%) |
| $7,500 to $9,999 | 118 (4.2%) | 120 (5.7%) |
| $10,000 to $12,499 | 104 (3.7%) | 157 (7.4%) |
| $12,500 to $14,999 | 145 (5.1%) | 82 (3.9%) |
| $15,000 to $17,499 | 272 (9.7%) | 132 (6.3%) |
| $17,500 to $19,999 | 280 (10.0%) | 193 (9.2%) |
| $20,000 to $22,499 | 88 (3.1%) | 76 (3.6%) |
| $22,500 to $24,999 | 184 (6.5%) | 117 (5.6%) |
| $25,000 to $29,999 | 365 (13.0%) | 228 (10.8%) |
| $30,000 to $34,999 | 243 (8.6%) | 260 (12.3%) |
| $35,000 to $39,999 | 47 (1.7%) | 96 (4.5%) |
| $40,000 to $44,999 | 61 (2.2%) | 29 (1.4%) |
| $45,000 to $49,999 | 0 (0.0%) | 0 (0.0%) |
| $50,000 to $54,999 | 78 (2.8%) | 0 (0.0%) |
| $55,000 to $64,999 | 119 (4.2%) | 0 (0.0%) |
| $65,000 to $74,999 | 29 (1.0%) | 0 (0.0%) |
| $75,000 to $99,999 | 47 (1.7%) | 0 (0.0%) |
| $100,000+ | 0 (0.0%) | 0 (0.0%) |
| Total | 2,814 (100.0%) | 2,108 (100.0%) |
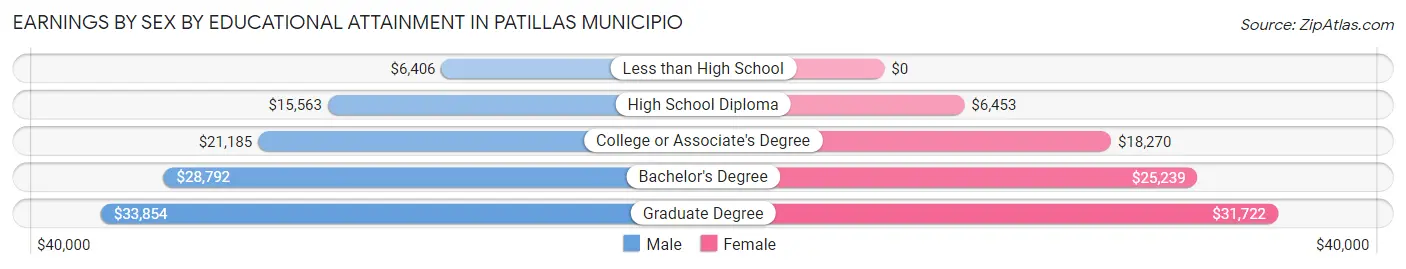
Earnings by Sex by Educational Attainment in Patillas Municipio
Average earnings in Patillas Municipio are $20,327 for men and $18,407 for women, a difference of 9.5%. Men with an educational attainment of graduate degree enjoy the highest average annual earnings of $33,854, while those with less than high school education earn the least with $6,406. Women with an educational attainment of graduate degree earn the most with the average annual earnings of $31,722, while those with high school diploma education have the smallest earnings of $6,453.
| Educational Attainment | Male Income | Female Income |
| Less than High School | $6,406 | $0 |
| High School Diploma | $15,563 | $6,453 |
| College or Associate's Degree | $21,185 | $18,270 |
| Bachelor's Degree | $28,792 | $25,239 |
| Graduate Degree | $33,854 | $31,722 |
| Total | $20,327 | $18,407 |
Family Income in Patillas Municipio
Family Income Brackets in Patillas Municipio
According to the Patillas Municipio family income data, there are 911 families falling into the less than $10,000 income range, which is the most common income bracket and makes up 21.7% of all families.
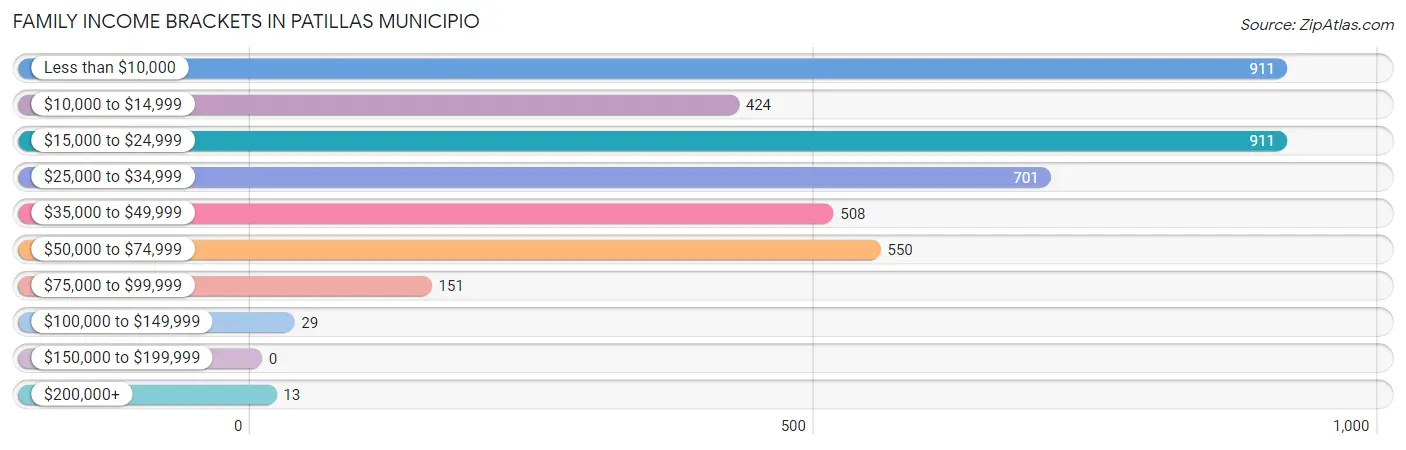
| Income Bracket | # Families | % Families |
| Less than $10,000 | 911 | 21.7% |
| $10,000 to $14,999 | 424 | 10.1% |
| $15,000 to $24,999 | 911 | 21.7% |
| $25,000 to $34,999 | 701 | 16.7% |
| $35,000 to $49,999 | 508 | 12.1% |
| $50,000 to $74,999 | 550 | 13.1% |
| $75,000 to $99,999 | 151 | 3.6% |
| $100,000 to $149,999 | 29 | 0.7% |
| $150,000 to $199,999 | 0 | 0.0% |
| $200,000+ | 13 | 0.3% |
Family Income by Famaliy Size in Patillas Municipio
4-person families (515 | 12.3%) account for the highest median family income in Patillas Municipio with $29,120 per family, while 2-person families (2,375 | 56.6%) have the highest median income of $10,774 per family member.
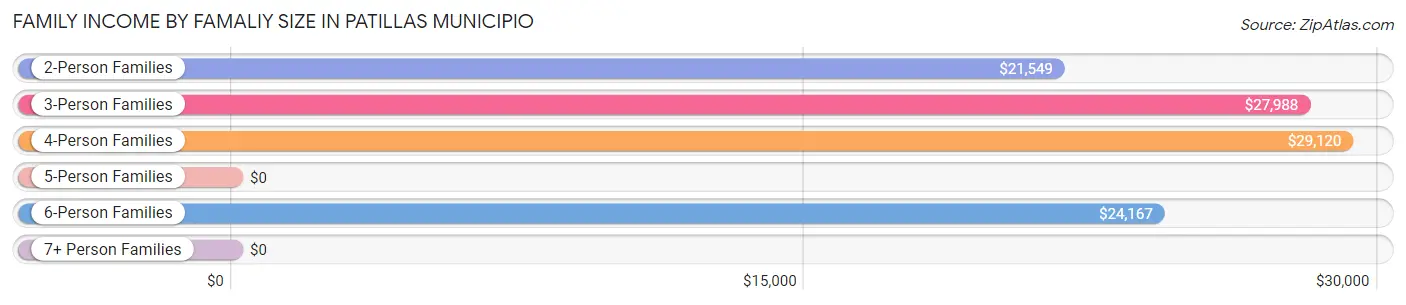
| Income Bracket | # Families | Median Income |
| 2-Person Families | 2,375 (56.6%) | $21,549 |
| 3-Person Families | 1,077 (25.7%) | $27,988 |
| 4-Person Families | 515 (12.3%) | $29,120 |
| 5-Person Families | 131 (3.1%) | $0 |
| 6-Person Families | 56 (1.3%) | $24,167 |
| 7+ Person Families | 44 (1.1%) | $0 |
| Total | 4,198 (100.0%) | $23,811 |
Family Income by Number of Earners in Patillas Municipio
The median family income in Patillas Municipio is $23,811, with families comprising 3+ earners (99) having the highest median family income of $65,625, while families with no earners (1,919) have the lowest median family income of $20,458, accounting for 2.4% and 45.7% of families, respectively.
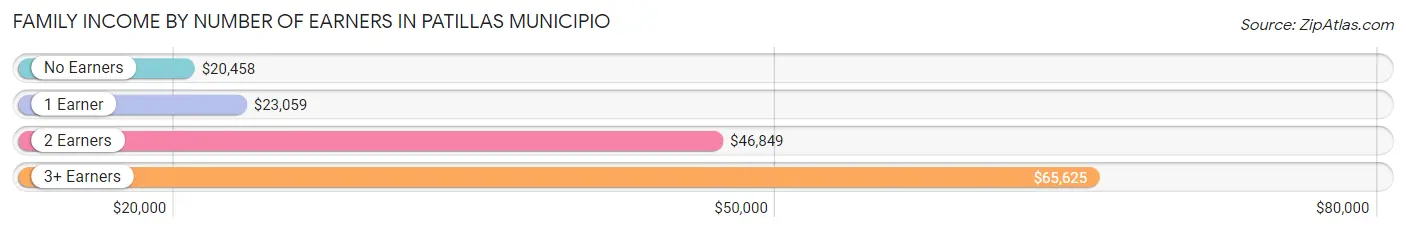
| Number of Earners | # Families | Median Income |
| No Earners | 1,919 (45.7%) | $20,458 |
| 1 Earner | 1,537 (36.6%) | $23,059 |
| 2 Earners | 643 (15.3%) | $46,849 |
| 3+ Earners | 99 (2.4%) | $65,625 |
| Total | 4,198 (100.0%) | $23,811 |
Household Income in Patillas Municipio
Household Income Brackets in Patillas Municipio
With 1,692 households falling in the category, the less than $10,000 income range is the most frequent in Patillas Municipio, accounting for 27.3% of all households.
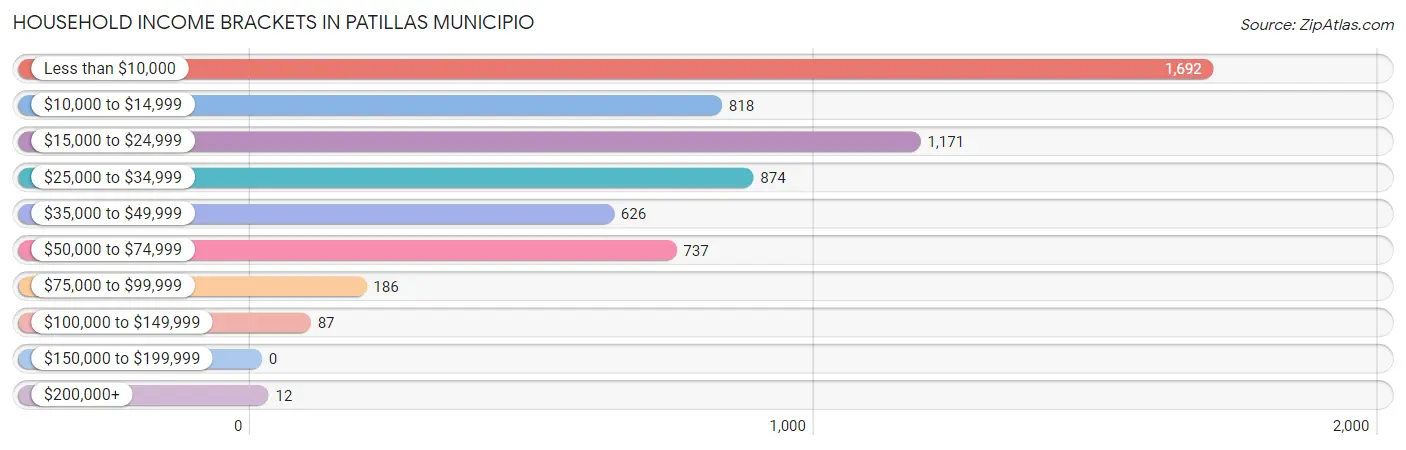
| Income Bracket | # Households | % Households |
| Less than $10,000 | 1,692 | 27.3% |
| $10,000 to $14,999 | 818 | 13.2% |
| $15,000 to $24,999 | 1,171 | 18.9% |
| $25,000 to $34,999 | 874 | 14.1% |
| $35,000 to $49,999 | 626 | 10.1% |
| $50,000 to $74,999 | 737 | 11.9% |
| $75,000 to $99,999 | 186 | 3.0% |
| $100,000 to $149,999 | 87 | 1.4% |
| $150,000 to $199,999 | 0 | 0.0% |
| $200,000+ | 12 | 0.2% |
Household Income by Householder Age in Patillas Municipio
The median household income in Patillas Municipio is $20,778, with the highest median household income of $24,592 found in the 45 to 64 years age bracket for the primary householder. A total of 2,267 households (36.6%) fall into this category. Meanwhile, the 15 to 24 years age bracket for the primary householder has the lowest median household income of $13,170, with 109 households (1.8%) in this group.
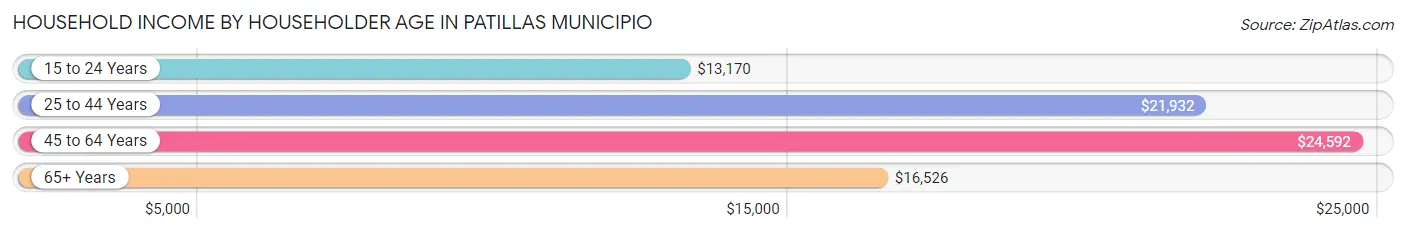
| Income Bracket | # Households | Median Income |
| 15 to 24 Years | 109 (1.8%) | $13,170 |
| 25 to 44 Years | 1,333 (21.5%) | $21,932 |
| 45 to 64 Years | 2,267 (36.6%) | $24,592 |
| 65+ Years | 2,487 (40.1%) | $16,526 |
| Total | 6,196 (100.0%) | $20,778 |
Poverty in Patillas Municipio
Income Below Poverty by Sex and Age in Patillas Municipio
With 46.4% poverty level for males and 50.4% for females among the residents of Patillas Municipio, 15 year old males and under 5 year old females are the most vulnerable to poverty, with 32 males (100.0%) and 219 females (92.4%) in their respective age groups living below the poverty level.
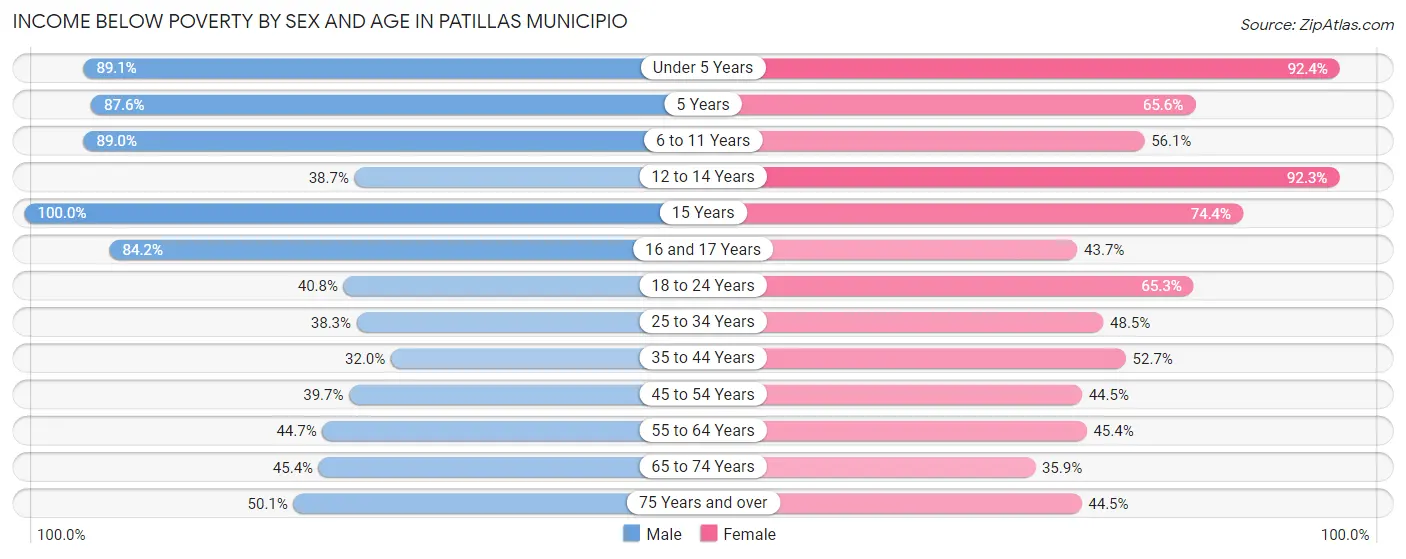
| Age Bracket | Male | Female |
| Under 5 Years | 220 (89.1%) | 219 (92.4%) |
| 5 Years | 78 (87.6%) | 40 (65.6%) |
| 6 to 11 Years | 268 (89.0%) | 270 (56.1%) |
| 12 to 14 Years | 163 (38.7%) | 204 (92.3%) |
| 15 Years | 32 (100.0%) | 134 (74.4%) |
| 16 and 17 Years | 112 (84.2%) | 97 (43.7%) |
| 18 to 24 Years | 273 (40.7%) | 397 (65.3%) |
| 25 to 34 Years | 368 (38.3%) | 452 (48.5%) |
| 35 to 44 Years | 266 (32.0%) | 461 (52.7%) |
| 45 to 54 Years | 403 (39.7%) | 473 (44.5%) |
| 55 to 64 Years | 541 (44.7%) | 580 (45.4%) |
| 65 to 74 Years | 461 (45.4%) | 393 (35.9%) |
| 75 Years and over | 349 (50.1%) | 462 (44.5%) |
| Total | 3,534 (46.4%) | 4,182 (50.4%) |
Income Above Poverty by Sex and Age in Patillas Municipio
According to the poverty statistics in Patillas Municipio, males aged 35 to 44 years and females aged 65 to 74 years are the age groups that are most secure financially, with 68.0% of males and 64.1% of females in these age groups living above the poverty line.
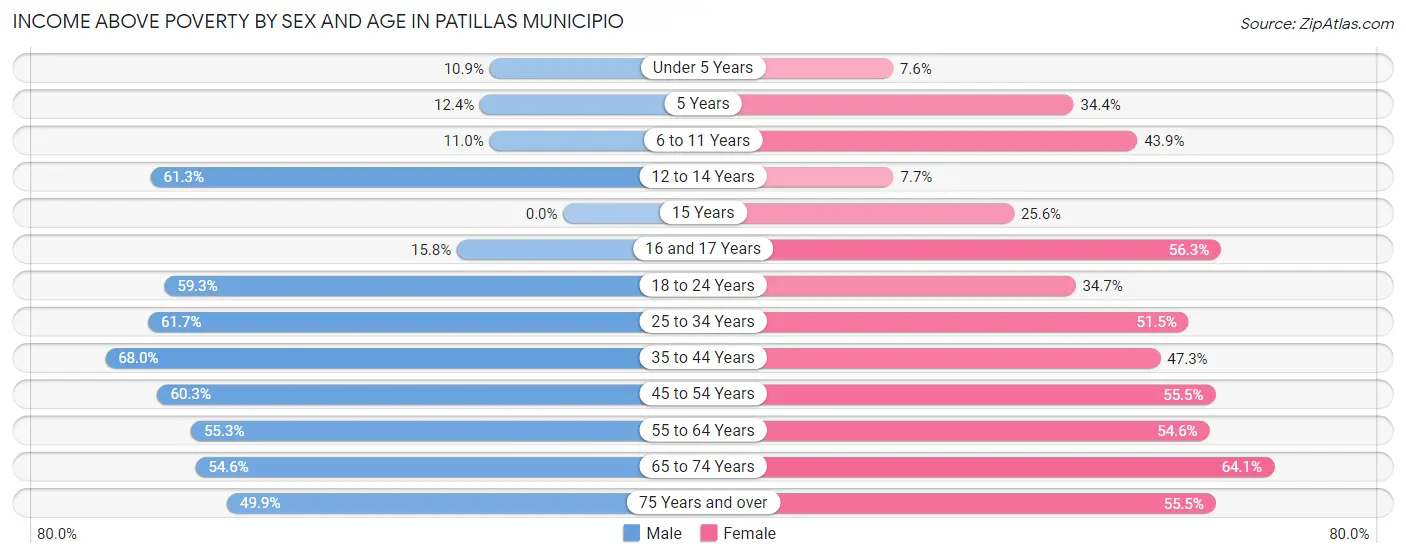
| Age Bracket | Male | Female |
| Under 5 Years | 27 (10.9%) | 18 (7.6%) |
| 5 Years | 11 (12.4%) | 21 (34.4%) |
| 6 to 11 Years | 33 (11.0%) | 211 (43.9%) |
| 12 to 14 Years | 258 (61.3%) | 17 (7.7%) |
| 15 Years | 0 (0.0%) | 46 (25.6%) |
| 16 and 17 Years | 21 (15.8%) | 125 (56.3%) |
| 18 to 24 Years | 397 (59.3%) | 211 (34.7%) |
| 25 to 34 Years | 592 (61.7%) | 480 (51.5%) |
| 35 to 44 Years | 566 (68.0%) | 414 (47.3%) |
| 45 to 54 Years | 611 (60.3%) | 589 (55.5%) |
| 55 to 64 Years | 669 (55.3%) | 697 (54.6%) |
| 65 to 74 Years | 555 (54.6%) | 703 (64.1%) |
| 75 Years and over | 348 (49.9%) | 577 (55.5%) |
| Total | 4,088 (53.6%) | 4,109 (49.6%) |
Income Below Poverty Among Married-Couple Families in Patillas Municipio
The poverty statistics for married-couple families in Patillas Municipio show that 34.2% or 833 of the total 2,433 families live below the poverty line. Families with 3 or 4 children have the highest poverty rate of 100.0%, comprising of 86 families. On the other hand, families with no children have the lowest poverty rate of 28.5%, which includes 509 families.
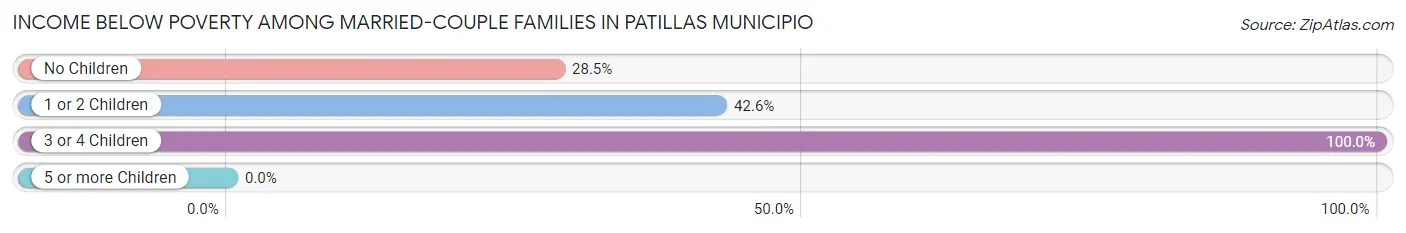
| Children | Above Poverty | Below Poverty |
| No Children | 1,279 (71.5%) | 509 (28.5%) |
| 1 or 2 Children | 321 (57.4%) | 238 (42.6%) |
| 3 or 4 Children | 0 (0.0%) | 86 (100.0%) |
| 5 or more Children | 0 (0.0%) | 0 (0.0%) |
| Total | 1,600 (65.8%) | 833 (34.2%) |
Income Below Poverty Among Single-Parent Households in Patillas Municipio
According to the poverty data in Patillas Municipio, 68.6% or 350 single-father households and 57.8% or 725 single-mother households are living below the poverty line. Among single-father households, those with 3 or 4 children have the highest poverty rate, with 37 households (100.0%) experiencing poverty. Likewise, among single-mother households, those with 3 or 4 children have the highest poverty rate, with 75 households (100.0%) falling below the poverty line.
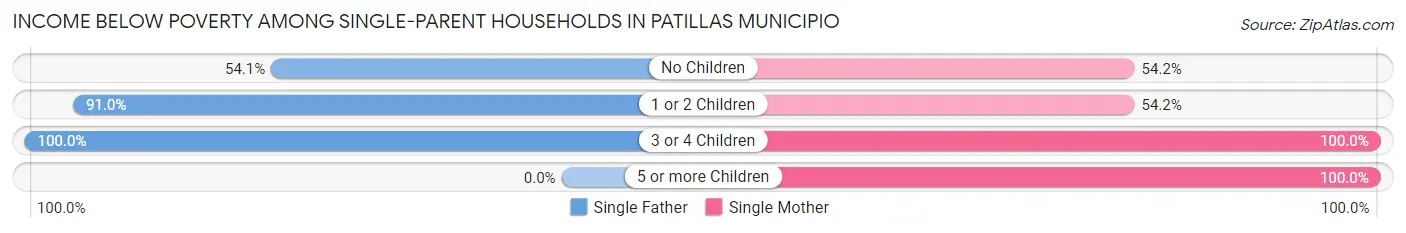
| Children | Single Father | Single Mother |
| No Children | 172 (54.1%) | 342 (54.2%) |
| 1 or 2 Children | 141 (91.0%) | 285 (54.2%) |
| 3 or 4 Children | 37 (100.0%) | 75 (100.0%) |
| 5 or more Children | 0 (0.0%) | 23 (100.0%) |
| Total | 350 (68.6%) | 725 (57.8%) |
Income Below Poverty Among Married-Couple vs Single-Parent Households in Patillas Municipio
The poverty data for Patillas Municipio shows that 833 of the married-couple family households (34.2%) and 1,075 of the single-parent households (60.9%) are living below the poverty level. Within the married-couple family households, those with 3 or 4 children have the highest poverty rate, with 86 households (100.0%) falling below the poverty line. Among the single-parent households, those with 3 or 4 children have the highest poverty rate, with 112 household (100.0%) living below poverty.
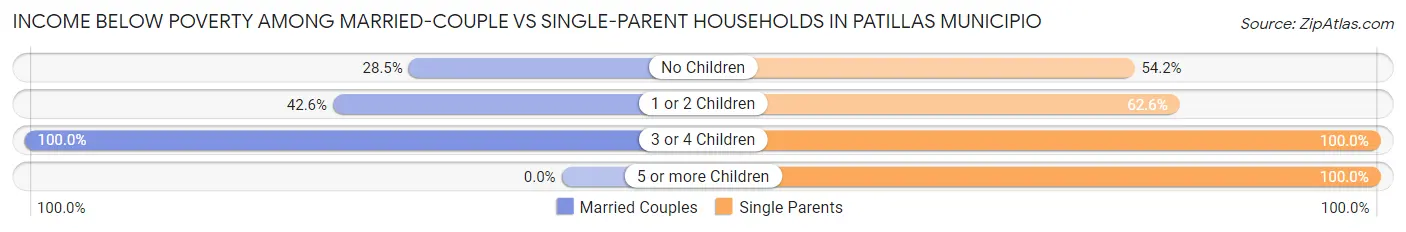
| Children | Married-Couple Families | Single-Parent Households |
| No Children | 509 (28.5%) | 514 (54.2%) |
| 1 or 2 Children | 238 (42.6%) | 426 (62.6%) |
| 3 or 4 Children | 86 (100.0%) | 112 (100.0%) |
| 5 or more Children | 0 (0.0%) | 23 (100.0%) |
| Total | 833 (34.2%) | 1,075 (60.9%) |
Race in Patillas Municipio
The most populous races in Patillas Municipio are Hispanic or Latino (15,927 | 100.0%), Some other Race (8,620 | 54.1%), and Black / African American (5,614 | 35.2%).
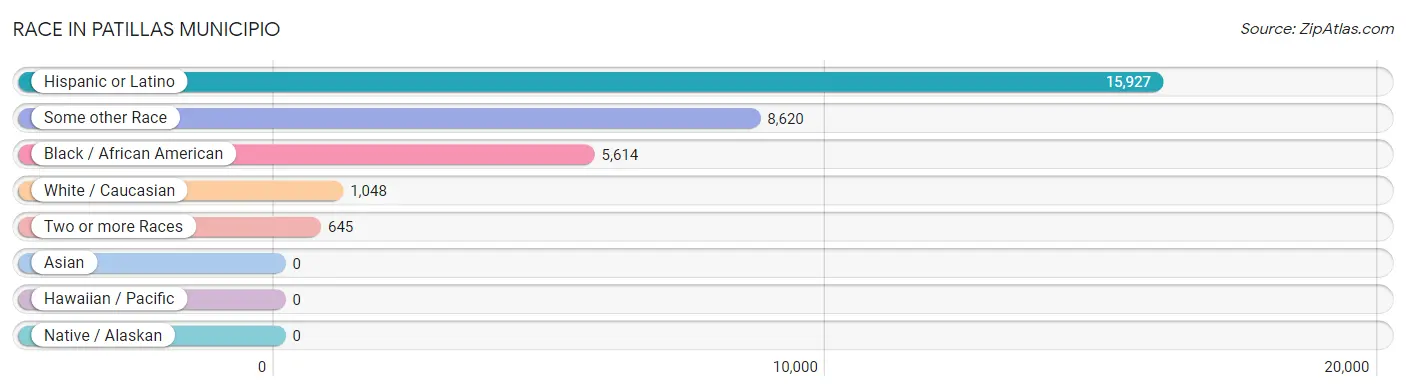
| Race | # Population | % Population |
| Asian | 0 | 0.0% |
| Black / African American | 5,614 | 35.2% |
| Hawaiian / Pacific | 0 | 0.0% |
| Hispanic or Latino | 15,927 | 100.0% |
| Native / Alaskan | 0 | 0.0% |
| White / Caucasian | 1,048 | 6.6% |
| Two or more Races | 645 | 4.1% |
| Some other Race | 8,620 | 54.1% |
| Total | 15,927 | 100.0% |
Ancestry in Patillas Municipio
The most populous ancestries reported in Patillas Municipio are Puerto Rican (15,775 | 99.1%), Mexican (58 | 0.4%), Cuban (35 | 0.2%), Dominican (32 | 0.2%), and American (21 | 0.1%), together accounting for 100.0% of all Patillas Municipio residents.
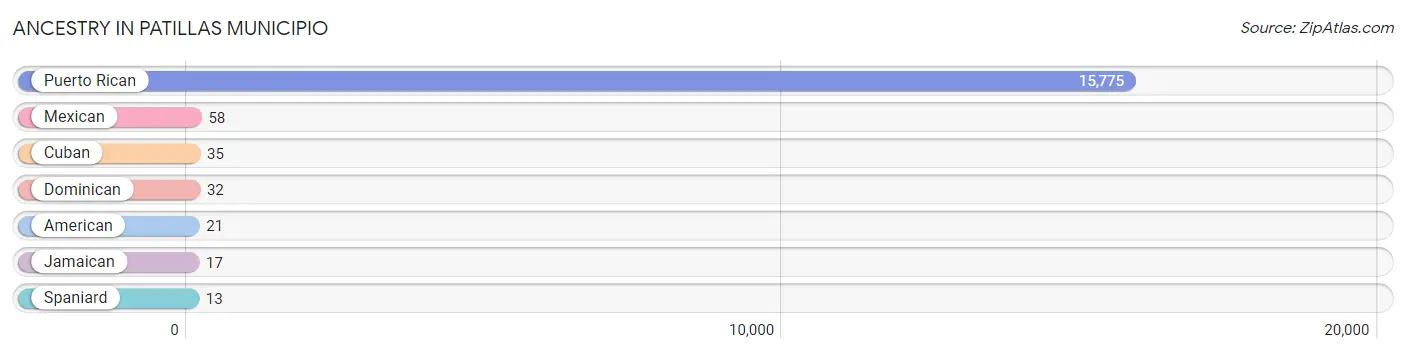
| Ancestry | # Population | % Population |
| American | 21 | 0.1% |
| Cuban | 35 | 0.2% |
| Dominican | 32 | 0.2% |
| Jamaican | 17 | 0.1% |
| Mexican | 58 | 0.4% |
| Puerto Rican | 15,775 | 99.1% |
| Spaniard | 13 | 0.1% | View All 7 Rows |
Immigrants in Patillas Municipio

| Immigration Origin | # Population | % Population | View All 0 Rows |
Sex and Age in Patillas Municipio
Sex and Age in Patillas Municipio
The most populous age groups in Patillas Municipio are 60 to 64 Years (618 | 8.1%) for men and 55 to 59 Years (663 | 8.0%) for women.
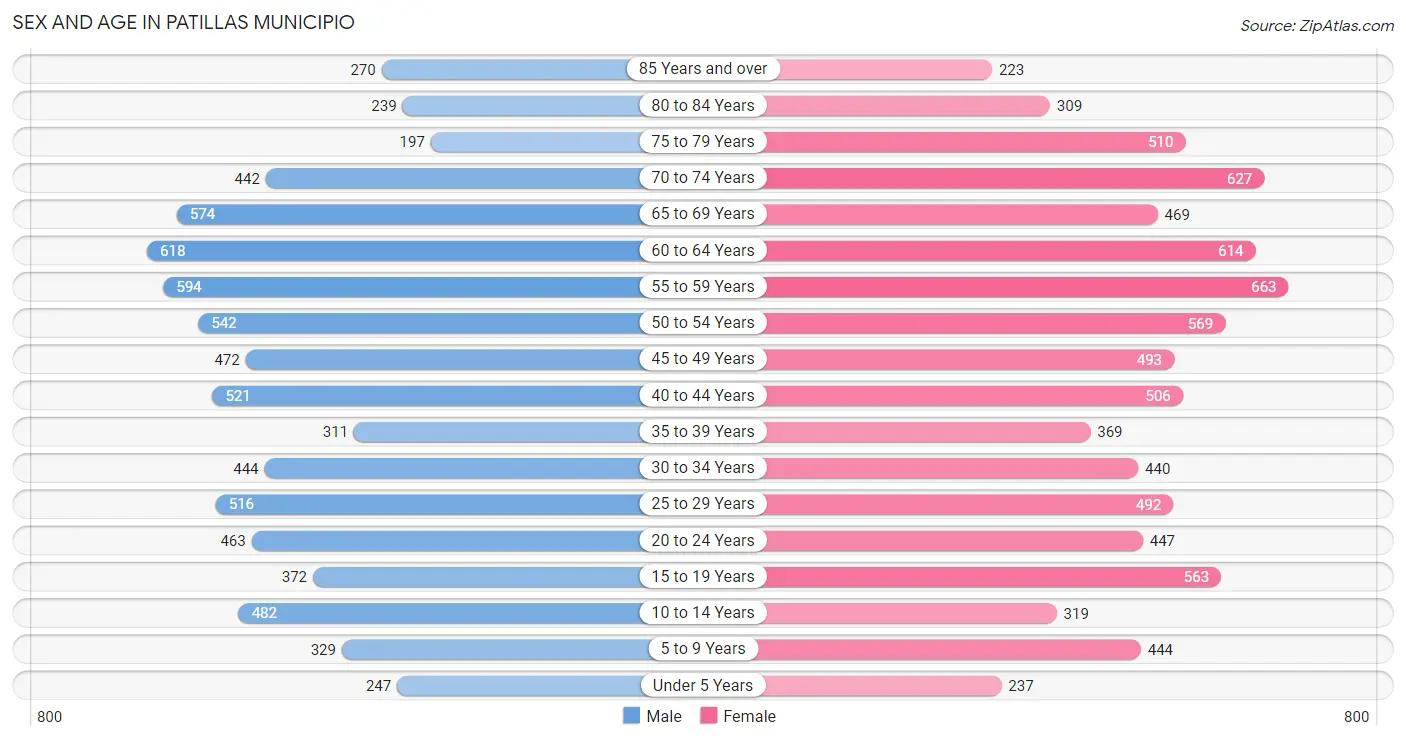
| Age Bracket | Male | Female |
| Under 5 Years | 247 (3.2%) | 237 (2.9%) |
| 5 to 9 Years | 329 (4.3%) | 444 (5.3%) |
| 10 to 14 Years | 482 (6.3%) | 319 (3.8%) |
| 15 to 19 Years | 372 (4.9%) | 563 (6.8%) |
| 20 to 24 Years | 463 (6.1%) | 447 (5.4%) |
| 25 to 29 Years | 516 (6.8%) | 492 (5.9%) |
| 30 to 34 Years | 444 (5.8%) | 440 (5.3%) |
| 35 to 39 Years | 311 (4.1%) | 369 (4.4%) |
| 40 to 44 Years | 521 (6.8%) | 506 (6.1%) |
| 45 to 49 Years | 472 (6.2%) | 493 (5.9%) |
| 50 to 54 Years | 542 (7.1%) | 569 (6.9%) |
| 55 to 59 Years | 594 (7.8%) | 663 (8.0%) |
| 60 to 64 Years | 618 (8.1%) | 614 (7.4%) |
| 65 to 69 Years | 574 (7.5%) | 469 (5.7%) |
| 70 to 74 Years | 442 (5.8%) | 627 (7.6%) |
| 75 to 79 Years | 197 (2.6%) | 510 (6.1%) |
| 80 to 84 Years | 239 (3.1%) | 309 (3.7%) |
| 85 Years and over | 270 (3.5%) | 223 (2.7%) |
| Total | 7,633 (100.0%) | 8,294 (100.0%) |
Families and Households in Patillas Municipio
Median Family Size in Patillas Municipio
The median family size in Patillas Municipio is 3.16 persons per family, with single female/mother families (1,255 | 29.9%) accounting for the largest median family size of 3.44 persons per family. On the other hand, single male/father families (510 | 12.1%) represent the smallest median family size with 2.93 persons per family.
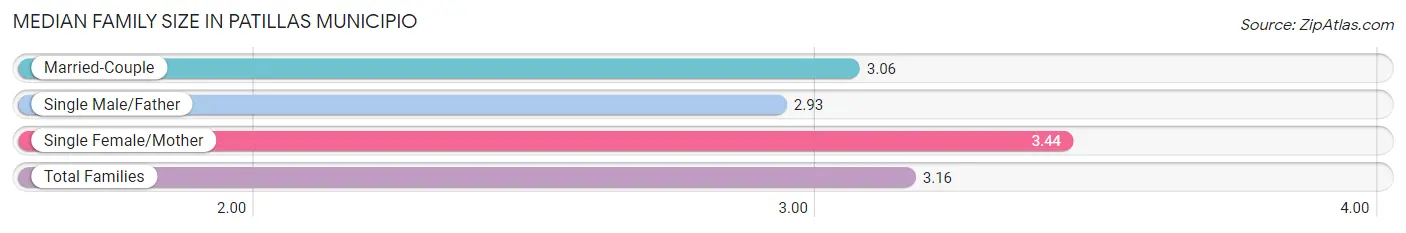
| Family Type | # Families | Family Size |
| Married-Couple | 2,433 (58.0%) | 3.06 |
| Single Male/Father | 510 (12.1%) | 2.93 |
| Single Female/Mother | 1,255 (29.9%) | 3.44 |
| Total Families | 4,198 (100.0%) | 3.16 |
Median Household Size in Patillas Municipio
The median household size in Patillas Municipio is 2.57 persons per household, with single female/mother households (1,255 | 20.3%) accounting for the largest median household size of 3.57 persons per household. non-family households (1,998 | 32.3%) represent the smallest median household size with 1.16 persons per household.
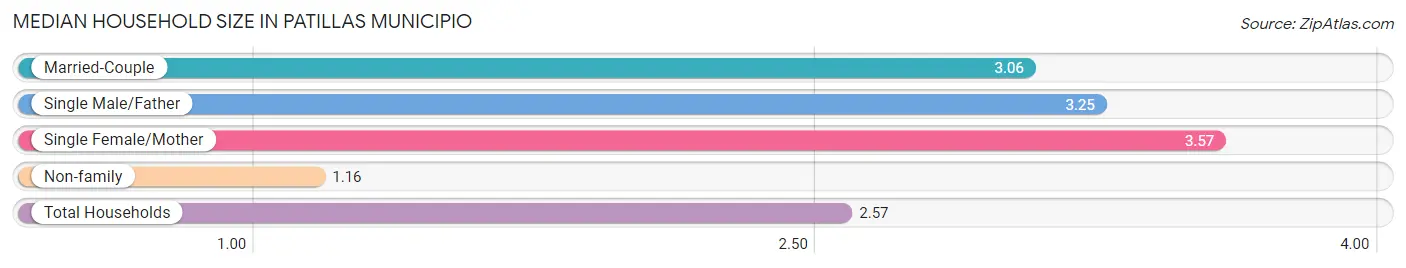
| Household Type | # Households | Household Size |
| Married-Couple | 2,433 (39.3%) | 3.06 |
| Single Male/Father | 510 (8.2%) | 3.25 |
| Single Female/Mother | 1,255 (20.3%) | 3.57 |
| Non-family | 1,998 (32.3%) | 1.16 |
| Total Households | 6,196 (100.0%) | 2.57 |
Household Size by Marriage Status in Patillas Municipio
Out of a total of 6,196 households in Patillas Municipio, 4,198 (67.7%) are family households, while 1,998 (32.3%) are nonfamily households. The most numerous type of family households are 2-person households, comprising 2,217, and the most common type of nonfamily households are 1-person households, comprising 1,699.
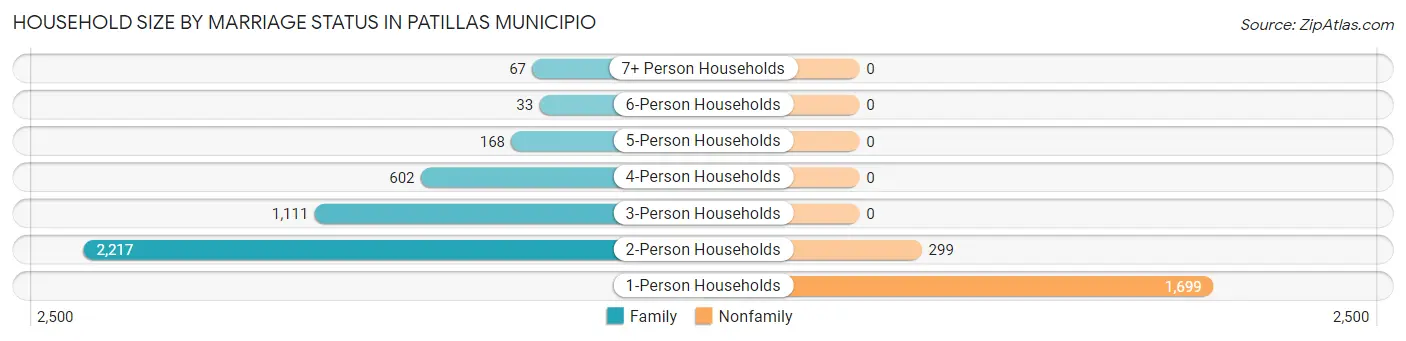
| Household Size | Family Households | Nonfamily Households |
| 1-Person Households | - | 1,699 (27.4%) |
| 2-Person Households | 2,217 (35.8%) | 299 (4.8%) |
| 3-Person Households | 1,111 (17.9%) | 0 (0.0%) |
| 4-Person Households | 602 (9.7%) | 0 (0.0%) |
| 5-Person Households | 168 (2.7%) | 0 (0.0%) |
| 6-Person Households | 33 (0.5%) | 0 (0.0%) |
| 7+ Person Households | 67 (1.1%) | 0 (0.0%) |
| Total | 4,198 (67.7%) | 1,998 (32.3%) |
Female Fertility in Patillas Municipio
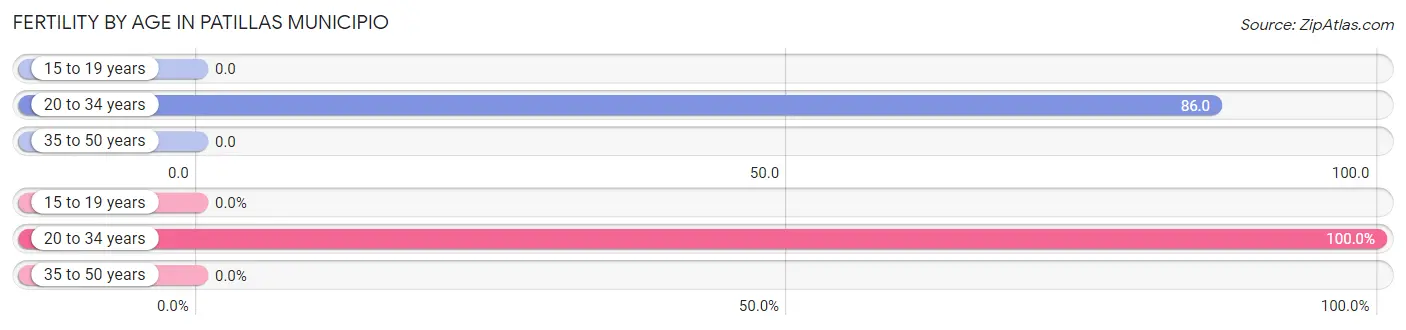
Fertility by Age in Patillas Municipio
Average fertility rate in Patillas Municipio is 34.0 births per 1,000 women. Women in the age bracket of 20 to 34 years have the highest fertility rate with 86.0 births per 1,000 women. Women in the age bracket of 20 to 34 years acount for 100.0% of all women with births.
| Age Bracket | Women with Births | Births / 1,000 Women |
| 15 to 19 years | 0 (0.0%) | 0.0 |
| 20 to 34 years | 118 (100.0%) | 86.0 |
| 35 to 50 years | 0 (0.0%) | 0.0 |
| Total | 118 (100.0%) | 34.0 |
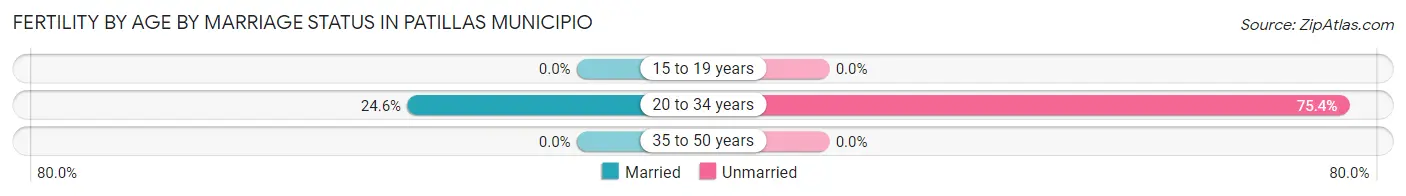
Fertility by Age by Marriage Status in Patillas Municipio
24.6% of women with births (118) in Patillas Municipio are married. The highest percentage of unmarried women with births falls into 20 to 34 years age bracket with 75.4% of them unmarried at the time of birth, while the lowest percentage of unmarried women with births belong to 20 to 34 years age bracket with 75.4% of them unmarried.
| Age Bracket | Married | Unmarried |
| 15 to 19 years | 0 (0.0%) | 0 (0.0%) |
| 20 to 34 years | 29 (24.6%) | 89 (75.4%) |
| 35 to 50 years | 0 (0.0%) | 0 (0.0%) |
| Total | 29 (24.6%) | 89 (75.4%) |
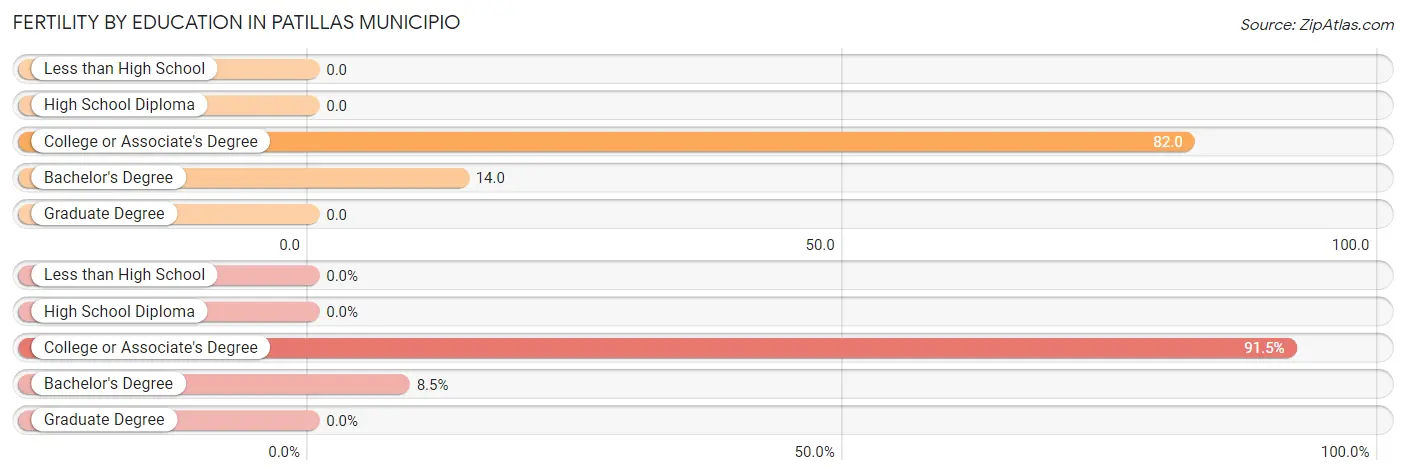
Fertility by Education in Patillas Municipio
| Educational Attainment | Women with Births | Births / 1,000 Women |
| Less than High School | 0 (0.0%) | 0.0 |
| High School Diploma | 0 (0.0%) | 0.0 |
| College or Associate's Degree | 108 (91.5%) | 82.0 |
| Bachelor's Degree | 10 (8.5%) | 14.0 |
| Graduate Degree | 0 (0.0%) | 0.0 |
| Total | 118 (100.0%) | 34.0 |
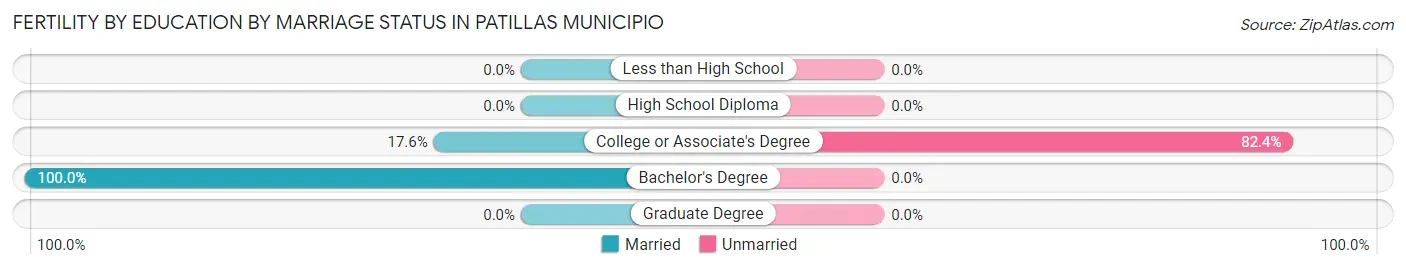
Fertility by Education by Marriage Status in Patillas Municipio
75.4% of women with births in Patillas Municipio are unmarried. Women with the educational attainment of bachelor's degree are most likely to be married with 100.0% of them married at childbirth, while women with the educational attainment of college or associate's degree are least likely to be married with 82.4% of them unmarried at childbirth.
| Educational Attainment | Married | Unmarried |
| Less than High School | 0 (0.0%) | 0 (0.0%) |
| High School Diploma | 0 (0.0%) | 0 (0.0%) |
| College or Associate's Degree | 19 (17.6%) | 89 (82.4%) |
| Bachelor's Degree | 10 (100.0%) | 0 (0.0%) |
| Graduate Degree | 0 (0.0%) | 0 (0.0%) |
| Total | 29 (24.6%) | 89 (75.4%) |
Employment Characteristics in Patillas Municipio
Employment by Class of Employer in Patillas Municipio
Among the 3,887 employed individuals in Patillas Municipio, private company employees (2,321 | 59.7%), self-employed (not incorporated) (839 | 21.6%), and state government employees (402 | 10.3%) make up the most common classes of employment.
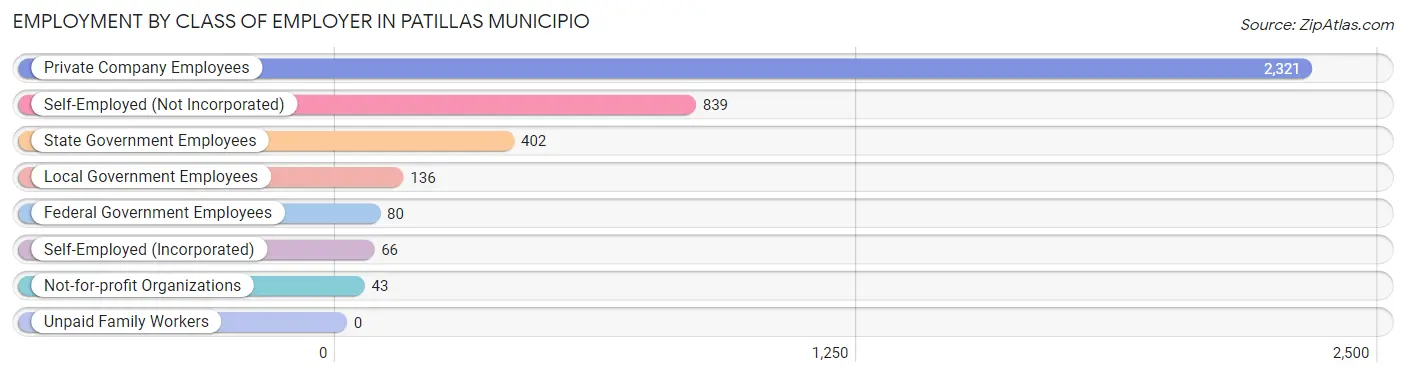
| Employer Class | # Employees | % Employees |
| Private Company Employees | 2,321 | 59.7% |
| Self-Employed (Incorporated) | 66 | 1.7% |
| Self-Employed (Not Incorporated) | 839 | 21.6% |
| Not-for-profit Organizations | 43 | 1.1% |
| Local Government Employees | 136 | 3.5% |
| State Government Employees | 402 | 10.3% |
| Federal Government Employees | 80 | 2.1% |
| Unpaid Family Workers | 0 | 0.0% |
| Total | 3,887 | 100.0% |
Employment Status by Age in Patillas Municipio
According to the labor force statistics for Patillas Municipio, out of the total population over 16 years of age (13,657), 36.5% or 4,985 individuals are in the labor force, with 13.0% or 648 of them unemployed. The age group with the highest labor force participation rate is 30 to 34 years, with 86.9% or 768 individuals in the labor force. Within the labor force, the 16 to 19 years age range has the highest percentage of unemployed individuals, with 100.0% or 39 of them being unemployed.
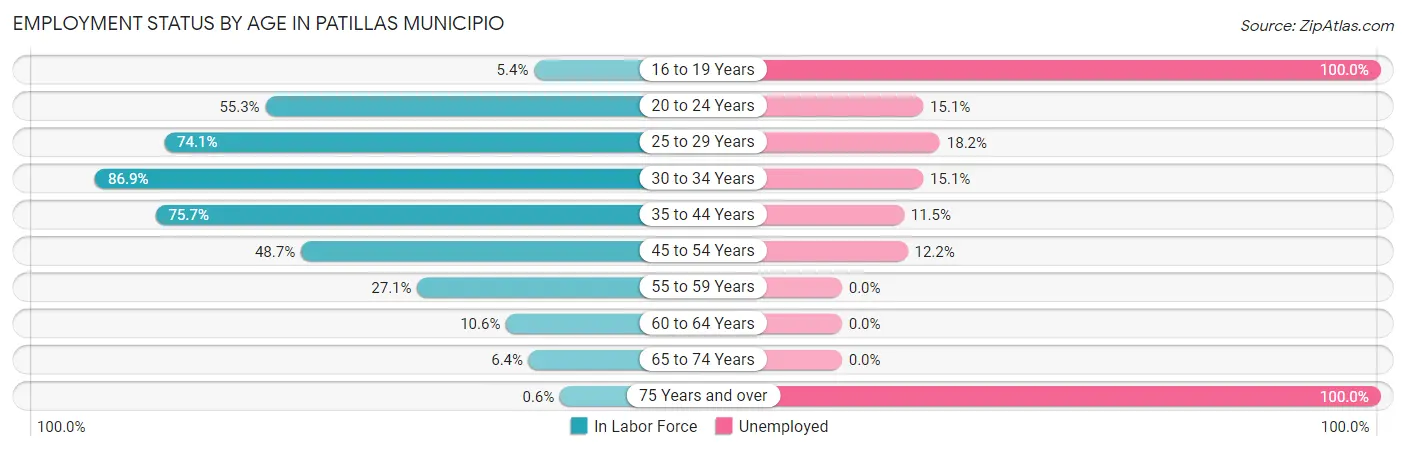
| Age Bracket | In Labor Force | Unemployed |
| 16 to 19 Years | 39 (5.4%) | 39 (100.0%) |
| 20 to 24 Years | 503 (55.3%) | 76 (15.1%) |
| 25 to 29 Years | 747 (74.1%) | 136 (18.2%) |
| 30 to 34 Years | 768 (86.9%) | 116 (15.1%) |
| 35 to 44 Years | 1,292 (75.7%) | 149 (11.5%) |
| 45 to 54 Years | 1,011 (48.7%) | 123 (12.2%) |
| 55 to 59 Years | 341 (27.1%) | 0 (0.0%) |
| 60 to 64 Years | 131 (10.6%) | 0 (0.0%) |
| 65 to 74 Years | 135 (6.4%) | 0 (0.0%) |
| 75 Years and over | 10 (0.6%) | 10 (100.0%) |
| Total | 4,985 (36.5%) | 648 (13.0%) |
Employment Status by Educational Attainment in Patillas Municipio
According to labor force statistics for Patillas Municipio, 52.6% of individuals (4,294) out of the total population between 25 and 64 years of age (8,164) are in the labor force, with 12.2% or 524 of them being unemployed. The group with the highest labor force participation rate are those with the educational attainment of bachelor's degree or higher, with 69.8% or 1,229 individuals in the labor force. Within the labor force, individuals with less than high school education have the highest percentage of unemployment, with 24.1% or 84 of them being unemployed.
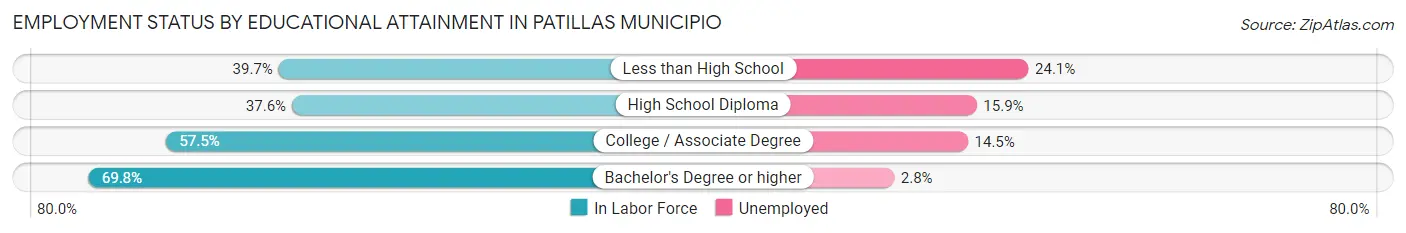
| Educational Attainment | In Labor Force | Unemployed |
| Less than High School | 349 (39.7%) | 212 (24.1%) |
| High School Diploma | 873 (37.6%) | 369 (15.9%) |
| College / Associate Degree | 1,841 (57.5%) | 464 (14.5%) |
| Bachelor's Degree or higher | 1,229 (69.8%) | 49 (2.8%) |
| Total | 4,294 (52.6%) | 996 (12.2%) |
Employment Occupations by Sex in Patillas Municipio
Management, Business, Science and Arts Occupations
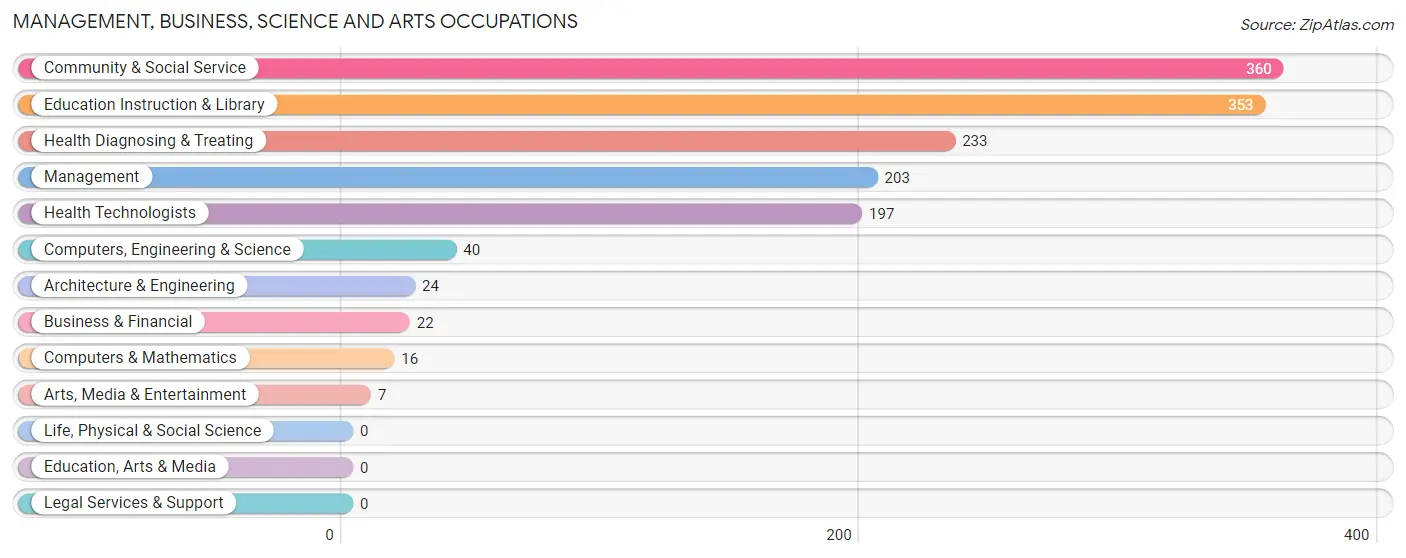
The most common Management, Business, Science and Arts occupations in Patillas Municipio are Community & Social Service (360 | 8.3%), Education Instruction & Library (353 | 8.2%), Health Diagnosing & Treating (233 | 5.4%), Management (203 | 4.7%), and Health Technologists (197 | 4.6%).
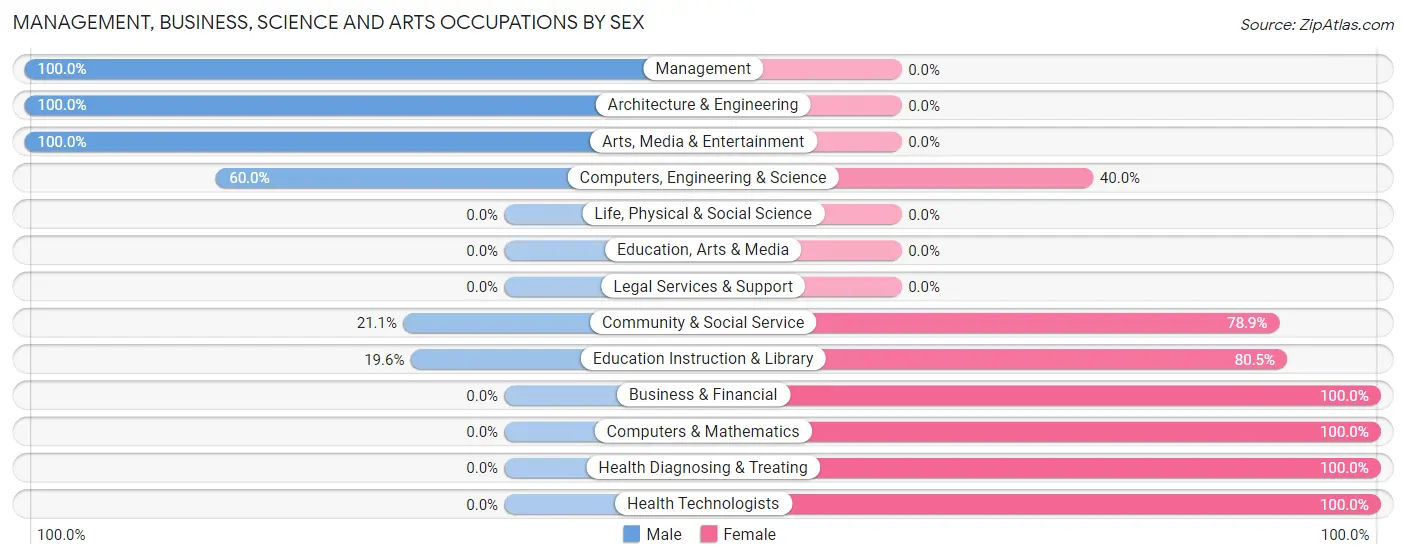
Management, Business, Science and Arts Occupations by Sex
Within the Management, Business, Science and Arts occupations in Patillas Municipio, the most male-oriented occupations are Management (100.0%), Architecture & Engineering (100.0%), and Arts, Media & Entertainment (100.0%), while the most female-oriented occupations are Business & Financial (100.0%), Computers & Mathematics (100.0%), and Health Diagnosing & Treating (100.0%).
| Occupation | Male | Female |
| Management | 203 (100.0%) | 0 (0.0%) |
| Business & Financial | 0 (0.0%) | 22 (100.0%) |
| Computers, Engineering & Science | 24 (60.0%) | 16 (40.0%) |
| Computers & Mathematics | 0 (0.0%) | 16 (100.0%) |
| Architecture & Engineering | 24 (100.0%) | 0 (0.0%) |
| Life, Physical & Social Science | 0 (0.0%) | 0 (0.0%) |
| Community & Social Service | 76 (21.1%) | 284 (78.9%) |
| Education, Arts & Media | 0 (0.0%) | 0 (0.0%) |
| Legal Services & Support | 0 (0.0%) | 0 (0.0%) |
| Education Instruction & Library | 69 (19.6%) | 284 (80.4%) |
| Arts, Media & Entertainment | 7 (100.0%) | 0 (0.0%) |
| Health Diagnosing & Treating | 0 (0.0%) | 233 (100.0%) |
| Health Technologists | 0 (0.0%) | 197 (100.0%) |
| Total (Category) | 303 (35.3%) | 555 (64.7%) |
| Total (Overall) | 2,525 (58.5%) | 1,789 (41.5%) |
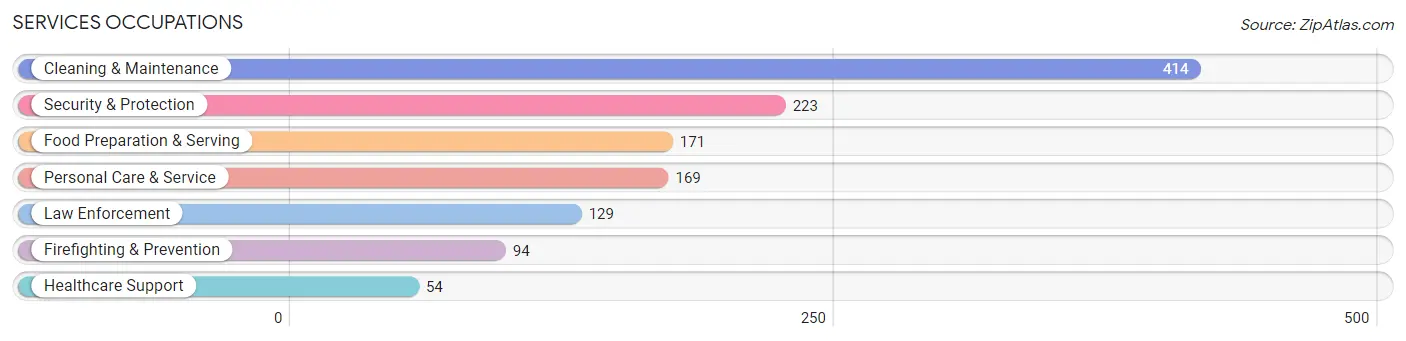
Services Occupations
The most common Services occupations in Patillas Municipio are Cleaning & Maintenance (414 | 9.6%), Security & Protection (223 | 5.2%), Food Preparation & Serving (171 | 4.0%), Personal Care & Service (169 | 3.9%), and Law Enforcement (129 | 3.0%).
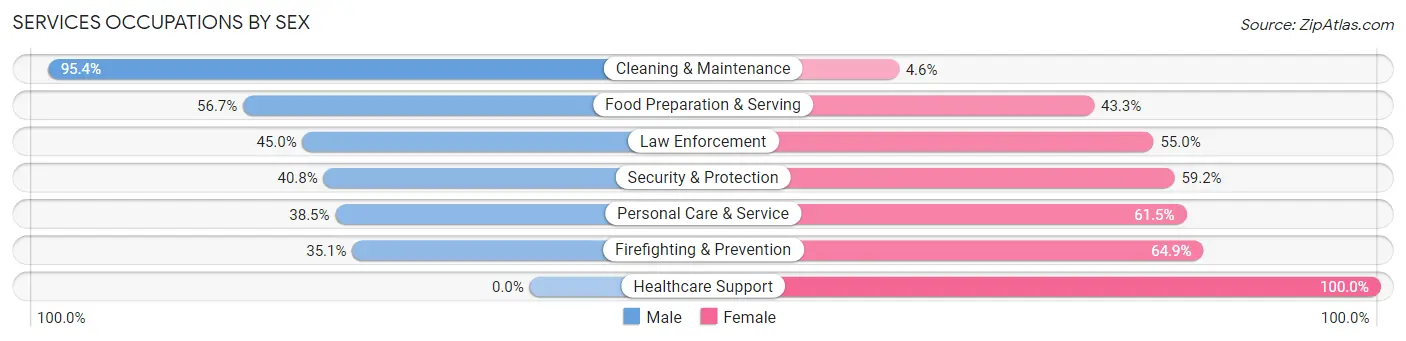
Services Occupations by Sex
Within the Services occupations in Patillas Municipio, the most male-oriented occupations are Cleaning & Maintenance (95.4%), Food Preparation & Serving (56.7%), and Law Enforcement (45.0%), while the most female-oriented occupations are Healthcare Support (100.0%), Firefighting & Prevention (64.9%), and Personal Care & Service (61.5%).
| Occupation | Male | Female |
| Healthcare Support | 0 (0.0%) | 54 (100.0%) |
| Security & Protection | 91 (40.8%) | 132 (59.2%) |
| Firefighting & Prevention | 33 (35.1%) | 61 (64.9%) |
| Law Enforcement | 58 (45.0%) | 71 (55.0%) |
| Food Preparation & Serving | 97 (56.7%) | 74 (43.3%) |
| Cleaning & Maintenance | 395 (95.4%) | 19 (4.6%) |
| Personal Care & Service | 65 (38.5%) | 104 (61.5%) |
| Total (Category) | 648 (62.8%) | 383 (37.1%) |
| Total (Overall) | 2,525 (58.5%) | 1,789 (41.5%) |
Sales and Office Occupations
The most common Sales and Office occupations in Patillas Municipio are Sales & Related (663 | 15.4%), and Office & Administration (356 | 8.3%).

Sales and Office Occupations by Sex

| Occupation | Male | Female |
| Sales & Related | 330 (49.8%) | 333 (50.2%) |
| Office & Administration | 137 (38.5%) | 219 (61.5%) |
| Total (Category) | 467 (45.8%) | 552 (54.2%) |
| Total (Overall) | 2,525 (58.5%) | 1,789 (41.5%) |
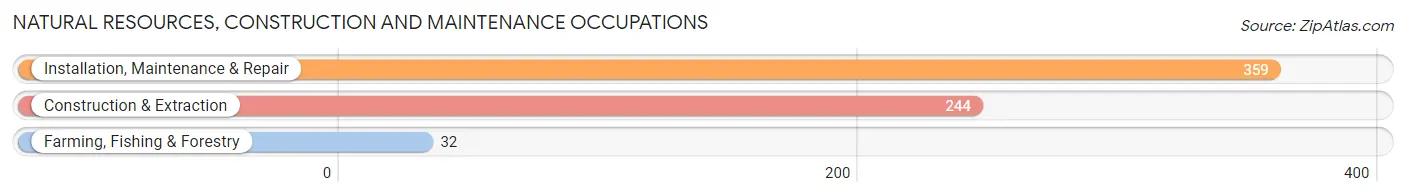
Natural Resources, Construction and Maintenance Occupations
The most common Natural Resources, Construction and Maintenance occupations in Patillas Municipio are Installation, Maintenance & Repair (359 | 8.3%), Construction & Extraction (244 | 5.7%), and Farming, Fishing & Forestry (32 | 0.7%).
Natural Resources, Construction and Maintenance Occupations by Sex

| Occupation | Male | Female |
| Farming, Fishing & Forestry | 32 (100.0%) | 0 (0.0%) |
| Construction & Extraction | 229 (93.9%) | 15 (6.1%) |
| Installation, Maintenance & Repair | 359 (100.0%) | 0 (0.0%) |
| Total (Category) | 620 (97.6%) | 15 (2.4%) |
| Total (Overall) | 2,525 (58.5%) | 1,789 (41.5%) |
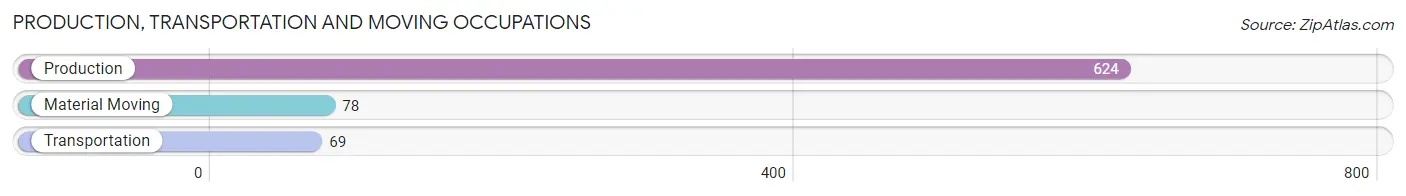
Production, Transportation and Moving Occupations
The most common Production, Transportation and Moving occupations in Patillas Municipio are Production (624 | 14.5%), Material Moving (78 | 1.8%), and Transportation (69 | 1.6%).
Production, Transportation and Moving Occupations by Sex

| Occupation | Male | Female |
| Production | 374 (59.9%) | 250 (40.1%) |
| Transportation | 69 (100.0%) | 0 (0.0%) |
| Material Moving | 44 (56.4%) | 34 (43.6%) |
| Total (Category) | 487 (63.2%) | 284 (36.8%) |
| Total (Overall) | 2,525 (58.5%) | 1,789 (41.5%) |
Employment Industries by Sex in Patillas Municipio
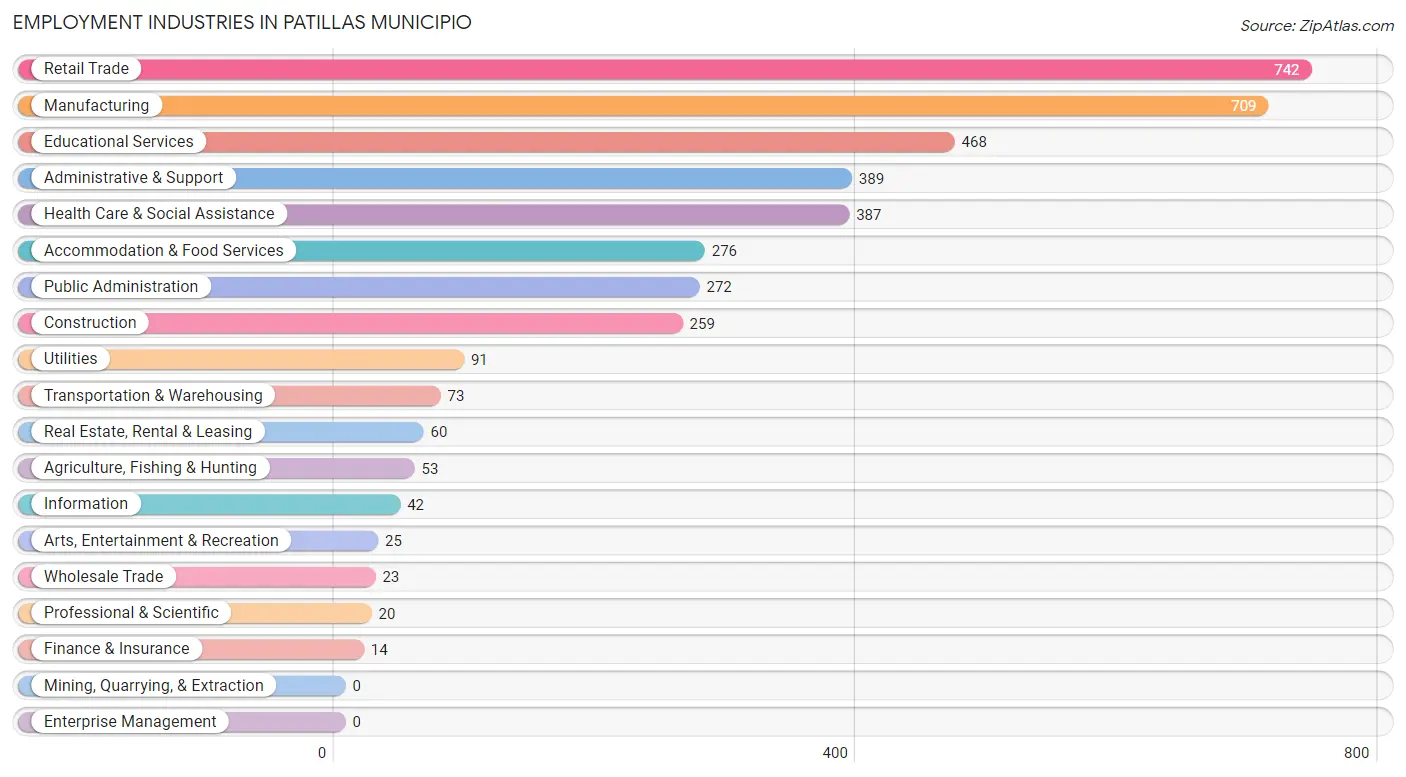
Employment Industries in Patillas Municipio
The major employment industries in Patillas Municipio include Retail Trade (742 | 17.2%), Manufacturing (709 | 16.4%), Educational Services (468 | 10.8%), Administrative & Support (389 | 9.0%), and Health Care & Social Assistance (387 | 9.0%).
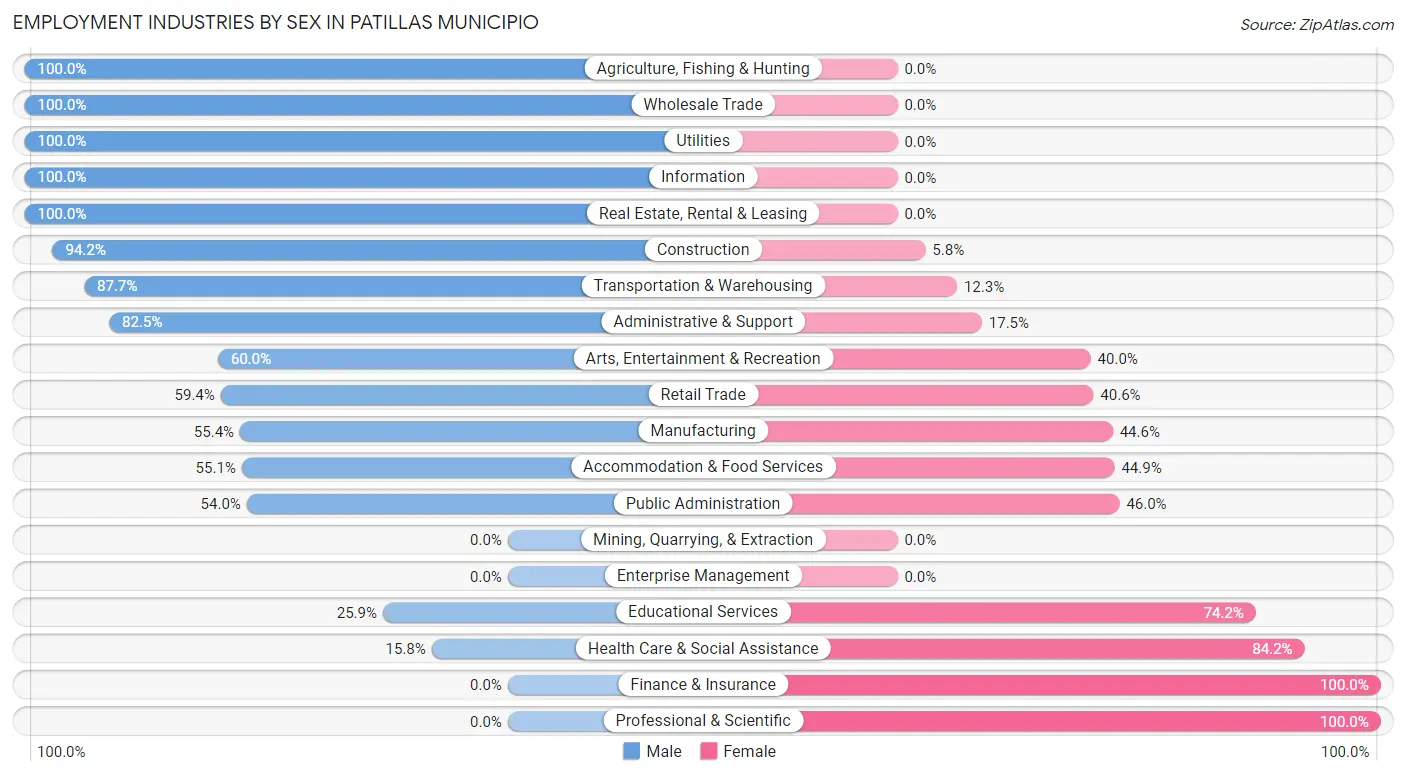
Employment Industries by Sex in Patillas Municipio
The Patillas Municipio industries that see more men than women are Agriculture, Fishing & Hunting (100.0%), Wholesale Trade (100.0%), and Utilities (100.0%), whereas the industries that tend to have a higher number of women are Finance & Insurance (100.0%), Professional & Scientific (100.0%), and Health Care & Social Assistance (84.2%).
| Industry | Male | Female |
| Agriculture, Fishing & Hunting | 53 (100.0%) | 0 (0.0%) |
| Mining, Quarrying, & Extraction | 0 (0.0%) | 0 (0.0%) |
| Construction | 244 (94.2%) | 15 (5.8%) |
| Manufacturing | 393 (55.4%) | 316 (44.6%) |
| Wholesale Trade | 23 (100.0%) | 0 (0.0%) |
| Retail Trade | 441 (59.4%) | 301 (40.6%) |
| Transportation & Warehousing | 64 (87.7%) | 9 (12.3%) |
| Utilities | 91 (100.0%) | 0 (0.0%) |
| Information | 42 (100.0%) | 0 (0.0%) |
| Finance & Insurance | 0 (0.0%) | 14 (100.0%) |
| Real Estate, Rental & Leasing | 60 (100.0%) | 0 (0.0%) |
| Professional & Scientific | 0 (0.0%) | 20 (100.0%) |
| Enterprise Management | 0 (0.0%) | 0 (0.0%) |
| Administrative & Support | 321 (82.5%) | 68 (17.5%) |
| Educational Services | 121 (25.9%) | 347 (74.2%) |
| Health Care & Social Assistance | 61 (15.8%) | 326 (84.2%) |
| Arts, Entertainment & Recreation | 15 (60.0%) | 10 (40.0%) |
| Accommodation & Food Services | 152 (55.1%) | 124 (44.9%) |
| Public Administration | 147 (54.0%) | 125 (46.0%) |
| Total | 2,525 (58.5%) | 1,789 (41.5%) |
Education in Patillas Municipio
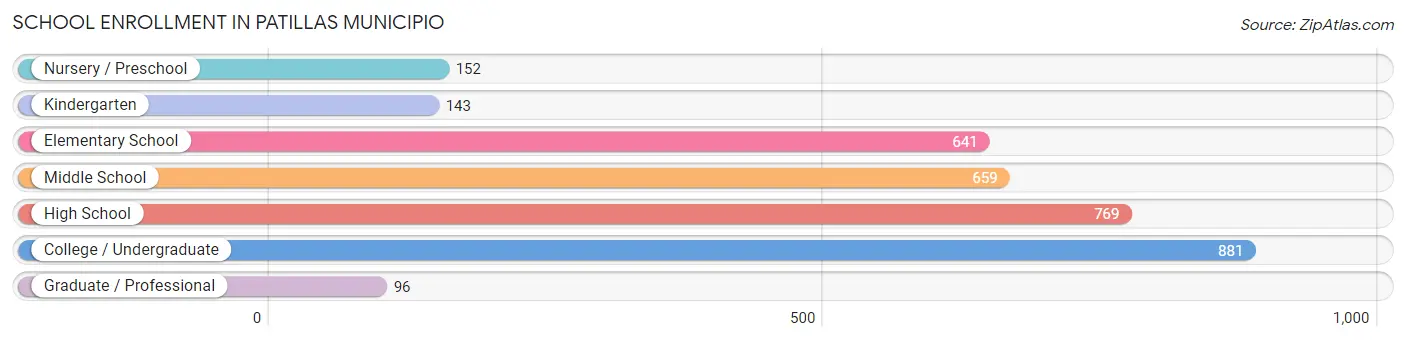
School Enrollment in Patillas Municipio
The most common levels of schooling among the 3,341 students in Patillas Municipio are college / undergraduate (881 | 26.4%), high school (769 | 23.0%), and middle school (659 | 19.7%).
| School Level | # Students | % Students |
| Nursery / Preschool | 152 | 4.5% |
| Kindergarten | 143 | 4.3% |
| Elementary School | 641 | 19.2% |
| Middle School | 659 | 19.7% |
| High School | 769 | 23.0% |
| College / Undergraduate | 881 | 26.4% |
| Graduate / Professional | 96 | 2.9% |
| Total | 3,341 | 100.0% |
School Enrollment by Age by Funding Source in Patillas Municipio
Out of a total of 3,341 students who are enrolled in schools in Patillas Municipio, 852 (25.5%) attend a private institution, while the remaining 2,489 (74.5%) are enrolled in public schools. The age group of 25 to 34 year olds has the highest likelihood of being enrolled in private schools, with 158 (84.5% in the age bracket) enrolled. Conversely, the age group of 3 to 4 year olds has the lowest likelihood of being enrolled in a private school, with 156 (100.0% in the age bracket) attending a public institution.
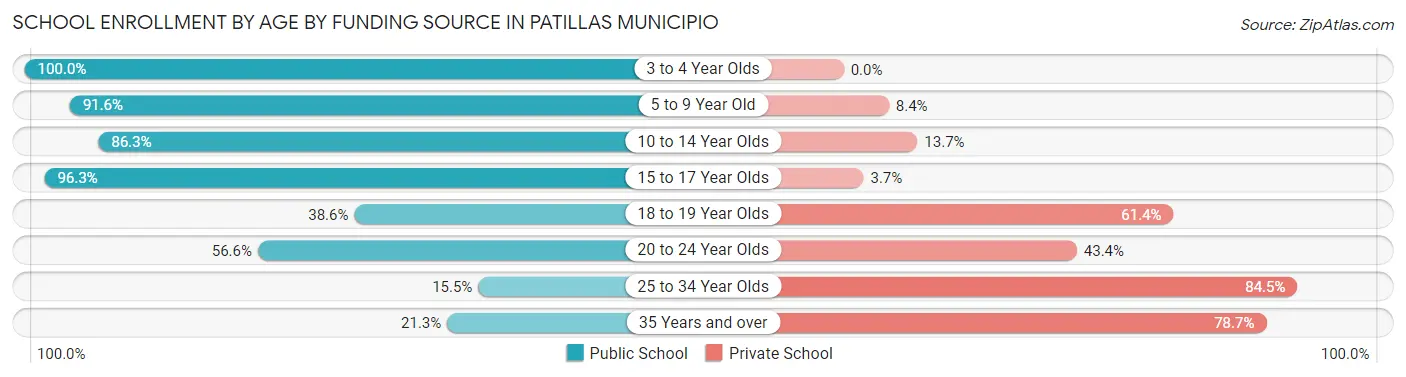
| Age Bracket | Public School | Private School |
| 3 to 4 Year Olds | 156 (100.0%) | 0 (0.0%) |
| 5 to 9 Year Old | 708 (91.6%) | 65 (8.4%) |
| 10 to 14 Year Olds | 691 (86.3%) | 110 (13.7%) |
| 15 to 17 Year Olds | 546 (96.3%) | 21 (3.7%) |
| 18 to 19 Year Olds | 142 (38.6%) | 226 (61.4%) |
| 20 to 24 Year Olds | 181 (56.6%) | 139 (43.4%) |
| 25 to 34 Year Olds | 29 (15.5%) | 158 (84.5%) |
| 35 Years and over | 36 (21.3%) | 133 (78.7%) |
| Total | 2,489 (74.5%) | 852 (25.5%) |
Educational Attainment by Field of Study in Patillas Municipio
Education (749 | 31.1%), business (479 | 19.9%), arts & humanities (340 | 14.1%), science & technology (280 | 11.6%), and bio, nature & agricultural (139 | 5.8%) are the most common fields of study among 2,410 individuals in Patillas Municipio who have obtained a bachelor's degree or higher.
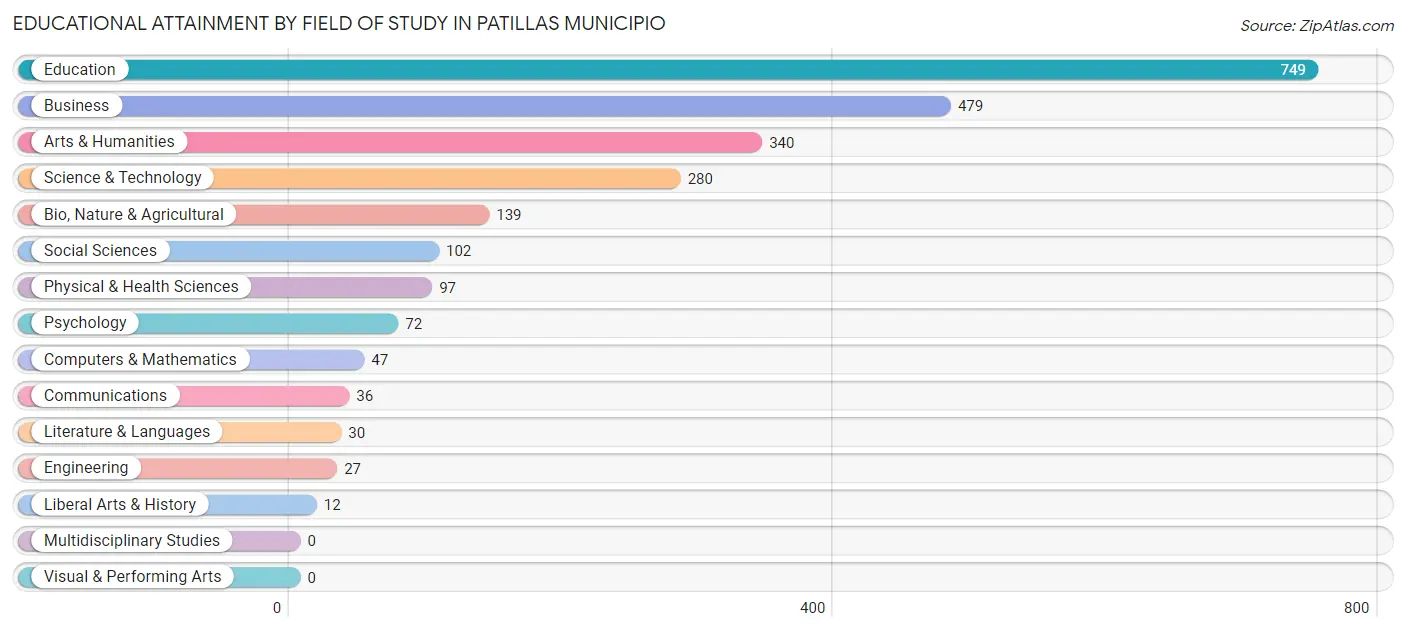
| Field of Study | # Graduates | % Graduates |
| Computers & Mathematics | 47 | 1.9% |
| Bio, Nature & Agricultural | 139 | 5.8% |
| Physical & Health Sciences | 97 | 4.0% |
| Psychology | 72 | 3.0% |
| Social Sciences | 102 | 4.2% |
| Engineering | 27 | 1.1% |
| Multidisciplinary Studies | 0 | 0.0% |
| Science & Technology | 280 | 11.6% |
| Business | 479 | 19.9% |
| Education | 749 | 31.1% |
| Literature & Languages | 30 | 1.2% |
| Liberal Arts & History | 12 | 0.5% |
| Visual & Performing Arts | 0 | 0.0% |
| Communications | 36 | 1.5% |
| Arts & Humanities | 340 | 14.1% |
| Total | 2,410 | 100.0% |
Transportation & Commute in Patillas Municipio
Vehicle Availability by Sex in Patillas Municipio
The most prevalent vehicle ownership categories in Patillas Municipio are males with 2 vehicles (1,082, accounting for 47.4%) and females with 2 vehicles (553, making up 67.4%).
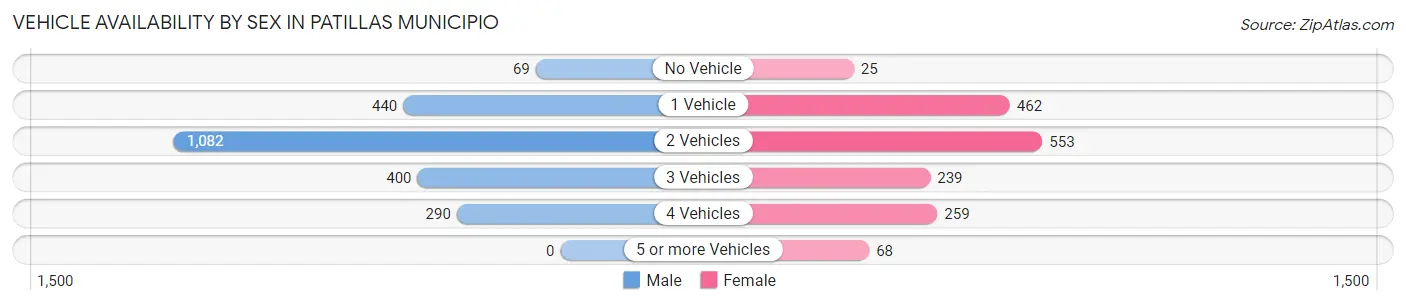
| Vehicles Available | Male | Female |
| No Vehicle | 69 (3.0%) | 25 (1.6%) |
| 1 Vehicle | 440 (19.3%) | 462 (28.8%) |
| 2 Vehicles | 1,082 (47.4%) | 553 (34.4%) |
| 3 Vehicles | 400 (17.5%) | 239 (14.9%) |
| 4 Vehicles | 290 (12.7%) | 259 (16.1%) |
| 5 or more Vehicles | 0 (0.0%) | 68 (4.2%) |
| Total | 2,281 (100.0%) | 1,606 (100.0%) |
Commute Time in Patillas Municipio
The most frequently occuring commute durations in Patillas Municipio are 30 to 34 minutes (598 commuters, 15.5%), 20 to 24 minutes (486 commuters, 12.6%), and 60 to 89 minutes (478 commuters, 12.4%).
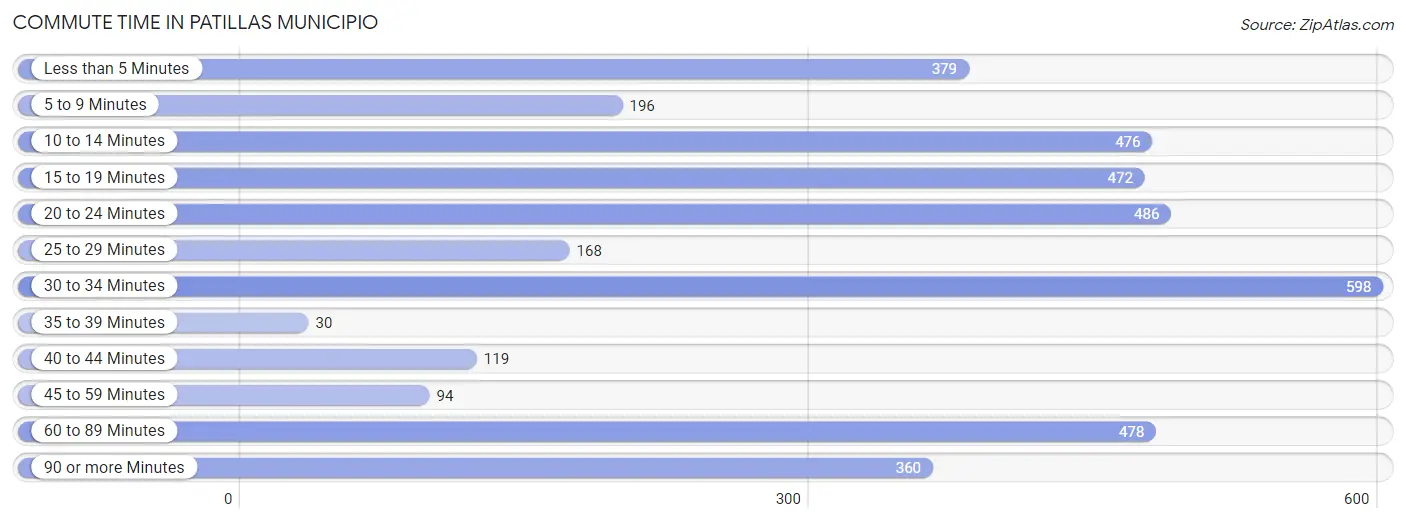
| Commute Time | # Commuters | % Commuters |
| Less than 5 Minutes | 379 | 9.8% |
| 5 to 9 Minutes | 196 | 5.1% |
| 10 to 14 Minutes | 476 | 12.3% |
| 15 to 19 Minutes | 472 | 12.2% |
| 20 to 24 Minutes | 486 | 12.6% |
| 25 to 29 Minutes | 168 | 4.4% |
| 30 to 34 Minutes | 598 | 15.5% |
| 35 to 39 Minutes | 30 | 0.8% |
| 40 to 44 Minutes | 119 | 3.1% |
| 45 to 59 Minutes | 94 | 2.4% |
| 60 to 89 Minutes | 478 | 12.4% |
| 90 or more Minutes | 360 | 9.3% |
Commute Time by Sex in Patillas Municipio
The most common commute times in Patillas Municipio are 60 to 89 minutes (365 commuters, 16.0%) for males and 30 to 34 minutes (418 commuters, 26.5%) for females.
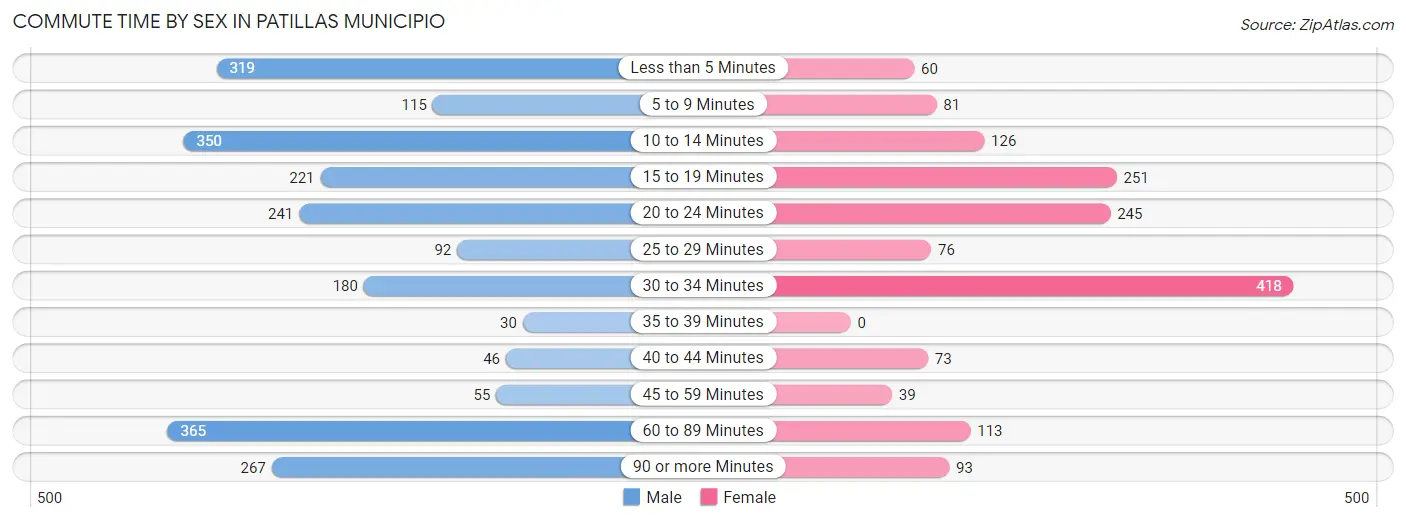
| Commute Time | Male | Female |
| Less than 5 Minutes | 319 (14.0%) | 60 (3.8%) |
| 5 to 9 Minutes | 115 (5.0%) | 81 (5.1%) |
| 10 to 14 Minutes | 350 (15.3%) | 126 (8.0%) |
| 15 to 19 Minutes | 221 (9.7%) | 251 (15.9%) |
| 20 to 24 Minutes | 241 (10.6%) | 245 (15.6%) |
| 25 to 29 Minutes | 92 (4.0%) | 76 (4.8%) |
| 30 to 34 Minutes | 180 (7.9%) | 418 (26.5%) |
| 35 to 39 Minutes | 30 (1.3%) | 0 (0.0%) |
| 40 to 44 Minutes | 46 (2.0%) | 73 (4.6%) |
| 45 to 59 Minutes | 55 (2.4%) | 39 (2.5%) |
| 60 to 89 Minutes | 365 (16.0%) | 113 (7.2%) |
| 90 or more Minutes | 267 (11.7%) | 93 (5.9%) |
Time of Departure to Work by Sex in Patillas Municipio
The most frequent times of departure to work in Patillas Municipio are 12:00 AM to 4:59 AM (424, 18.6%) for males and 5:00 AM to 5:29 AM (264, 16.8%) for females.
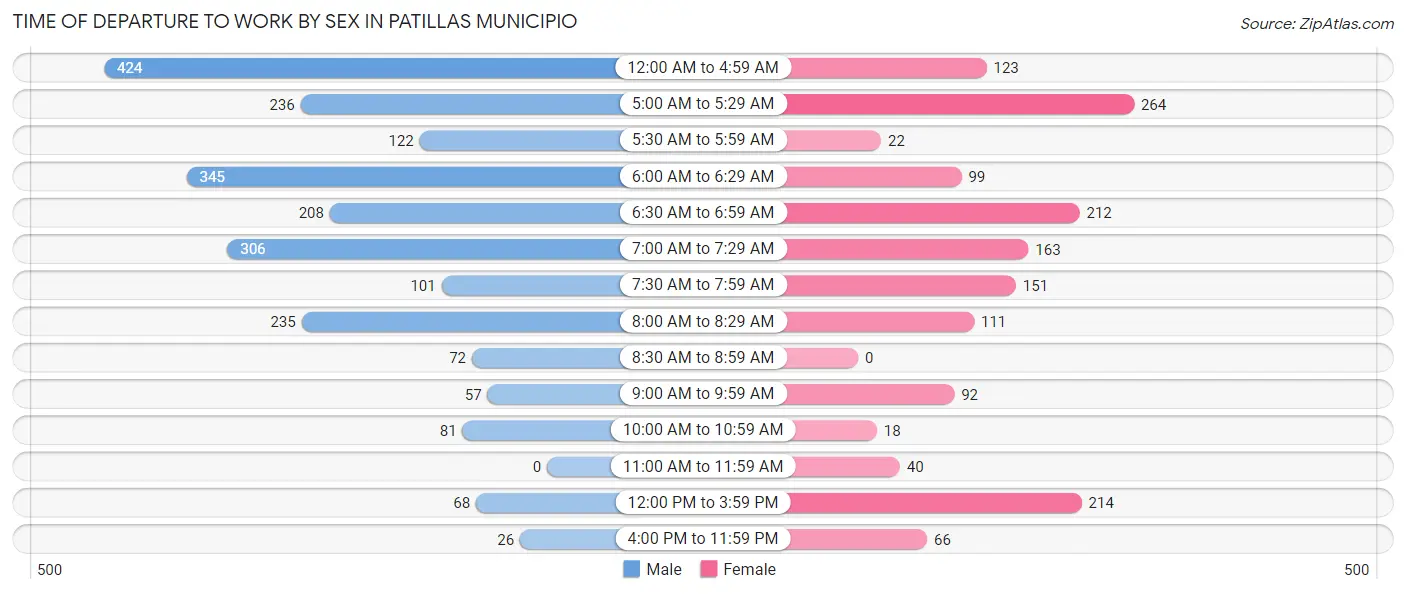
| Time of Departure | Male | Female |
| 12:00 AM to 4:59 AM | 424 (18.6%) | 123 (7.8%) |
| 5:00 AM to 5:29 AM | 236 (10.3%) | 264 (16.8%) |
| 5:30 AM to 5:59 AM | 122 (5.3%) | 22 (1.4%) |
| 6:00 AM to 6:29 AM | 345 (15.1%) | 99 (6.3%) |
| 6:30 AM to 6:59 AM | 208 (9.1%) | 212 (13.5%) |
| 7:00 AM to 7:29 AM | 306 (13.4%) | 163 (10.3%) |
| 7:30 AM to 7:59 AM | 101 (4.4%) | 151 (9.6%) |
| 8:00 AM to 8:29 AM | 235 (10.3%) | 111 (7.0%) |
| 8:30 AM to 8:59 AM | 72 (3.2%) | 0 (0.0%) |
| 9:00 AM to 9:59 AM | 57 (2.5%) | 92 (5.8%) |
| 10:00 AM to 10:59 AM | 81 (3.5%) | 18 (1.1%) |
| 11:00 AM to 11:59 AM | 0 (0.0%) | 40 (2.5%) |
| 12:00 PM to 3:59 PM | 68 (3.0%) | 214 (13.6%) |
| 4:00 PM to 11:59 PM | 26 (1.1%) | 66 (4.2%) |
| Total | 2,281 (100.0%) | 1,575 (100.0%) |
Housing Occupancy in Patillas Municipio
Occupancy by Ownership in Patillas Municipio
Of the total 6,196 dwellings in Patillas Municipio, owner-occupied units account for 4,243 (68.5%), while renter-occupied units make up 1,953 (31.5%).
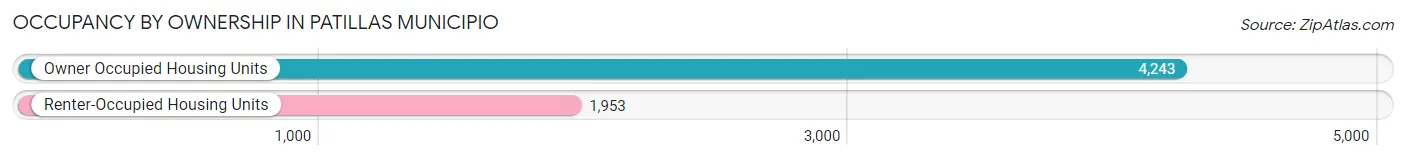
| Occupancy | # Housing Units | % Housing Units |
| Owner Occupied Housing Units | 4,243 | 68.5% |
| Renter-Occupied Housing Units | 1,953 | 31.5% |
| Total Occupied Housing Units | 6,196 | 100.0% |
Occupancy by Household Size in Patillas Municipio
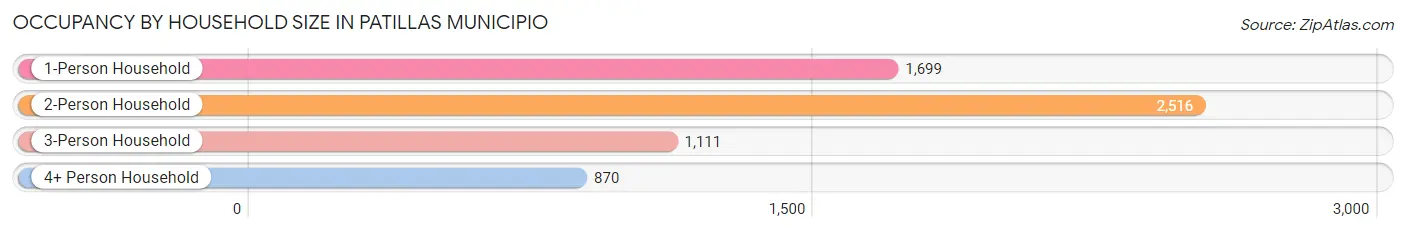
| Household Size | # Housing Units | % Housing Units |
| 1-Person Household | 1,699 | 27.4% |
| 2-Person Household | 2,516 | 40.6% |
| 3-Person Household | 1,111 | 17.9% |
| 4+ Person Household | 870 | 14.0% |
| Total Housing Units | 6,196 | 100.0% |
Occupancy by Ownership by Household Size in Patillas Municipio
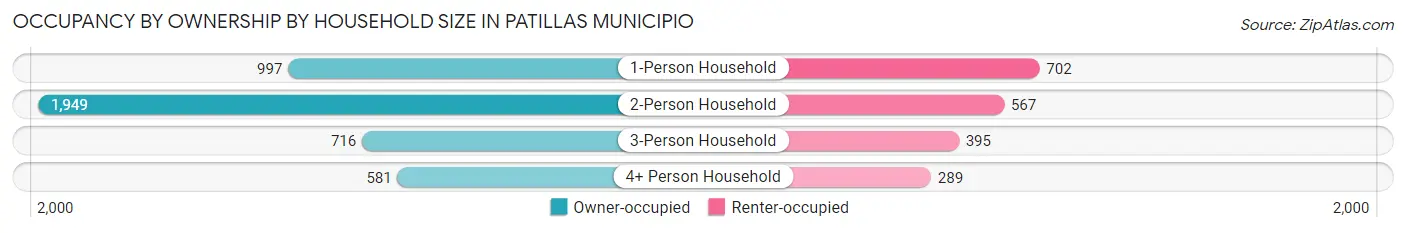
| Household Size | Owner-occupied | Renter-occupied |
| 1-Person Household | 997 (58.7%) | 702 (41.3%) |
| 2-Person Household | 1,949 (77.5%) | 567 (22.5%) |
| 3-Person Household | 716 (64.4%) | 395 (35.5%) |
| 4+ Person Household | 581 (66.8%) | 289 (33.2%) |
| Total Housing Units | 4,243 (68.5%) | 1,953 (31.5%) |
Occupancy by Educational Attainment in Patillas Municipio
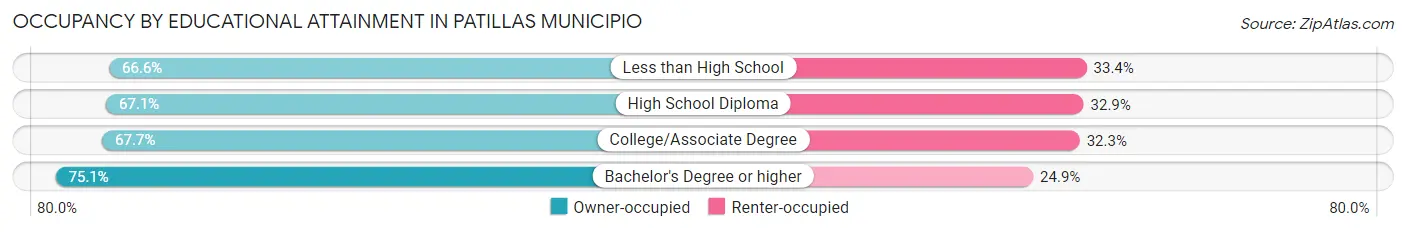
| Household Size | Owner-occupied | Renter-occupied |
| Less than High School | 996 (66.6%) | 499 (33.4%) |
| High School Diploma | 1,234 (67.1%) | 605 (32.9%) |
| College/Associate Degree | 1,250 (67.7%) | 596 (32.3%) |
| Bachelor's Degree or higher | 763 (75.1%) | 253 (24.9%) |
Occupancy by Age of Householder in Patillas Municipio
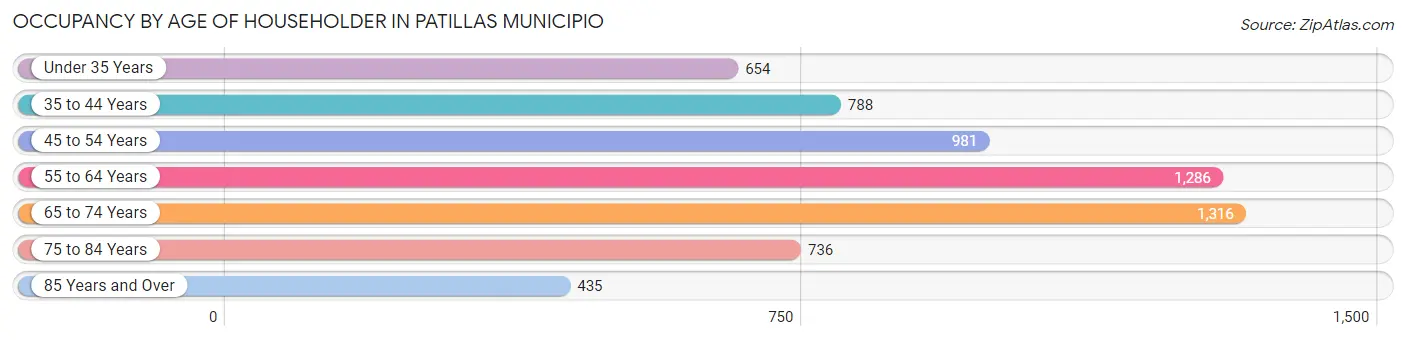
| Age Bracket | # Households | % Households |
| Under 35 Years | 654 | 10.6% |
| 35 to 44 Years | 788 | 12.7% |
| 45 to 54 Years | 981 | 15.8% |
| 55 to 64 Years | 1,286 | 20.8% |
| 65 to 74 Years | 1,316 | 21.2% |
| 75 to 84 Years | 736 | 11.9% |
| 85 Years and Over | 435 | 7.0% |
| Total | 6,196 | 100.0% |
Housing Finances in Patillas Municipio
Median Income by Occupancy in Patillas Municipio
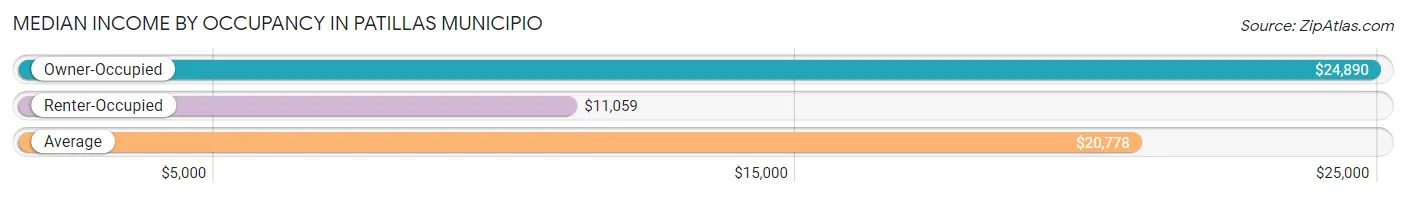
| Occupancy Type | # Households | Median Income |
| Owner-Occupied | 4,243 (68.5%) | $24,890 |
| Renter-Occupied | 1,953 (31.5%) | $11,059 |
| Average | 6,196 (100.0%) | $20,778 |
Occupancy by Householder Income Bracket in Patillas Municipio
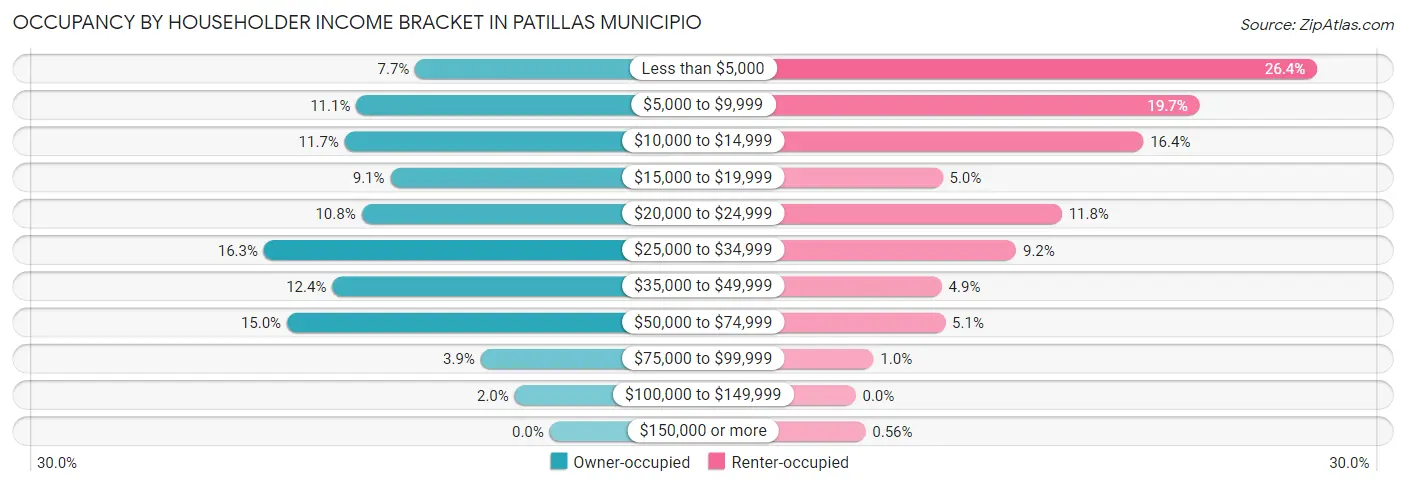
| Income Bracket | Owner-occupied | Renter-occupied |
| Less than $5,000 | 326 (7.7%) | 515 (26.4%) |
| $5,000 to $9,999 | 469 (11.1%) | 384 (19.7%) |
| $10,000 to $14,999 | 497 (11.7%) | 321 (16.4%) |
| $15,000 to $19,999 | 386 (9.1%) | 97 (5.0%) |
| $20,000 to $24,999 | 456 (10.7%) | 230 (11.8%) |
| $25,000 to $34,999 | 693 (16.3%) | 179 (9.2%) |
| $35,000 to $49,999 | 527 (12.4%) | 96 (4.9%) |
| $50,000 to $74,999 | 637 (15.0%) | 100 (5.1%) |
| $75,000 to $99,999 | 167 (3.9%) | 20 (1.0%) |
| $100,000 to $149,999 | 85 (2.0%) | 0 (0.0%) |
| $150,000 or more | 0 (0.0%) | 11 (0.6%) |
| Total | 4,243 (100.0%) | 1,953 (100.0%) |
Monthly Housing Cost Tiers in Patillas Municipio
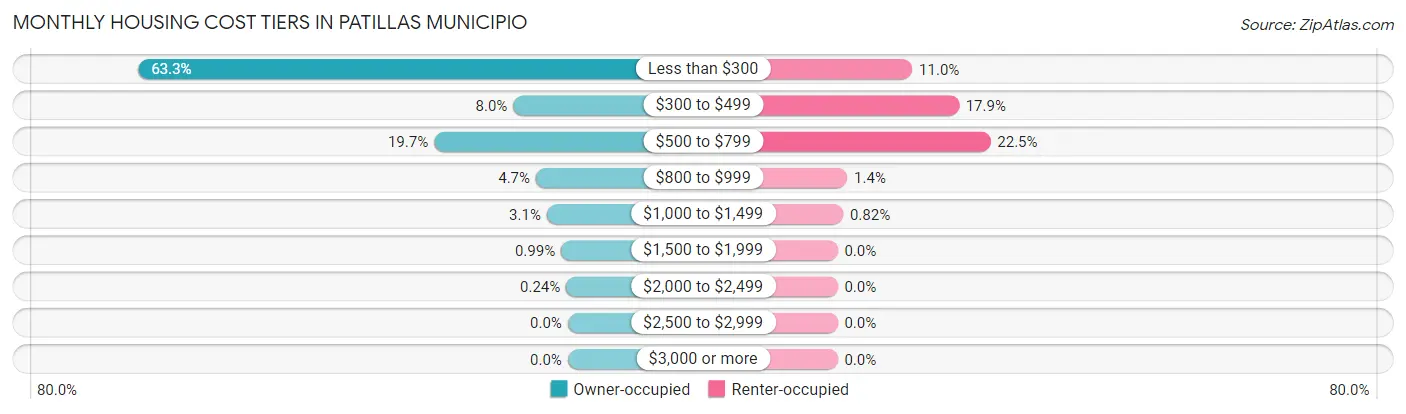
| Monthly Cost | Owner-occupied | Renter-occupied |
| Less than $300 | 2,684 (63.3%) | 215 (11.0%) |
| $300 to $499 | 341 (8.0%) | 349 (17.9%) |
| $500 to $799 | 836 (19.7%) | 440 (22.5%) |
| $800 to $999 | 199 (4.7%) | 28 (1.4%) |
| $1,000 to $1,499 | 131 (3.1%) | 16 (0.8%) |
| $1,500 to $1,999 | 42 (1.0%) | 0 (0.0%) |
| $2,000 to $2,499 | 10 (0.2%) | 0 (0.0%) |
| $2,500 to $2,999 | 0 (0.0%) | 0 (0.0%) |
| $3,000 or more | 0 (0.0%) | 0 (0.0%) |
| Total | 4,243 (100.0%) | 1,953 (100.0%) |
Physical Housing Characteristics in Patillas Municipio
Housing Structures in Patillas Municipio
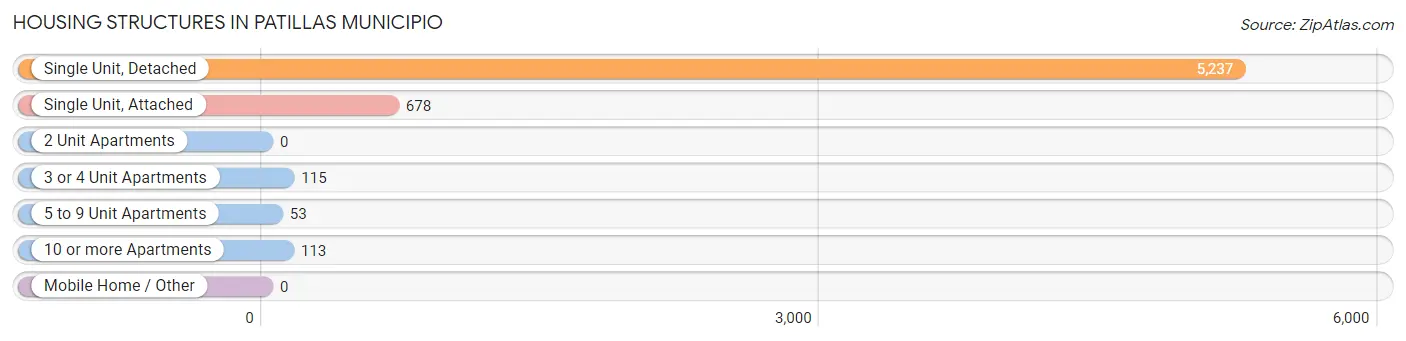
| Structure Type | # Housing Units | % Housing Units |
| Single Unit, Detached | 5,237 | 84.5% |
| Single Unit, Attached | 678 | 10.9% |
| 2 Unit Apartments | 0 | 0.0% |
| 3 or 4 Unit Apartments | 115 | 1.9% |
| 5 to 9 Unit Apartments | 53 | 0.9% |
| 10 or more Apartments | 113 | 1.8% |
| Mobile Home / Other | 0 | 0.0% |
| Total | 6,196 | 100.0% |
Housing Structures by Occupancy in Patillas Municipio
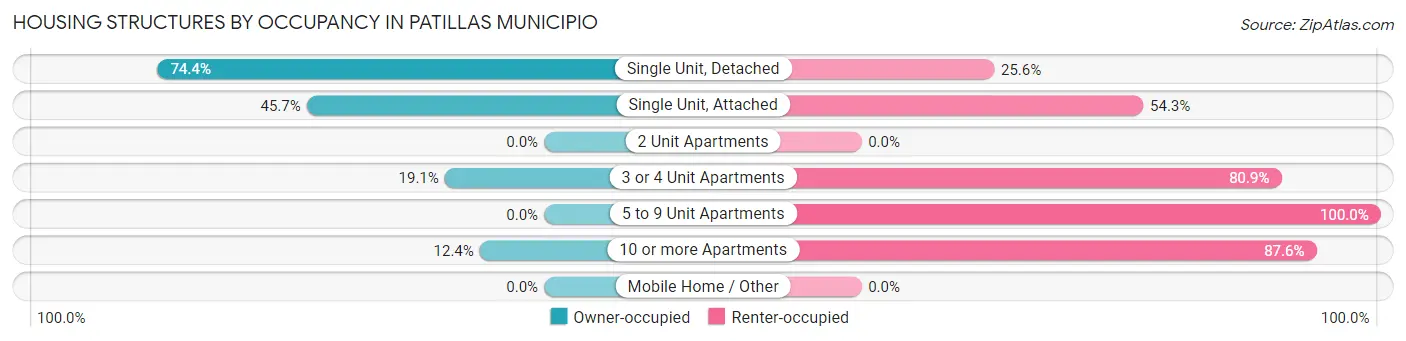
| Structure Type | Owner-occupied | Renter-occupied |
| Single Unit, Detached | 3,897 (74.4%) | 1,340 (25.6%) |
| Single Unit, Attached | 310 (45.7%) | 368 (54.3%) |
| 2 Unit Apartments | 0 (0.0%) | 0 (0.0%) |
| 3 or 4 Unit Apartments | 22 (19.1%) | 93 (80.9%) |
| 5 to 9 Unit Apartments | 0 (0.0%) | 53 (100.0%) |
| 10 or more Apartments | 14 (12.4%) | 99 (87.6%) |
| Mobile Home / Other | 0 (0.0%) | 0 (0.0%) |
| Total | 4,243 (68.5%) | 1,953 (31.5%) |
Housing Structures by Number of Rooms in Patillas Municipio
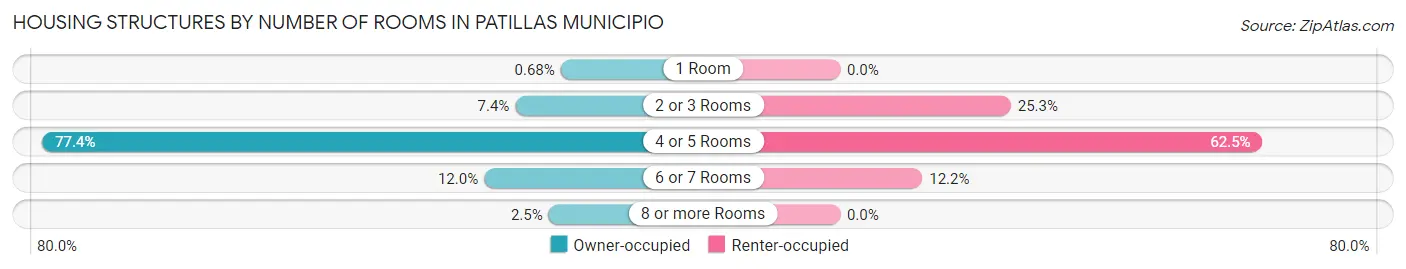
| Number of Rooms | Owner-occupied | Renter-occupied |
| 1 Room | 29 (0.7%) | 0 (0.0%) |
| 2 or 3 Rooms | 314 (7.4%) | 494 (25.3%) |
| 4 or 5 Rooms | 3,285 (77.4%) | 1,221 (62.5%) |
| 6 or 7 Rooms | 510 (12.0%) | 238 (12.2%) |
| 8 or more Rooms | 105 (2.5%) | 0 (0.0%) |
| Total | 4,243 (100.0%) | 1,953 (100.0%) |
Housing Structure by Heating Type in Patillas Municipio
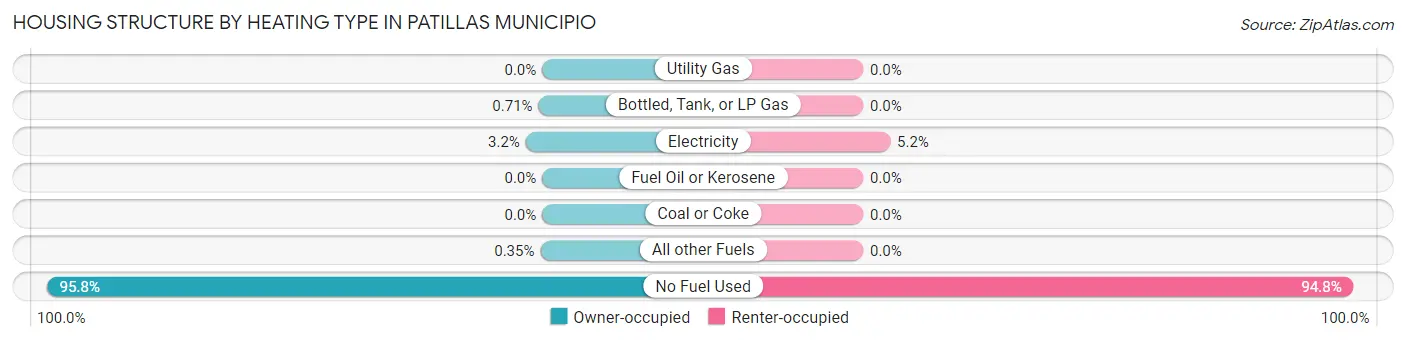
| Heating Type | Owner-occupied | Renter-occupied |
| Utility Gas | 0 (0.0%) | 0 (0.0%) |
| Bottled, Tank, or LP Gas | 30 (0.7%) | 0 (0.0%) |
| Electricity | 135 (3.2%) | 102 (5.2%) |
| Fuel Oil or Kerosene | 0 (0.0%) | 0 (0.0%) |
| Coal or Coke | 0 (0.0%) | 0 (0.0%) |
| All other Fuels | 15 (0.4%) | 0 (0.0%) |
| No Fuel Used | 4,063 (95.8%) | 1,851 (94.8%) |
| Total | 4,243 (100.0%) | 1,953 (100.0%) |
Household Vehicle Usage in Patillas Municipio
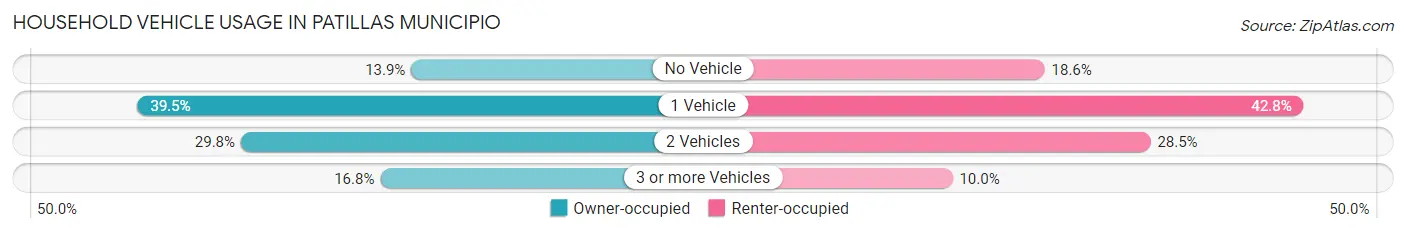
| Vehicles per Household | Owner-occupied | Renter-occupied |
| No Vehicle | 590 (13.9%) | 364 (18.6%) |
| 1 Vehicle | 1,675 (39.5%) | 836 (42.8%) |
| 2 Vehicles | 1,265 (29.8%) | 557 (28.5%) |
| 3 or more Vehicles | 713 (16.8%) | 196 (10.0%) |
| Total | 4,243 (100.0%) | 1,953 (100.0%) |
Real Estate & Mortgages in Patillas Municipio
Real Estate and Mortgage Overview in Patillas Municipio
| Characteristic | Without Mortgage | With Mortgage |
| Housing Units | 2,949 | 1,294 |
| Median Property Value | $90,500 | $116,900 |
| Median Household Income | $23,058 | $0 |
| Monthly Housing Costs | $149 | $0 |
| Real Estate Taxes | $199 | $1,214 |
Property Value by Mortgage Status in Patillas Municipio
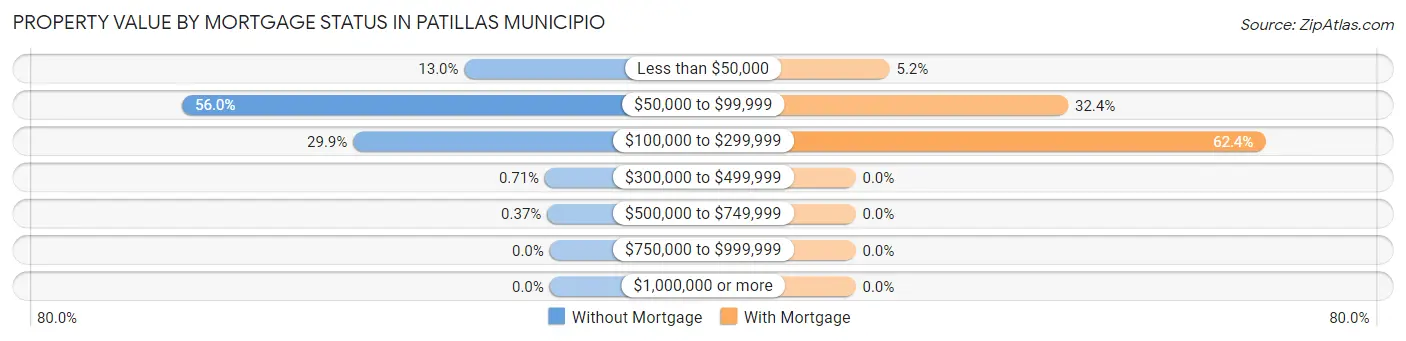
| Property Value | Without Mortgage | With Mortgage |
| Less than $50,000 | 383 (13.0%) | 67 (5.2%) |
| $50,000 to $99,999 | 1,651 (56.0%) | 419 (32.4%) |
| $100,000 to $299,999 | 883 (29.9%) | 808 (62.4%) |
| $300,000 to $499,999 | 21 (0.7%) | 0 (0.0%) |
| $500,000 to $749,999 | 11 (0.4%) | 0 (0.0%) |
| $750,000 to $999,999 | 0 (0.0%) | 0 (0.0%) |
| $1,000,000 or more | 0 (0.0%) | 0 (0.0%) |
| Total | 2,949 (100.0%) | 1,294 (100.0%) |
Household Income by Mortgage Status in Patillas Municipio
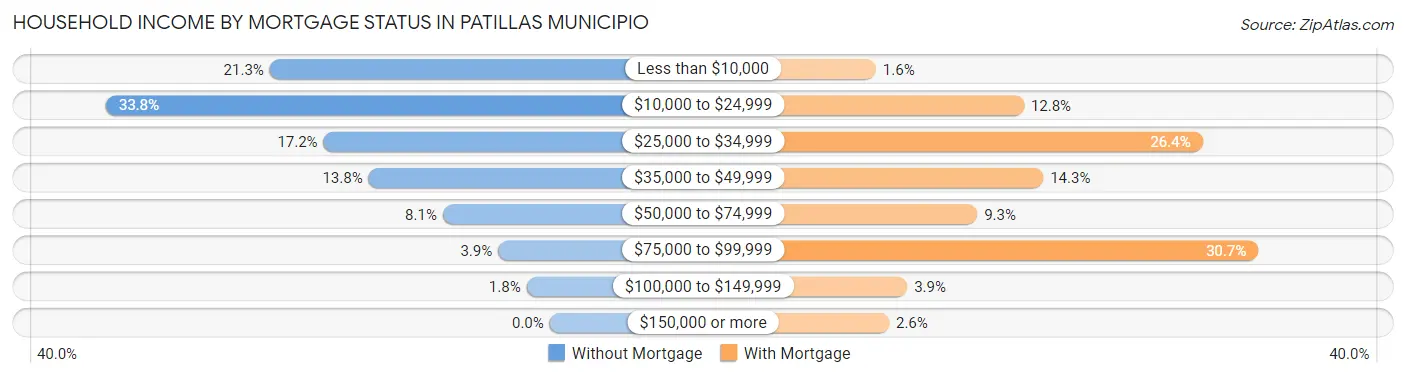
| Household Income | Without Mortgage | With Mortgage |
| Less than $10,000 | 629 (21.3%) | 20 (1.5%) |
| $10,000 to $24,999 | 997 (33.8%) | 166 (12.8%) |
| $25,000 to $34,999 | 508 (17.2%) | 342 (26.4%) |
| $35,000 to $49,999 | 407 (13.8%) | 185 (14.3%) |
| $50,000 to $74,999 | 240 (8.1%) | 120 (9.3%) |
| $75,000 to $99,999 | 116 (3.9%) | 397 (30.7%) |
| $100,000 to $149,999 | 52 (1.8%) | 51 (3.9%) |
| $150,000 or more | 0 (0.0%) | 33 (2.5%) |
| Total | 2,949 (100.0%) | 1,294 (100.0%) |
Property Value to Household Income Ratio in Patillas Municipio
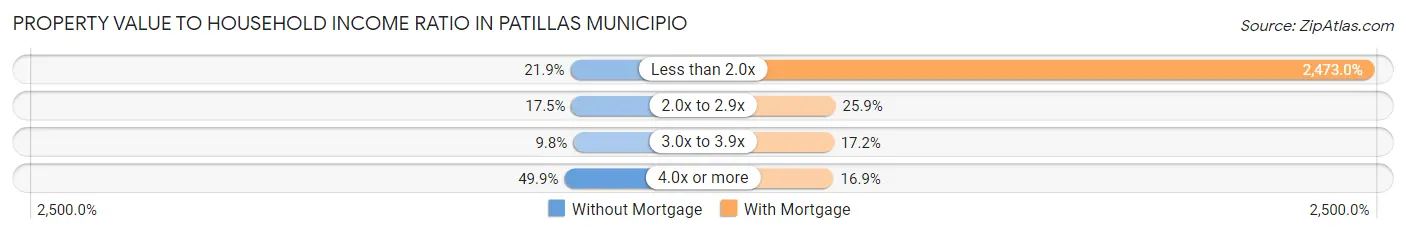
| Value-to-Income Ratio | Without Mortgage | With Mortgage |
| Less than 2.0x | 646 (21.9%) | 32,000 (2,473.0%) |
| 2.0x to 2.9x | 516 (17.5%) | 335 (25.9%) |
| 3.0x to 3.9x | 289 (9.8%) | 222 (17.2%) |
| 4.0x or more | 1,471 (49.9%) | 218 (16.9%) |
| Total | 2,949 (100.0%) | 1,294 (100.0%) |
Real Estate Taxes by Mortgage Status in Patillas Municipio

| Property Taxes | Without Mortgage | With Mortgage |
| Less than $800 | 240 (8.1%) | 65 (5.0%) |
| $800 to $1,499 | 11 (0.4%) | 70 (5.4%) |
| $800 to $1,499 | 9 (0.3%) | 10 (0.8%) |
| Total | 2,949 (100.0%) | 1,294 (100.0%) |
Health & Disability in Patillas Municipio
Health Insurance Coverage by Age in Patillas Municipio
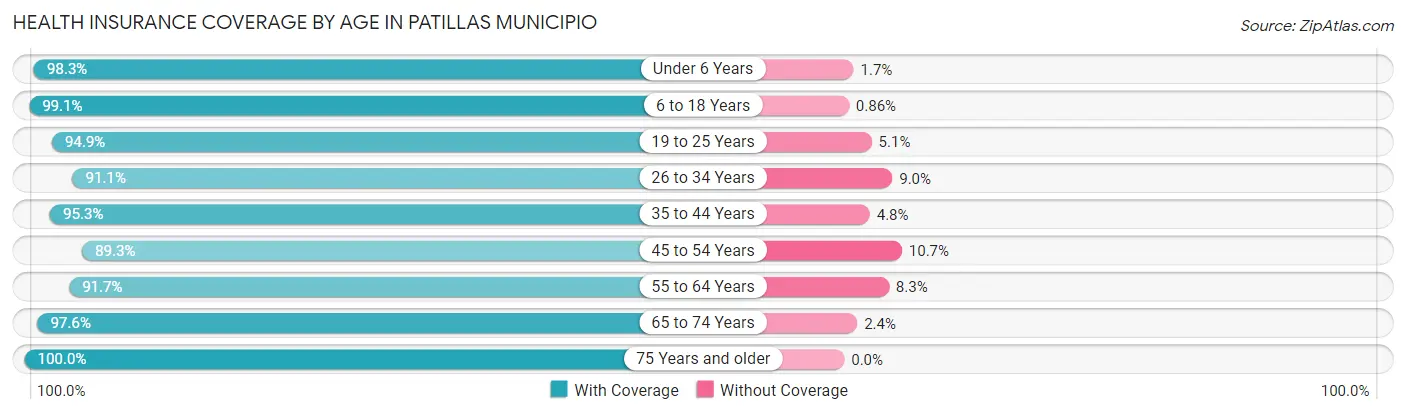
| Age Bracket | With Coverage | Without Coverage |
| Under 6 Years | 623 (98.3%) | 11 (1.7%) |
| 6 to 18 Years | 2,194 (99.1%) | 19 (0.9%) |
| 19 to 25 Years | 1,136 (94.9%) | 61 (5.1%) |
| 26 to 34 Years | 1,576 (91.0%) | 155 (8.9%) |
| 35 to 44 Years | 1,626 (95.3%) | 81 (4.8%) |
| 45 to 54 Years | 1,853 (89.3%) | 223 (10.7%) |
| 55 to 64 Years | 2,280 (91.7%) | 207 (8.3%) |
| 65 to 74 Years | 2,061 (97.6%) | 51 (2.4%) |
| 75 Years and older | 1,736 (100.0%) | 0 (0.0%) |
| Total | 15,085 (94.9%) | 808 (5.1%) |
Health Insurance Coverage by Citizenship Status in Patillas Municipio

| Citizenship Status | With Coverage | Without Coverage |
| Native Born | 623 (98.3%) | 11 (1.7%) |
| Foreign Born, Citizen | 2,194 (99.1%) | 19 (0.9%) |
| Foreign Born, not a Citizen | 1,136 (94.9%) | 61 (5.1%) |
Health Insurance Coverage by Household Income in Patillas Municipio
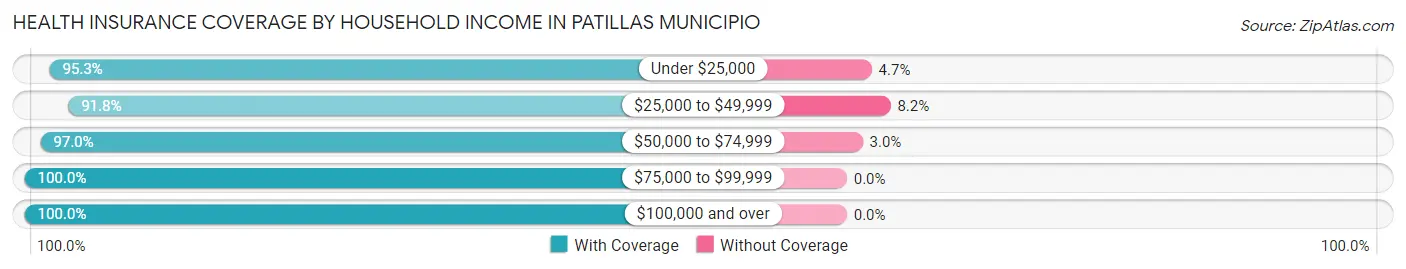
| Household Income | With Coverage | Without Coverage |
| Under $25,000 | 7,881 (95.3%) | 385 (4.7%) |
| $25,000 to $49,999 | 3,863 (91.8%) | 344 (8.2%) |
| $50,000 to $74,999 | 2,594 (97.0%) | 79 (3.0%) |
| $75,000 to $99,999 | 444 (100.0%) | 0 (0.0%) |
| $100,000 and over | 303 (100.0%) | 0 (0.0%) |
Public vs Private Health Insurance Coverage by Age in Patillas Municipio
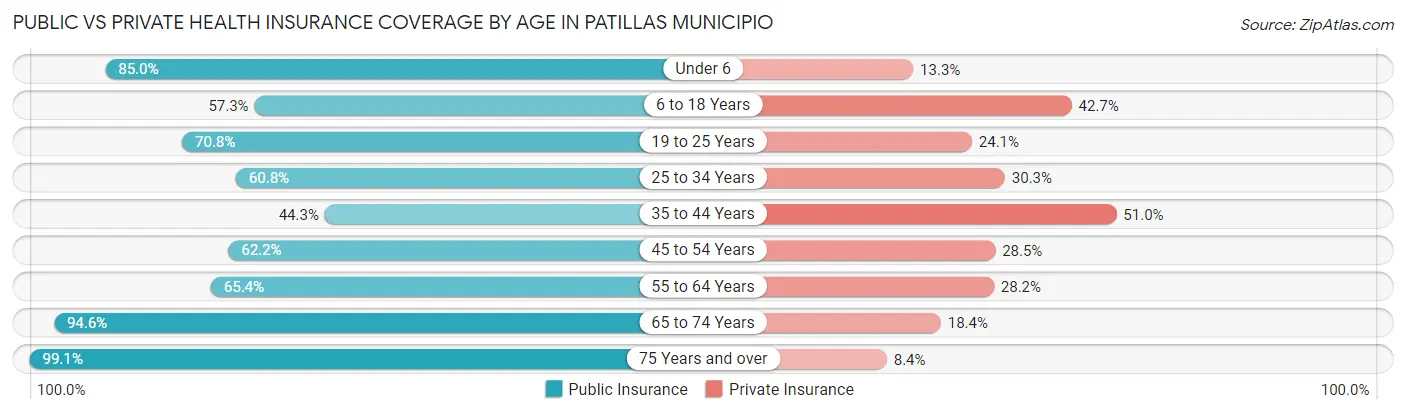
| Age Bracket | Public Insurance | Private Insurance |
| Under 6 | 539 (85.0%) | 84 (13.3%) |
| 6 to 18 Years | 1,269 (57.3%) | 944 (42.7%) |
| 19 to 25 Years | 847 (70.8%) | 289 (24.1%) |
| 25 to 34 Years | 1,052 (60.8%) | 524 (30.3%) |
| 35 to 44 Years | 756 (44.3%) | 870 (51.0%) |
| 45 to 54 Years | 1,291 (62.2%) | 591 (28.5%) |
| 55 to 64 Years | 1,627 (65.4%) | 702 (28.2%) |
| 65 to 74 Years | 1,997 (94.6%) | 388 (18.4%) |
| 75 Years and over | 1,720 (99.1%) | 145 (8.4%) |
| Total | 11,098 (69.8%) | 4,537 (28.5%) |
Disability Status by Sex by Age in Patillas Municipio
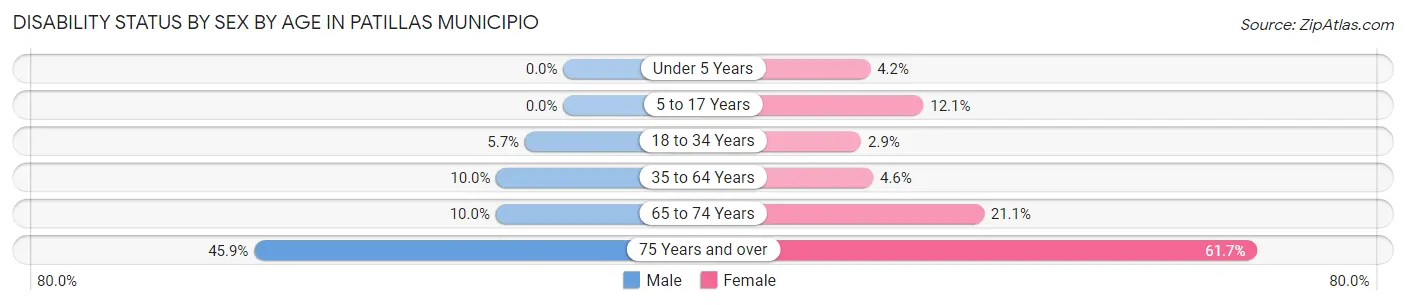
| Age Bracket | Male | Female |
| Under 5 Years | 0 (0.0%) | 10 (4.2%) |
| 5 to 17 Years | 0 (0.0%) | 141 (12.1%) |
| 18 to 34 Years | 92 (5.7%) | 44 (2.9%) |
| 35 to 64 Years | 304 (10.0%) | 149 (4.6%) |
| 65 to 74 Years | 102 (10.0%) | 231 (21.1%) |
| 75 Years and over | 320 (45.9%) | 641 (61.7%) |
Disability Class by Sex by Age in Patillas Municipio
Disability Class: Hearing Difficulty
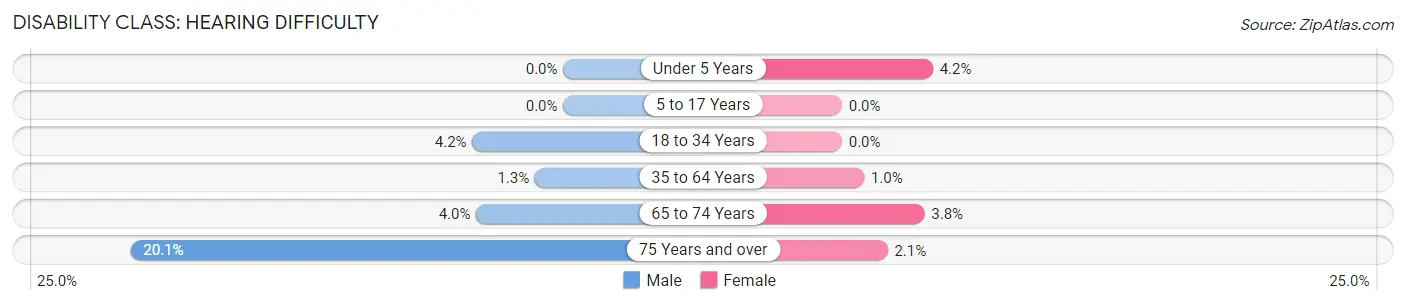
| Age Bracket | Male | Female |
| Under 5 Years | 0 (0.0%) | 10 (4.2%) |
| 5 to 17 Years | 0 (0.0%) | 0 (0.0%) |
| 18 to 34 Years | 68 (4.2%) | 0 (0.0%) |
| 35 to 64 Years | 40 (1.3%) | 33 (1.0%) |
| 65 to 74 Years | 41 (4.0%) | 42 (3.8%) |
| 75 Years and over | 140 (20.1%) | 22 (2.1%) |
Disability Class: Vision Difficulty
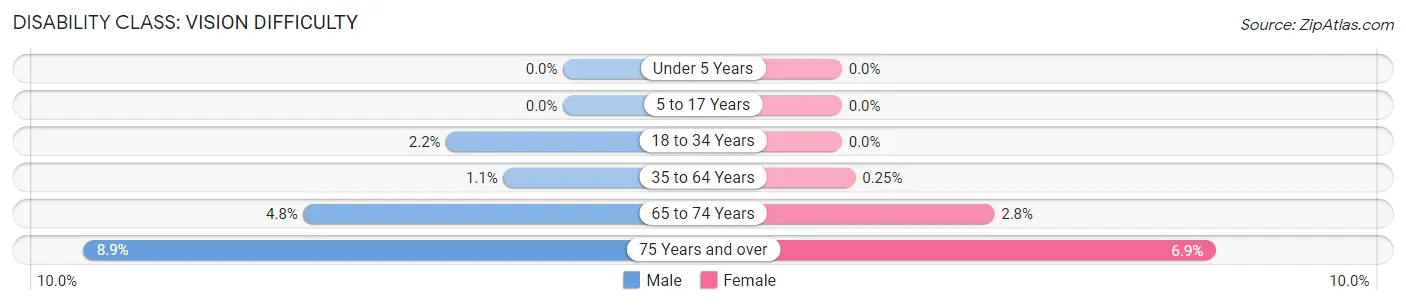
| Age Bracket | Male | Female |
| Under 5 Years | 0 (0.0%) | 0 (0.0%) |
| 5 to 17 Years | 0 (0.0%) | 0 (0.0%) |
| 18 to 34 Years | 35 (2.2%) | 0 (0.0%) |
| 35 to 64 Years | 34 (1.1%) | 8 (0.3%) |
| 65 to 74 Years | 49 (4.8%) | 31 (2.8%) |
| 75 Years and over | 62 (8.9%) | 72 (6.9%) |
Disability Class: Cognitive Difficulty
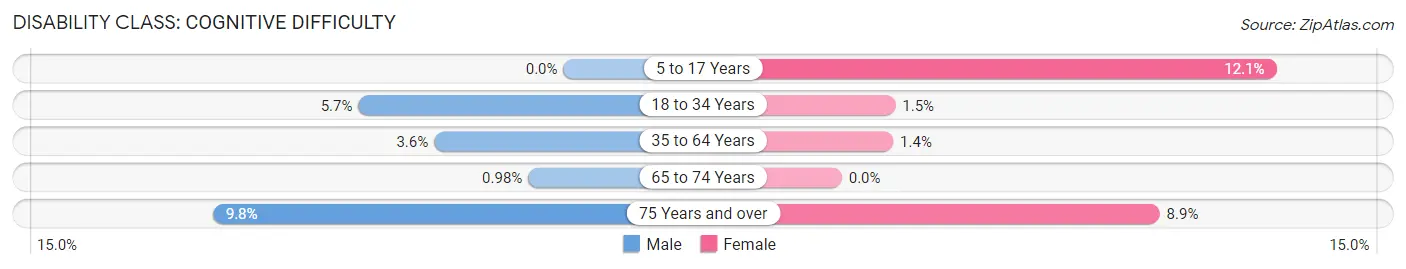
| Age Bracket | Male | Female |
| 5 to 17 Years | 0 (0.0%) | 141 (12.1%) |
| 18 to 34 Years | 92 (5.7%) | 23 (1.5%) |
| 35 to 64 Years | 110 (3.6%) | 46 (1.4%) |
| 65 to 74 Years | 10 (1.0%) | 0 (0.0%) |
| 75 Years and over | 68 (9.8%) | 92 (8.8%) |
Disability Class: Ambulatory Difficulty
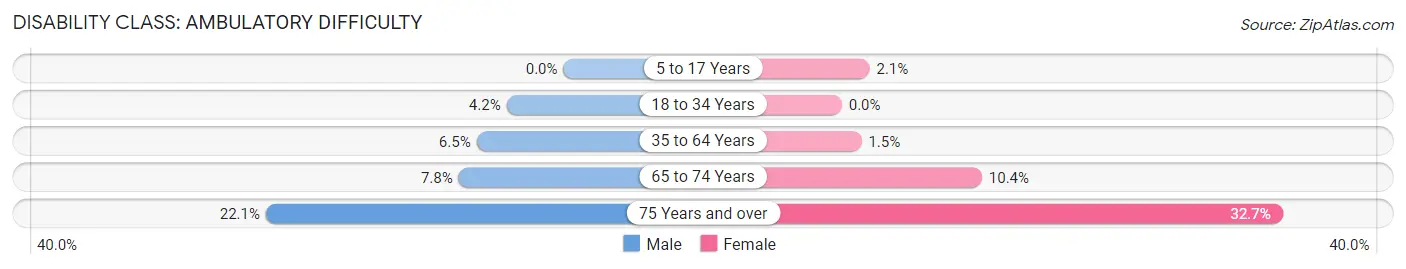
| Age Bracket | Male | Female |
| 5 to 17 Years | 0 (0.0%) | 24 (2.1%) |
| 18 to 34 Years | 68 (4.2%) | 0 (0.0%) |
| 35 to 64 Years | 197 (6.5%) | 47 (1.5%) |
| 65 to 74 Years | 79 (7.8%) | 114 (10.4%) |
| 75 Years and over | 154 (22.1%) | 340 (32.7%) |
Disability Class: Self-Care Difficulty
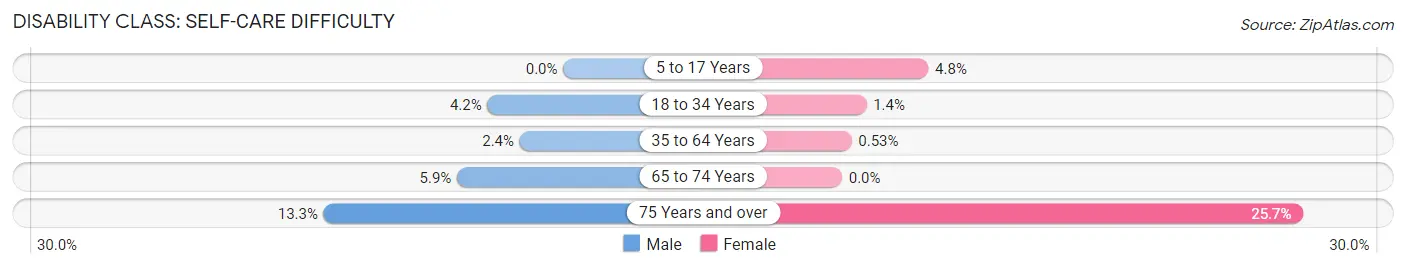
| Age Bracket | Male | Female |
| 5 to 17 Years | 0 (0.0%) | 56 (4.8%) |
| 18 to 34 Years | 68 (4.2%) | 21 (1.4%) |
| 35 to 64 Years | 74 (2.4%) | 17 (0.5%) |
| 65 to 74 Years | 60 (5.9%) | 0 (0.0%) |
| 75 Years and over | 93 (13.3%) | 267 (25.7%) |
Technology Access in Patillas Municipio
Computing Device Access in Patillas Municipio
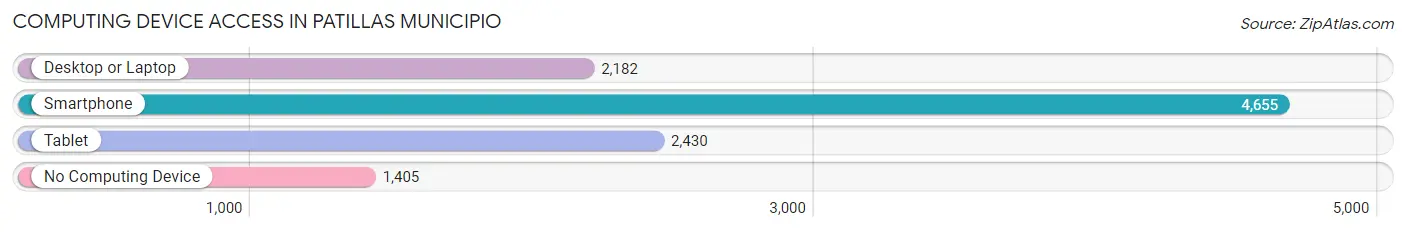
| Device Type | # Households | % Households |
| Desktop or Laptop | 2,182 | 35.2% |
| Smartphone | 4,655 | 75.1% |
| Tablet | 2,430 | 39.2% |
| No Computing Device | 1,405 | 22.7% |
| Total | 6,196 | 100.0% |
Internet Access in Patillas Municipio
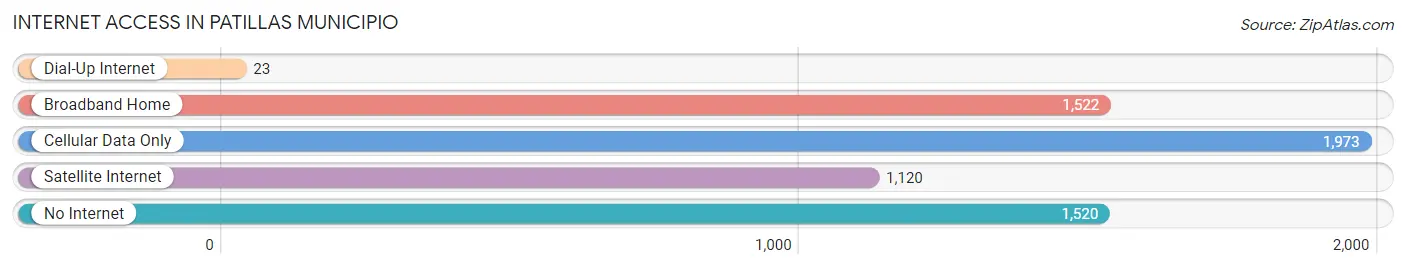
| Internet Type | # Households | % Households |
| Dial-Up Internet | 23 | 0.4% |
| Broadband Home | 1,522 | 24.6% |
| Cellular Data Only | 1,973 | 31.8% |
| Satellite Internet | 1,120 | 18.1% |
| No Internet | 1,520 | 24.5% |
| Total | 6,196 | 100.0% |
Patillas Municipio Summary
Patillas Municipio is a municipality located in the southeastern region of Puerto Rico. It is part of the Maunabo-Patillas Combined Statistical Area. The municipality is bordered by the municipalities of Maunabo, Yabucoa, and Arroyo. As of the 2010 census, the population of Patillas was 24,818.
Geography
Patillas Municipio is located in the southeastern region of Puerto Rico, on the Caribbean Sea. It is bordered by the municipalities of Maunabo, Yabucoa, and Arroyo. The municipality covers an area of approximately 39.7 square miles (102.7 km2). The terrain is mostly flat, with some hills in the northern part of the municipality. The highest point is Cerro La Punta, which has an elevation of 1,068 feet (325 m).
Climate
Patillas Municipio has a tropical climate, with hot and humid summers and mild winters. The average annual temperature is 79°F (26°C). The average annual precipitation is 64 inches (1,630 mm).
Demographics
As of the 2010 census, the population of Patillas was 24,818. The population is predominantly of Hispanic or Latino origin, with a small percentage of African American and White residents. The median age is 38.5 years, and the median household income is $17,845.
Economy
The economy of Patillas Municipio is largely based on agriculture. The main crops grown in the municipality are sugarcane, coffee, and bananas. Other industries include manufacturing, tourism, and services.
History
Patillas Municipio was founded in 1813. It was originally part of the municipality of Maunabo, but was separated in 1824. The municipality was named after the Patillas River, which runs through the area. During the 19th century, the economy of Patillas was based on the production of sugarcane and coffee. In the early 20th century, the economy shifted to the production of bananas.
In the 1950s, Patillas Municipio experienced a period of rapid population growth, due to the influx of people from other parts of Puerto Rico. This growth continued into the 1970s, when the population reached its peak of 28,000. Since then, the population has declined slightly, due to migration to other parts of Puerto Rico and the United States.
Common Questions
What is Per Capita Income in Patillas Municipio?
Per Capita income in Patillas Municipio is $11,832.
What is the Median Family Income in Patillas Municipio?
Median Family Income in Patillas Municipio is $23,811.
What is the Median Household income in Patillas Municipio?
Median Household Income in Patillas Municipio is $20,778.
What is Income or Wage Gap in Patillas Municipio?
Income or Wage Gap in Patillas Municipio is 12.0%.
Women in Patillas Municipio earn 88.0 cents for every dollar earned by a man.
What is Family Income Deficit in Patillas Municipio?
Family Income Deficit in Patillas Municipio is $10,956.
Families that are below poverty line in Patillas Municipio earn $10,956 less on average than the poverty threshold level.
What is Inequality or Gini Index in Patillas Municipio?
Inequality or Gini Index in Patillas Municipio is 0.48.
What is the Total Population of Patillas Municipio?
Total Population of Patillas Municipio is 15,927.
What is the Total Male Population of Patillas Municipio?
Total Male Population of Patillas Municipio is 7,633.
What is the Total Female Population of Patillas Municipio?
Total Female Population of Patillas Municipio is 8,294.
What is the Ratio of Males per 100 Females in Patillas Municipio?
There are 92.03 Males per 100 Females in Patillas Municipio.
What is the Ratio of Females per 100 Males in Patillas Municipio?
There are 108.66 Females per 100 Males in Patillas Municipio.
What is the Median Population Age in Patillas Municipio?
Median Population Age in Patillas Municipio is 46.9 Years.
What is the Average Family Size in Patillas Municipio
Average Family Size in Patillas Municipio is 3.2 People.
What is the Average Household Size in Patillas Municipio
Average Household Size in Patillas Municipio is 2.6 People.
How Large is the Labor Force in Patillas Municipio?
There are 4,985 People in the Labor Forcein in Patillas Municipio.
What is the Percentage of People in the Labor Force in Patillas Municipio?
36.5% of People are in the Labor Force in Patillas Municipio.
What is the Unemployment Rate in Patillas Municipio?
Unemployment Rate in Patillas Municipio is 13.0%.