Bajandas, PR Map & Demographics
Bajandas Map
Bajandas Overview
$9,270
PER CAPITA INCOME
$26,346
AVG FAMILY INCOME
$20,764
AVG HOUSEHOLD INCOME
0.33
INEQUALITY / GINI INDEX
777
TOTAL POPULATION
253
MALE POPULATION
524
FEMALE POPULATION
48.28
MALES / 100 FEMALES
207.11
FEMALES / 100 MALES
62.5
MEDIAN AGE
3.3
AVG FAMILY SIZE
2.3
AVG HOUSEHOLD SIZE
117
LABOR FORCE [ PEOPLE ]
15.8%
PERCENT IN LABOR FORCE
Income in Bajandas
Income Overview in Bajandas
Per Capita Income in Bajandas is $9,270, while median incomes of families and households are $26,346 and $20,764 respectively.
| Characteristic | Number | Measure |
| Per Capita Income | 777 | $9,270 |
| Median Family Income | 188 | $26,346 |
| Mean Family Income | 188 | $23,888 |
| Median Household Income | 333 | $20,764 |
| Mean Household Income | 333 | $18,272 |
| Income Deficit | 188 | $0 |
| Wage / Income Gap (%) | 777 | 0.00% |
| Wage / Income Gap ($) | 777 | 100.00¢ per $1 |
| Gini / Inequality Index | 777 | 0.33 |
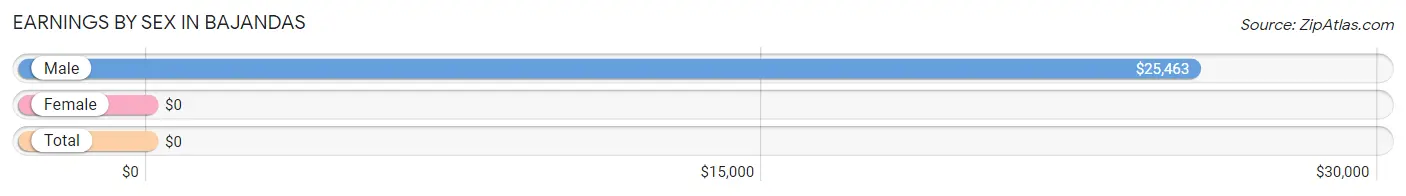
Earnings by Sex in Bajandas
| Sex | Number | Average Earnings |
| Male | 48 (41.0%) | $25,463 |
| Female | 69 (59.0%) | $0 |
| Total | 117 (100.0%) | $0 |
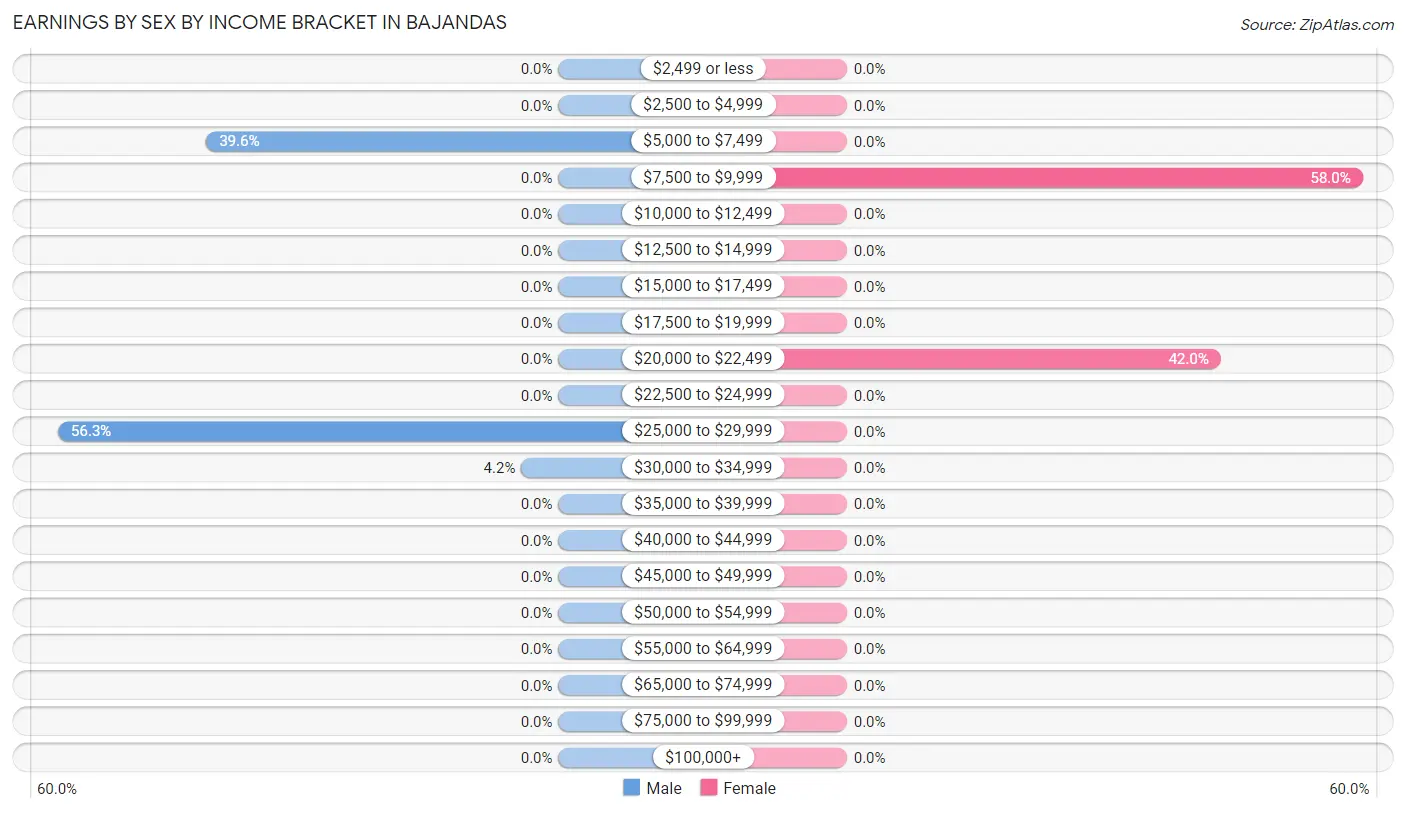
Earnings by Sex by Income Bracket in Bajandas
The most common earnings brackets in Bajandas are $25,000 to $29,999 for men (27 | 56.2%) and $7,500 to $9,999 for women (40 | 58.0%).
| Income | Male | Female |
| $2,499 or less | 0 (0.0%) | 0 (0.0%) |
| $2,500 to $4,999 | 0 (0.0%) | 0 (0.0%) |
| $5,000 to $7,499 | 19 (39.6%) | 0 (0.0%) |
| $7,500 to $9,999 | 0 (0.0%) | 40 (58.0%) |
| $10,000 to $12,499 | 0 (0.0%) | 0 (0.0%) |
| $12,500 to $14,999 | 0 (0.0%) | 0 (0.0%) |
| $15,000 to $17,499 | 0 (0.0%) | 0 (0.0%) |
| $17,500 to $19,999 | 0 (0.0%) | 0 (0.0%) |
| $20,000 to $22,499 | 0 (0.0%) | 29 (42.0%) |
| $22,500 to $24,999 | 0 (0.0%) | 0 (0.0%) |
| $25,000 to $29,999 | 27 (56.2%) | 0 (0.0%) |
| $30,000 to $34,999 | 2 (4.2%) | 0 (0.0%) |
| $35,000 to $39,999 | 0 (0.0%) | 0 (0.0%) |
| $40,000 to $44,999 | 0 (0.0%) | 0 (0.0%) |
| $45,000 to $49,999 | 0 (0.0%) | 0 (0.0%) |
| $50,000 to $54,999 | 0 (0.0%) | 0 (0.0%) |
| $55,000 to $64,999 | 0 (0.0%) | 0 (0.0%) |
| $65,000 to $74,999 | 0 (0.0%) | 0 (0.0%) |
| $75,000 to $99,999 | 0 (0.0%) | 0 (0.0%) |
| $100,000+ | 0 (0.0%) | 0 (0.0%) |
| Total | 48 (100.0%) | 69 (100.0%) |
Earnings by Sex by Educational Attainment in Bajandas
| Educational Attainment | Male Income | Female Income |
| Less than High School | - | - |
| High School Diploma | - | - |
| College or Associate's Degree | - | - |
| Bachelor's Degree | - | - |
| Graduate Degree | - | - |
| Total | $26,343 | $0 |
Family Income in Bajandas
Family Income Brackets in Bajandas
According to the Bajandas family income data, there are 122 families falling into the $25,000 to $34,999 income range, which is the most common income bracket and makes up 64.9% of all families.
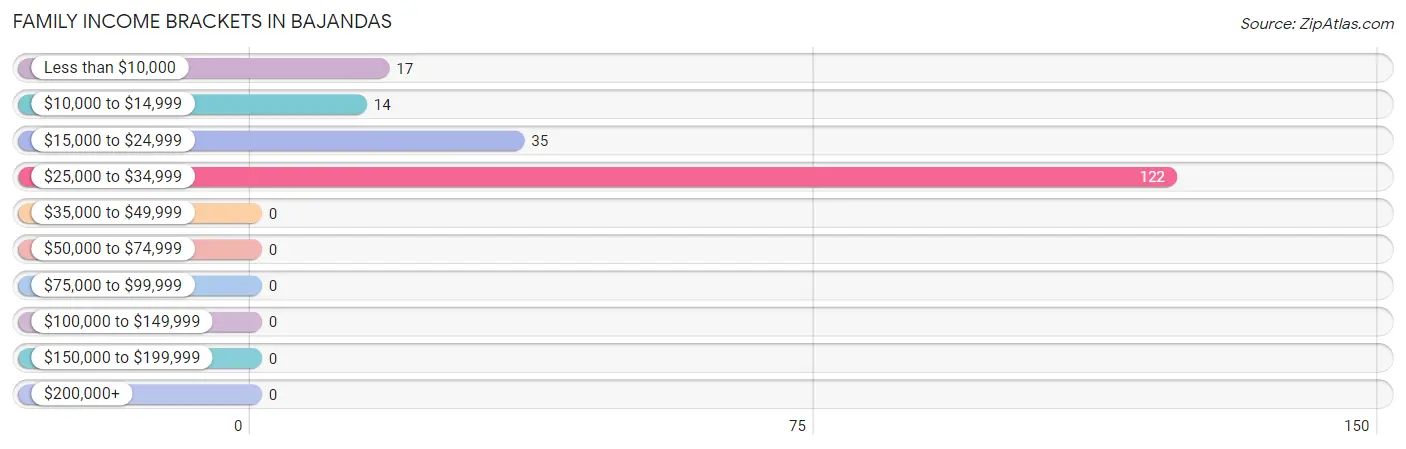
| Income Bracket | # Families | % Families |
| Less than $10,000 | 17 | 9.0% |
| $10,000 to $14,999 | 14 | 7.4% |
| $15,000 to $24,999 | 35 | 18.6% |
| $25,000 to $34,999 | 122 | 64.9% |
| $35,000 to $49,999 | 0 | 0.0% |
| $50,000 to $74,999 | 0 | 0.0% |
| $75,000 to $99,999 | 0 | 0.0% |
| $100,000 to $149,999 | 0 | 0.0% |
| $150,000 to $199,999 | 0 | 0.0% |
| $200,000+ | 0 | 0.0% |
Family Income by Famaliy Size in Bajandas
2-person families (141 | 75.0%) account for the highest median family income in Bajandas with $26,034 per family, while 2-person families (141 | 75.0%) have the highest median income of $13,017 per family member.
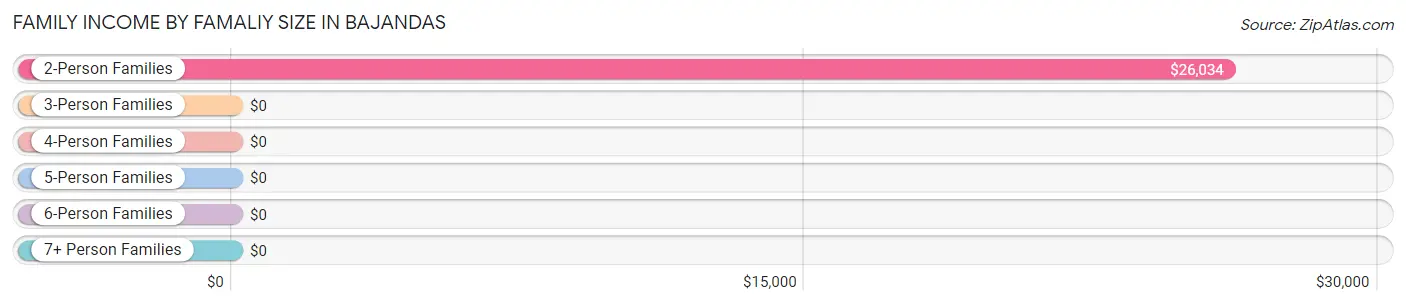
| Income Bracket | # Families | Median Income |
| 2-Person Families | 141 (75.0%) | $26,034 |
| 3-Person Families | 17 (9.0%) | $0 |
| 4-Person Families | 30 (16.0%) | $0 |
| 5-Person Families | 0 (0.0%) | $0 |
| 6-Person Families | 0 (0.0%) | $0 |
| 7+ Person Families | 0 (0.0%) | $0 |
| Total | 188 (100.0%) | $26,346 |
Family Income by Number of Earners in Bajandas
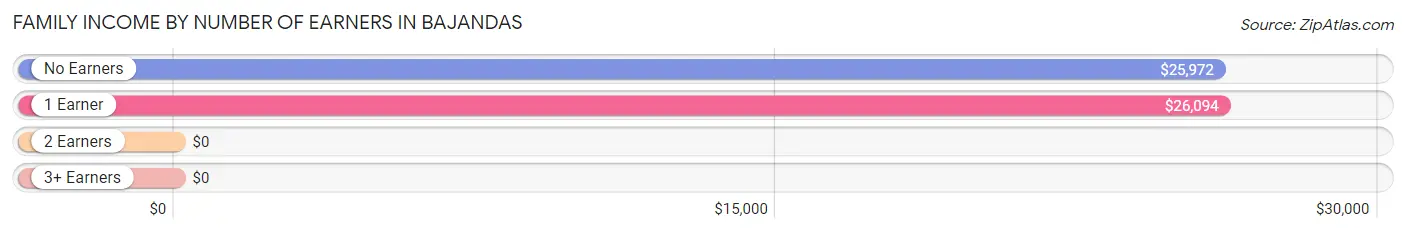
| Number of Earners | # Families | Median Income |
| No Earners | 124 (66.0%) | $25,972 |
| 1 Earner | 50 (26.6%) | $26,094 |
| 2 Earners | 14 (7.4%) | $0 |
| 3+ Earners | 0 (0.0%) | $0 |
| Total | 188 (100.0%) | $26,346 |
Household Income in Bajandas
Household Income Brackets in Bajandas
With 122 households falling in the category, the $25,000 to $34,999 income range is the most frequent in Bajandas, accounting for 36.6% of all households.
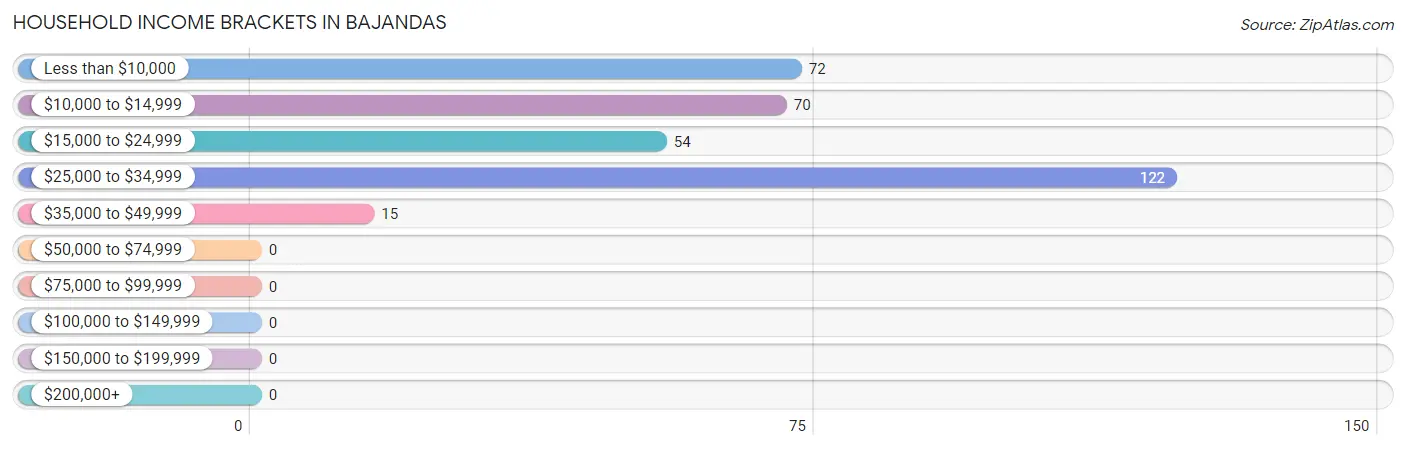
| Income Bracket | # Households | % Households |
| Less than $10,000 | 72 | 21.6% |
| $10,000 to $14,999 | 70 | 21.0% |
| $15,000 to $24,999 | 54 | 16.2% |
| $25,000 to $34,999 | 122 | 36.6% |
| $35,000 to $49,999 | 15 | 4.5% |
| $50,000 to $74,999 | 0 | 0.0% |
| $75,000 to $99,999 | 0 | 0.0% |
| $100,000 to $149,999 | 0 | 0.0% |
| $150,000 to $199,999 | 0 | 0.0% |
| $200,000+ | 0 | 0.0% |
Household Income by Householder Age in Bajandas
The median household income in Bajandas is $20,764, with the highest median household income of $17,171 found in the 65+ years age bracket for the primary householder. A total of 185 households (55.6%) fall into this category.
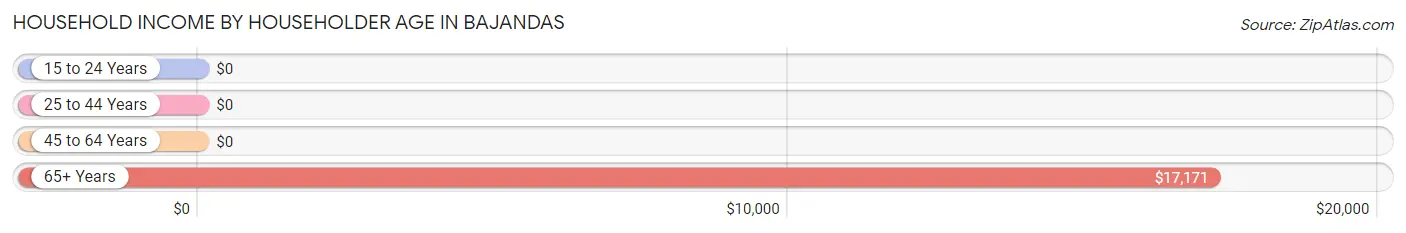
| Income Bracket | # Households | Median Income |
| 15 to 24 Years | 0 (0.0%) | $0 |
| 25 to 44 Years | 14 (4.2%) | $0 |
| 45 to 64 Years | 134 (40.2%) | $0 |
| 65+ Years | 185 (55.6%) | $17,171 |
| Total | 333 (100.0%) | $20,764 |
Poverty in Bajandas
Income Below Poverty by Sex and Age in Bajandas
With 62.1% poverty level for males and 32.3% for females among the residents of Bajandas, 25 to 34 year old males and 6 to 11 year old females are the most vulnerable to poverty, with 40 males (100.0%) and 19 females (100.0%) in their respective age groups living below the poverty level.
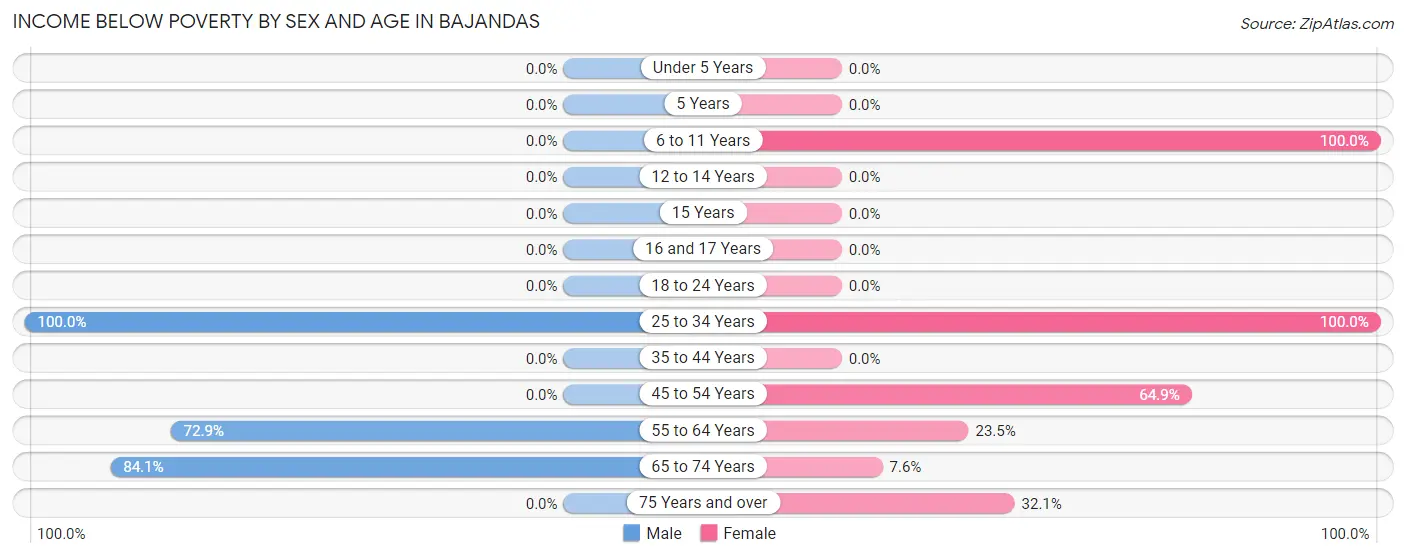
| Age Bracket | Male | Female |
| Under 5 Years | 0 (0.0%) | 0 (0.0%) |
| 5 Years | 0 (0.0%) | 0 (0.0%) |
| 6 to 11 Years | 0 (0.0%) | 19 (100.0%) |
| 12 to 14 Years | 0 (0.0%) | 0 (0.0%) |
| 15 Years | 0 (0.0%) | 0 (0.0%) |
| 16 and 17 Years | 0 (0.0%) | 0 (0.0%) |
| 18 to 24 Years | 0 (0.0%) | 0 (0.0%) |
| 25 to 34 Years | 40 (100.0%) | 29 (100.0%) |
| 35 to 44 Years | 0 (0.0%) | 0 (0.0%) |
| 45 to 54 Years | 0 (0.0%) | 74 (64.9%) |
| 55 to 64 Years | 43 (72.9%) | 16 (23.5%) |
| 65 to 74 Years | 74 (84.1%) | 14 (7.6%) |
| 75 Years and over | 0 (0.0%) | 17 (32.1%) |
| Total | 157 (62.1%) | 169 (32.3%) |
Income Above Poverty by Sex and Age in Bajandas
According to the poverty statistics in Bajandas, males aged 12 to 14 years and females aged 18 to 24 years are the age groups that are most secure financially, with 100.0% of males and 100.0% of females in these age groups living above the poverty line.
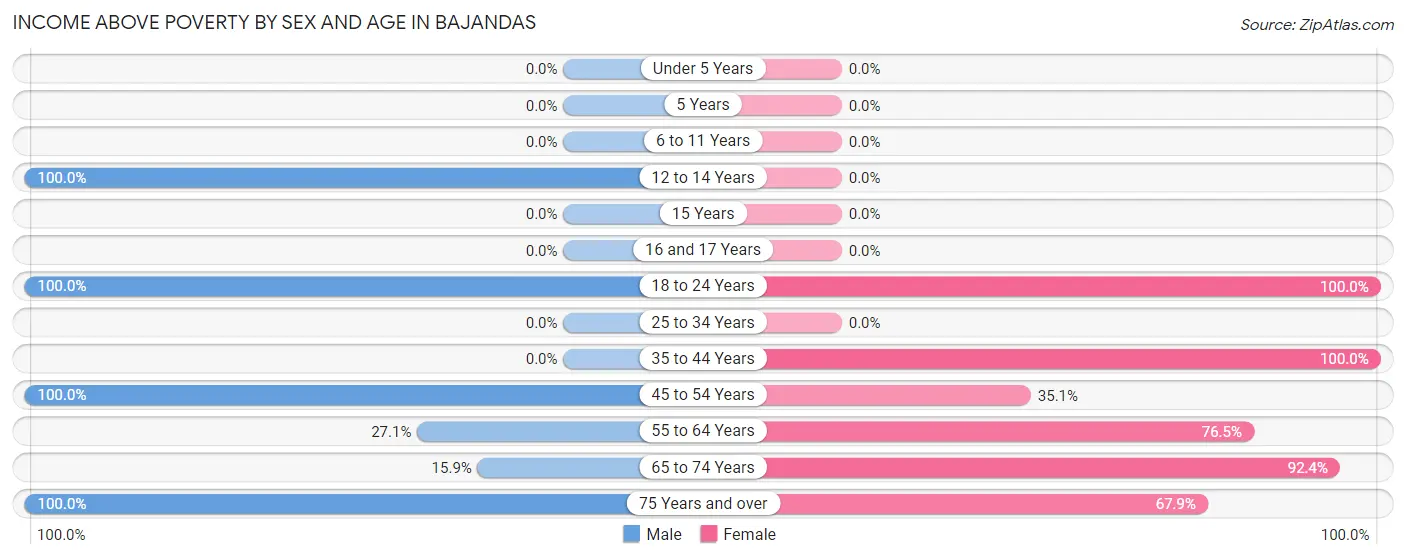
| Age Bracket | Male | Female |
| Under 5 Years | 0 (0.0%) | 0 (0.0%) |
| 5 Years | 0 (0.0%) | 0 (0.0%) |
| 6 to 11 Years | 0 (0.0%) | 0 (0.0%) |
| 12 to 14 Years | 16 (100.0%) | 0 (0.0%) |
| 15 Years | 0 (0.0%) | 0 (0.0%) |
| 16 and 17 Years | 0 (0.0%) | 0 (0.0%) |
| 18 to 24 Years | 19 (100.0%) | 42 (100.0%) |
| 25 to 34 Years | 0 (0.0%) | 0 (0.0%) |
| 35 to 44 Years | 0 (0.0%) | 14 (100.0%) |
| 45 to 54 Years | 13 (100.0%) | 40 (35.1%) |
| 55 to 64 Years | 16 (27.1%) | 52 (76.5%) |
| 65 to 74 Years | 14 (15.9%) | 171 (92.4%) |
| 75 Years and over | 18 (100.0%) | 36 (67.9%) |
| Total | 96 (37.9%) | 355 (67.7%) |
Income Below Poverty Among Married-Couple Families in Bajandas
The poverty statistics for married-couple families in Bajandas show that 39.0% or 30 of the total 77 families live below the poverty line. Families with 1 or 2 children have the highest poverty rate of 53.3%, comprising of 16 families. On the other hand, families with no children have the lowest poverty rate of 29.8%, which includes 14 families.
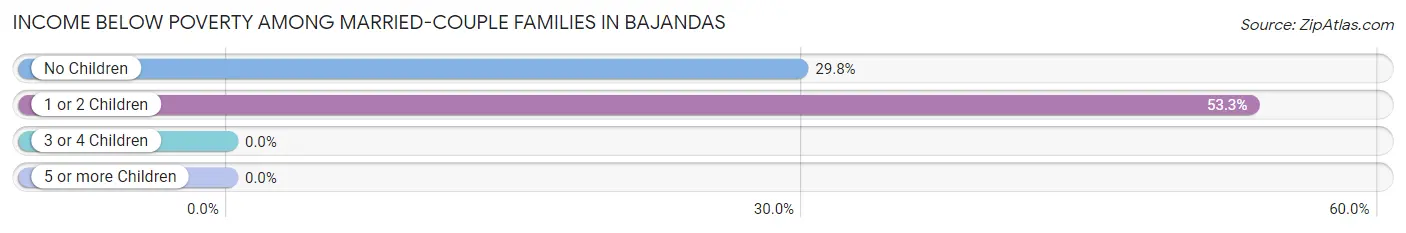
| Children | Above Poverty | Below Poverty |
| No Children | 33 (70.2%) | 14 (29.8%) |
| 1 or 2 Children | 14 (46.7%) | 16 (53.3%) |
| 3 or 4 Children | 0 (0.0%) | 0 (0.0%) |
| 5 or more Children | 0 (0.0%) | 0 (0.0%) |
| Total | 47 (61.0%) | 30 (39.0%) |
Income Below Poverty Among Single-Parent Households in Bajandas
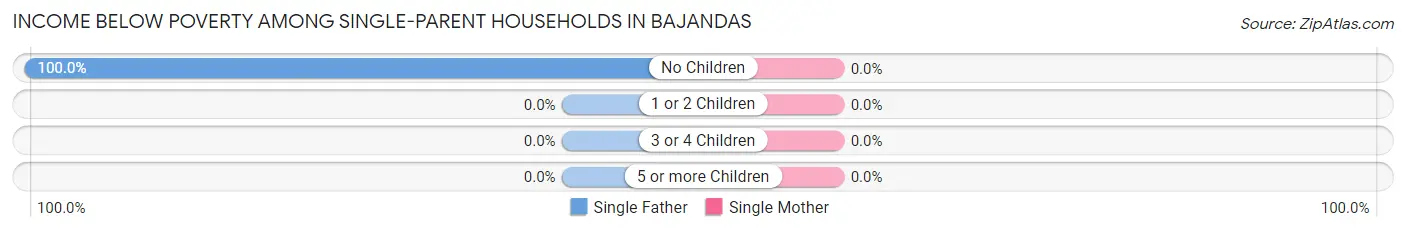
| Children | Single Father | Single Mother |
| No Children | 17 (100.0%) | 0 (0.0%) |
| 1 or 2 Children | 0 (0.0%) | 0 (0.0%) |
| 3 or 4 Children | 0 (0.0%) | 0 (0.0%) |
| 5 or more Children | 0 (0.0%) | 0 (0.0%) |
| Total | 17 (100.0%) | 0 (0.0%) |
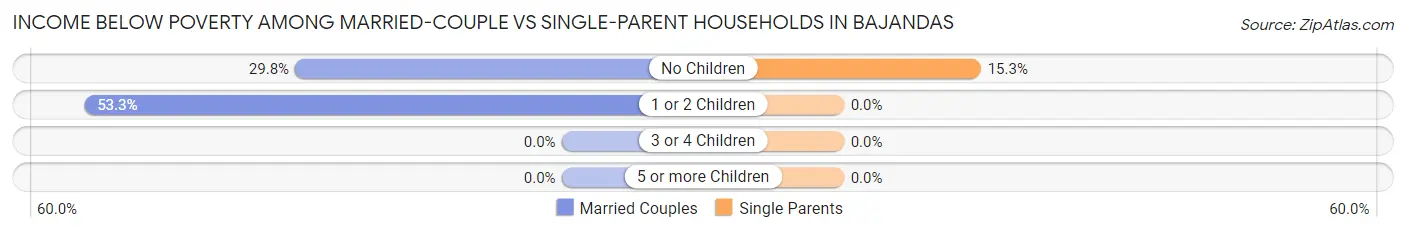
Income Below Poverty Among Married-Couple vs Single-Parent Households in Bajandas
The poverty data for Bajandas shows that 30 of the married-couple family households (39.0%) and 17 of the single-parent households (15.3%) are living below the poverty level. Within the married-couple family households, those with 1 or 2 children have the highest poverty rate, with 16 households (53.3%) falling below the poverty line. Among the single-parent households, those with no children have the highest poverty rate, with 17 household (15.3%) living below poverty.
| Children | Married-Couple Families | Single-Parent Households |
| No Children | 14 (29.8%) | 17 (15.3%) |
| 1 or 2 Children | 16 (53.3%) | 0 (0.0%) |
| 3 or 4 Children | 0 (0.0%) | 0 (0.0%) |
| 5 or more Children | 0 (0.0%) | 0 (0.0%) |
| Total | 30 (39.0%) | 17 (15.3%) |
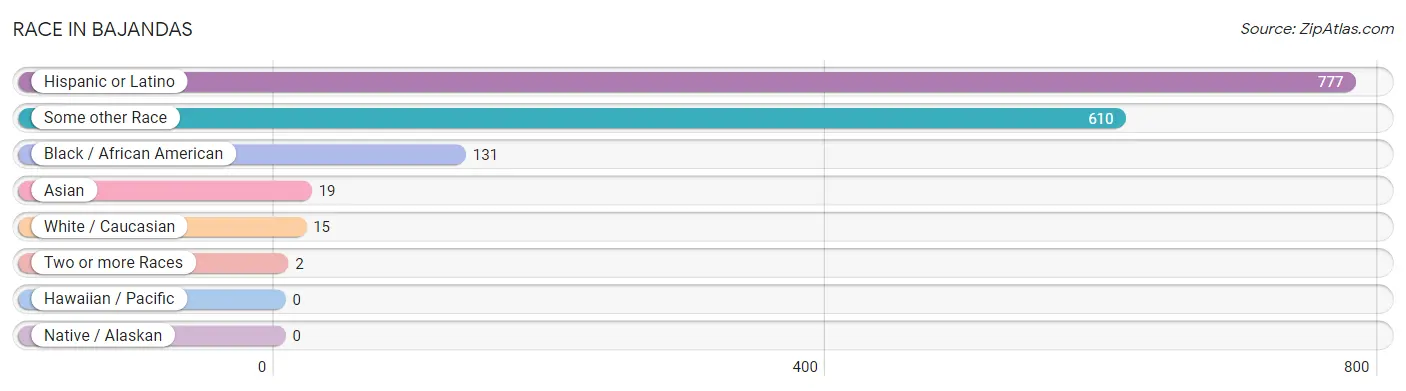
Race in Bajandas
The most populous races in Bajandas are Hispanic or Latino (777 | 100.0%), Some other Race (610 | 78.5%), and Black / African American (131 | 16.9%).
| Race | # Population | % Population |
| Asian | 19 | 2.5% |
| Black / African American | 131 | 16.9% |
| Hawaiian / Pacific | 0 | 0.0% |
| Hispanic or Latino | 777 | 100.0% |
| Native / Alaskan | 0 | 0.0% |
| White / Caucasian | 15 | 1.9% |
| Two or more Races | 2 | 0.3% |
| Some other Race | 610 | 78.5% |
| Total | 777 | 100.0% |
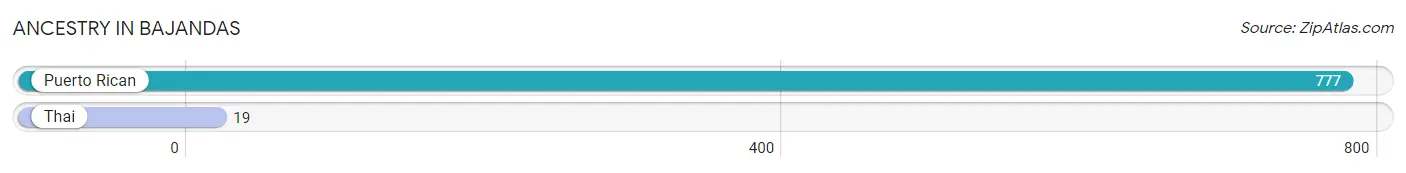
Ancestry in Bajandas
The most populous ancestries reported in Bajandas are Puerto Rican (777 | 100.0%), and Thai (19 | 2.5%), together accounting for 102.4% of all Bajandas residents.
| Ancestry | # Population | % Population |
| Puerto Rican | 777 | 100.0% |
| Thai | 19 | 2.5% | View All 2 Rows |
Immigrants in Bajandas

| Immigration Origin | # Population | % Population | View All 0 Rows |
Sex and Age in Bajandas
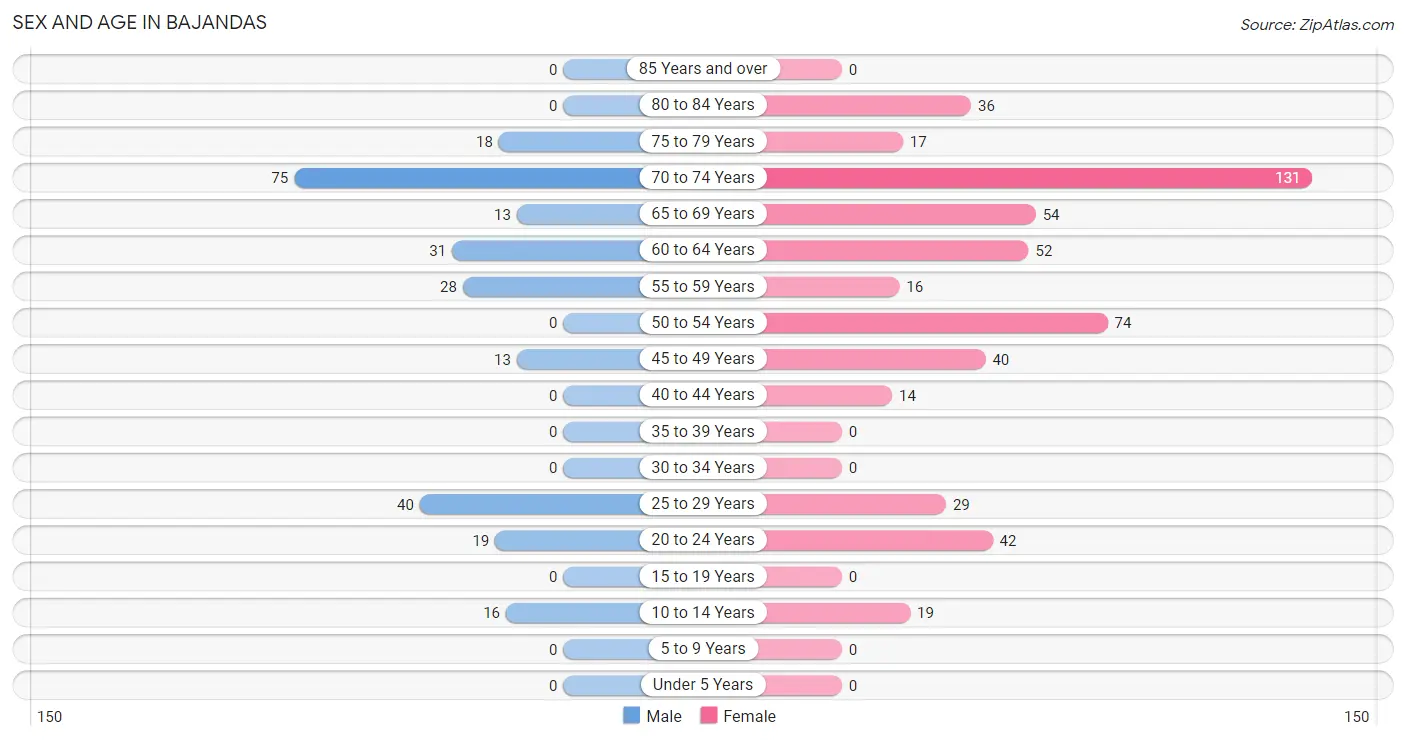
Sex and Age in Bajandas
The most populous age groups in Bajandas are 70 to 74 Years (75 | 29.6%) for men and 70 to 74 Years (131 | 25.0%) for women.
| Age Bracket | Male | Female |
| Under 5 Years | 0 (0.0%) | 0 (0.0%) |
| 5 to 9 Years | 0 (0.0%) | 0 (0.0%) |
| 10 to 14 Years | 16 (6.3%) | 19 (3.6%) |
| 15 to 19 Years | 0 (0.0%) | 0 (0.0%) |
| 20 to 24 Years | 19 (7.5%) | 42 (8.0%) |
| 25 to 29 Years | 40 (15.8%) | 29 (5.5%) |
| 30 to 34 Years | 0 (0.0%) | 0 (0.0%) |
| 35 to 39 Years | 0 (0.0%) | 0 (0.0%) |
| 40 to 44 Years | 0 (0.0%) | 14 (2.7%) |
| 45 to 49 Years | 13 (5.1%) | 40 (7.6%) |
| 50 to 54 Years | 0 (0.0%) | 74 (14.1%) |
| 55 to 59 Years | 28 (11.1%) | 16 (3.0%) |
| 60 to 64 Years | 31 (12.2%) | 52 (9.9%) |
| 65 to 69 Years | 13 (5.1%) | 54 (10.3%) |
| 70 to 74 Years | 75 (29.6%) | 131 (25.0%) |
| 75 to 79 Years | 18 (7.1%) | 17 (3.2%) |
| 80 to 84 Years | 0 (0.0%) | 36 (6.9%) |
| 85 Years and over | 0 (0.0%) | 0 (0.0%) |
| Total | 253 (100.0%) | 524 (100.0%) |
Families and Households in Bajandas
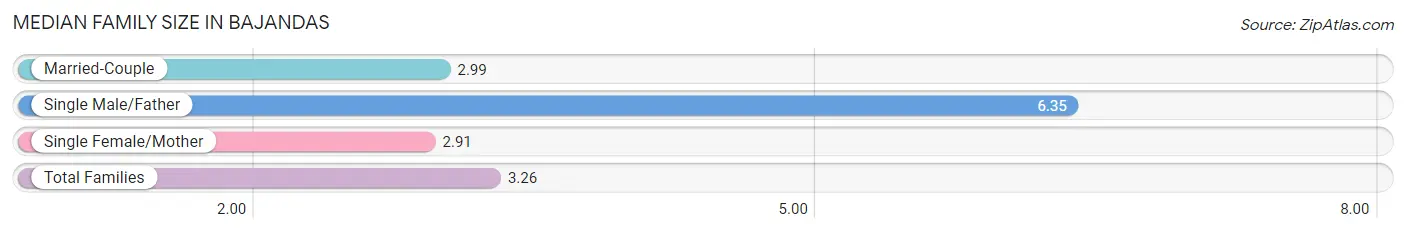
Median Family Size in Bajandas
The median family size in Bajandas is 3.26 persons per family, with single male/father families (17 | 9.0%) accounting for the largest median family size of 6.35 persons per family. On the other hand, single female/mother families (94 | 50.0%) represent the smallest median family size with 2.91 persons per family.
| Family Type | # Families | Family Size |
| Married-Couple | 77 (41.0%) | 2.99 |
| Single Male/Father | 17 (9.0%) | 6.35 |
| Single Female/Mother | 94 (50.0%) | 2.91 |
| Total Families | 188 (100.0%) | 3.26 |
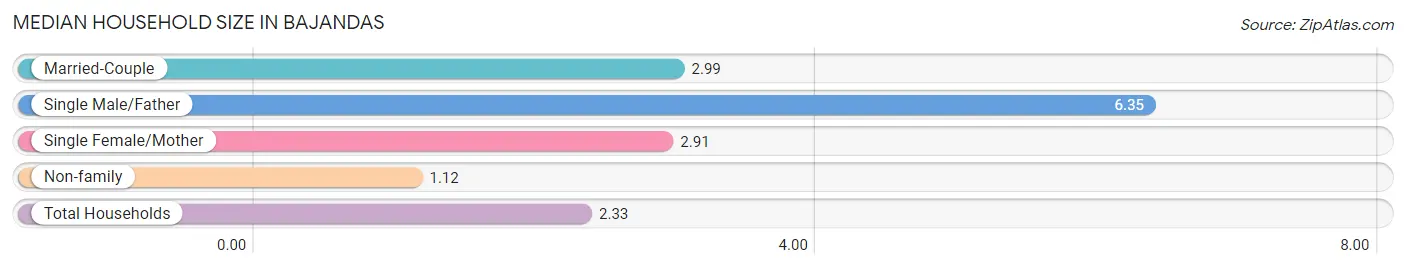
Median Household Size in Bajandas
The median household size in Bajandas is 2.33 persons per household, with single male/father households (17 | 5.1%) accounting for the largest median household size of 6.35 persons per household. non-family households (145 | 43.5%) represent the smallest median household size with 1.12 persons per household.
| Household Type | # Households | Household Size |
| Married-Couple | 77 (23.1%) | 2.99 |
| Single Male/Father | 17 (5.1%) | 6.35 |
| Single Female/Mother | 94 (28.2%) | 2.91 |
| Non-family | 145 (43.5%) | 1.12 |
| Total Households | 333 (100.0%) | 2.33 |
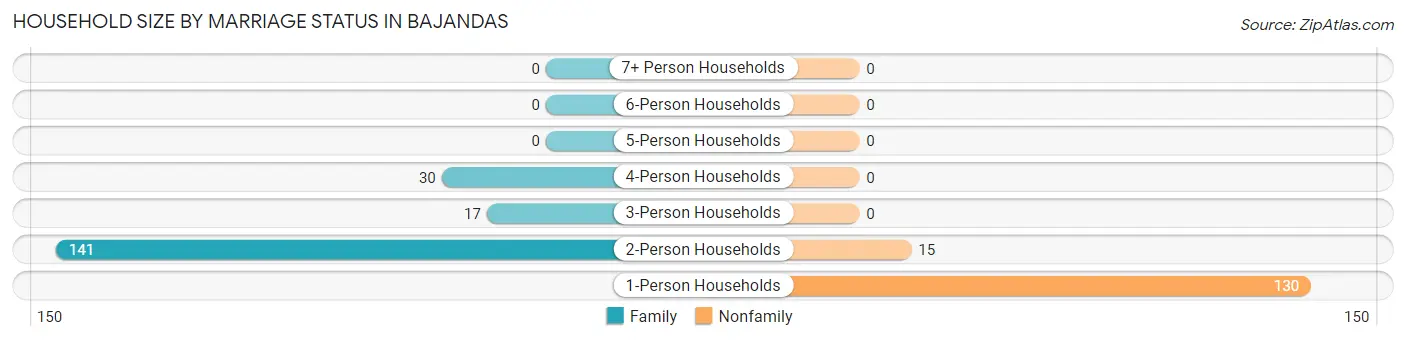
Household Size by Marriage Status in Bajandas
Out of a total of 333 households in Bajandas, 188 (56.5%) are family households, while 145 (43.5%) are nonfamily households. The most numerous type of family households are 2-person households, comprising 141, and the most common type of nonfamily households are 1-person households, comprising 130.
| Household Size | Family Households | Nonfamily Households |
| 1-Person Households | - | 130 (39.0%) |
| 2-Person Households | 141 (42.3%) | 15 (4.5%) |
| 3-Person Households | 17 (5.1%) | 0 (0.0%) |
| 4-Person Households | 30 (9.0%) | 0 (0.0%) |
| 5-Person Households | 0 (0.0%) | 0 (0.0%) |
| 6-Person Households | 0 (0.0%) | 0 (0.0%) |
| 7+ Person Households | 0 (0.0%) | 0 (0.0%) |
| Total | 188 (56.5%) | 145 (43.5%) |
Female Fertility in Bajandas
Fertility by Age in Bajandas
| Age Bracket | Women with Births | Births / 1,000 Women |
| 15 to 19 years | 0 (0.0%) | 0.0 |
| 20 to 34 years | 0 (0.0%) | 0.0 |
| 35 to 50 years | 0 (0.0%) | 0.0 |
| Total | 0 (0.0%) | 0.0 |
Fertility by Age by Marriage Status in Bajandas
| Age Bracket | Married | Unmarried |
| 15 to 19 years | 0 (0.0%) | 0 (0.0%) |
| 20 to 34 years | 0 (0.0%) | 0 (0.0%) |
| 35 to 50 years | 0 (0.0%) | 0 (0.0%) |
| Total | 0 (0.0%) | 0 (0.0%) |
Fertility by Education in Bajandas
| Educational Attainment | Women with Births | Births / 1,000 Women |
| Less than High School | 0 (0.0%) | 0.0 |
| High School Diploma | 0 (0.0%) | 0.0 |
| College or Associate's Degree | 0 (0.0%) | 0.0 |
| Bachelor's Degree | 0 (0.0%) | 0.0 |
| Graduate Degree | 0 (0.0%) | 0.0 |
| Total | 0 (0.0%) | 0.0 |
Fertility by Education by Marriage Status in Bajandas
| Educational Attainment | Married | Unmarried |
| Less than High School | 0 (0.0%) | 0 (0.0%) |
| High School Diploma | 0 (0.0%) | 0 (0.0%) |
| College or Associate's Degree | 0 (0.0%) | 0 (0.0%) |
| Bachelor's Degree | 0 (0.0%) | 0 (0.0%) |
| Graduate Degree | 0 (0.0%) | 0 (0.0%) |
| Total | 0 (0.0%) | 0 (0.0%) |
Employment Characteristics in Bajandas
Employment by Class of Employer in Bajandas
Among the 117 employed individuals in Bajandas, self-employed (not incorporated) (88 | 75.2%), private company employees (27 | 23.1%), and not-for-profit organizations (2 | 1.7%) make up the most common classes of employment.
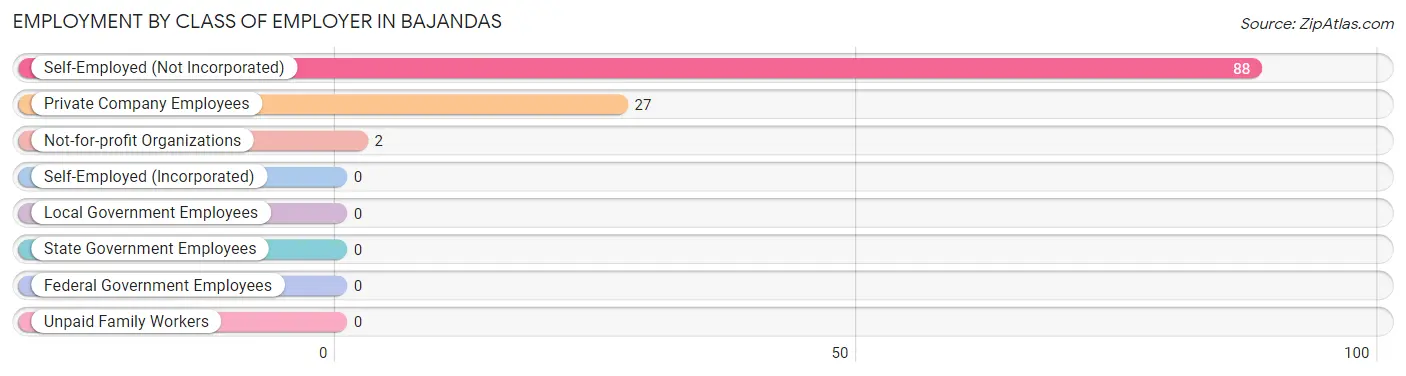
| Employer Class | # Employees | % Employees |
| Private Company Employees | 27 | 23.1% |
| Self-Employed (Incorporated) | 0 | 0.0% |
| Self-Employed (Not Incorporated) | 88 | 75.2% |
| Not-for-profit Organizations | 2 | 1.7% |
| Local Government Employees | 0 | 0.0% |
| State Government Employees | 0 | 0.0% |
| Federal Government Employees | 0 | 0.0% |
| Unpaid Family Workers | 0 | 0.0% |
| Total | 117 | 100.0% |
Employment Status by Age in Bajandas
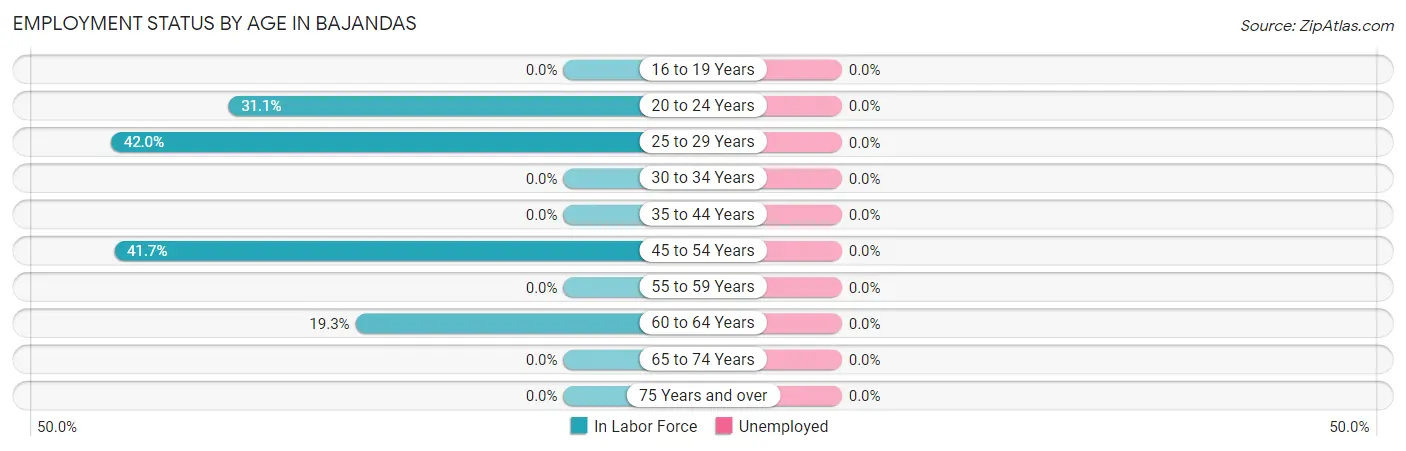
| Age Bracket | In Labor Force | Unemployed |
| 16 to 19 Years | 0 (0.0%) | 0 (0.0%) |
| 20 to 24 Years | 19 (31.1%) | 0 (0.0%) |
| 25 to 29 Years | 29 (42.0%) | 0 (0.0%) |
| 30 to 34 Years | 0 (0.0%) | 0 (0.0%) |
| 35 to 44 Years | 0 (0.0%) | 0 (0.0%) |
| 45 to 54 Years | 53 (41.7%) | 0 (0.0%) |
| 55 to 59 Years | 0 (0.0%) | 0 (0.0%) |
| 60 to 64 Years | 16 (19.3%) | 0 (0.0%) |
| 65 to 74 Years | 0 (0.0%) | 0 (0.0%) |
| 75 Years and over | 0 (0.0%) | 0 (0.0%) |
| Total | 117 (15.8%) | 0 (0.0%) |
Employment Status by Educational Attainment in Bajandas
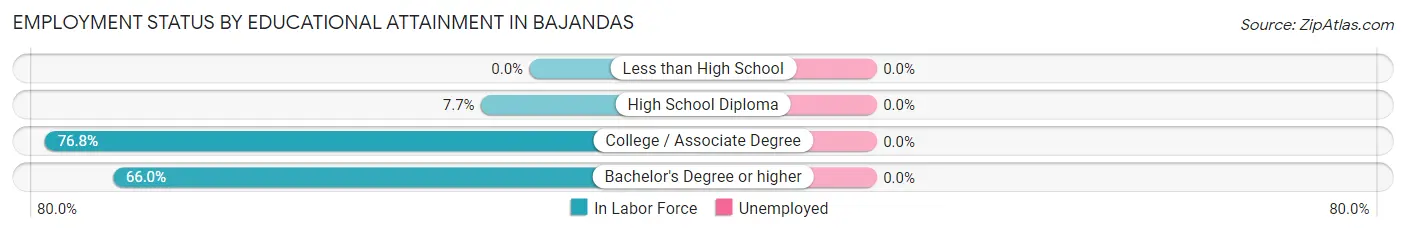
| Educational Attainment | In Labor Force | Unemployed |
| Less than High School | 0 (0.0%) | 0 (0.0%) |
| High School Diploma | 14 (7.7%) | 0 (0.0%) |
| College / Associate Degree | 53 (76.8%) | 0 (0.0%) |
| Bachelor's Degree or higher | 31 (66.0%) | 0 (0.0%) |
| Total | 98 (29.1%) | 0 (0.0%) |
Employment Occupations by Sex in Bajandas
Management, Business, Science and Arts Occupations
The most common Management, Business, Science and Arts occupations in Bajandas are Management (29 | 24.8%), Community & Social Service (2 | 1.7%), and Education, Arts & Media (2 | 1.7%).
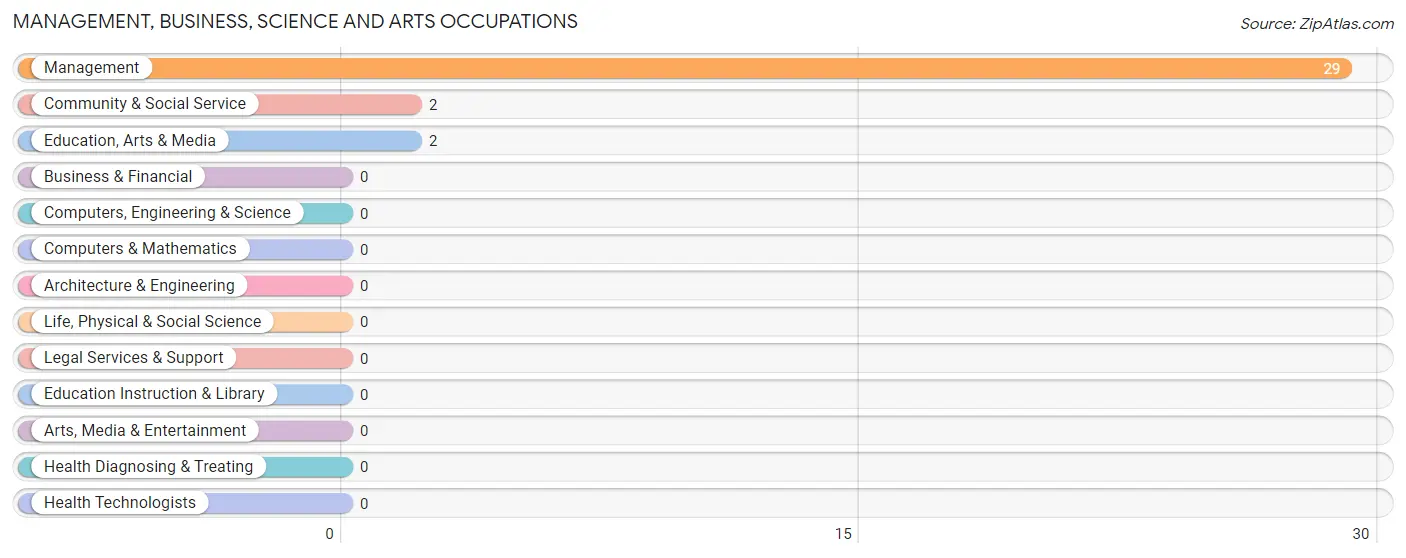
Management, Business, Science and Arts Occupations by Sex
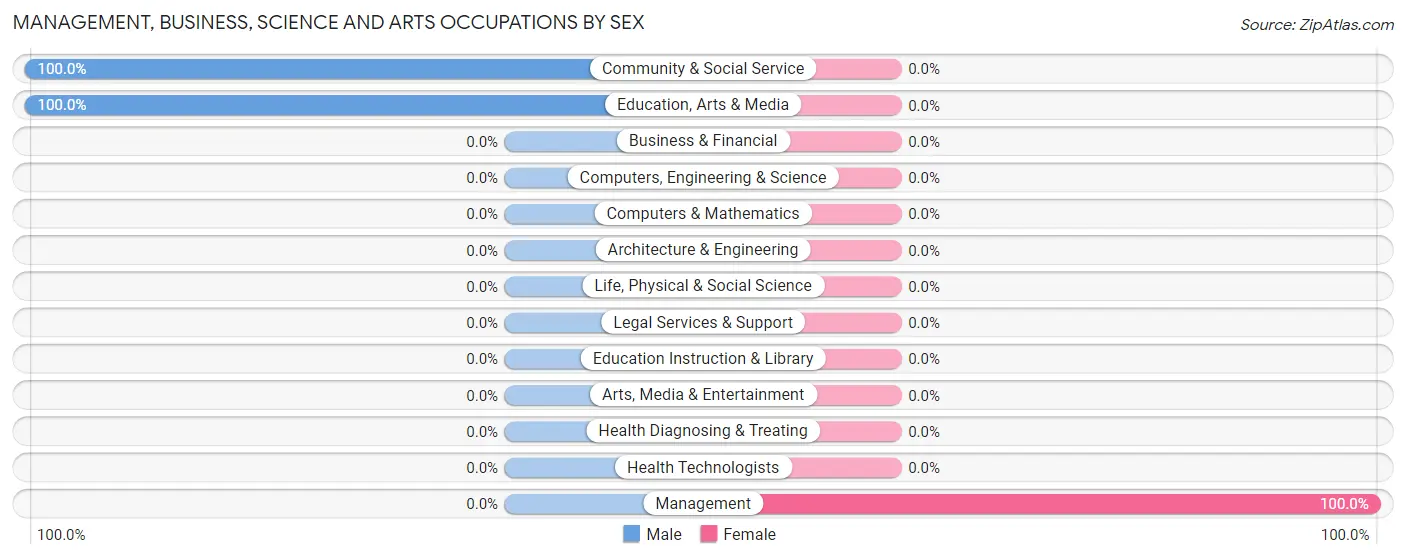
| Occupation | Male | Female |
| Management | 0 (0.0%) | 29 (100.0%) |
| Business & Financial | 0 (0.0%) | 0 (0.0%) |
| Computers, Engineering & Science | 0 (0.0%) | 0 (0.0%) |
| Computers & Mathematics | 0 (0.0%) | 0 (0.0%) |
| Architecture & Engineering | 0 (0.0%) | 0 (0.0%) |
| Life, Physical & Social Science | 0 (0.0%) | 0 (0.0%) |
| Community & Social Service | 2 (100.0%) | 0 (0.0%) |
| Education, Arts & Media | 2 (100.0%) | 0 (0.0%) |
| Legal Services & Support | 0 (0.0%) | 0 (0.0%) |
| Education Instruction & Library | 0 (0.0%) | 0 (0.0%) |
| Arts, Media & Entertainment | 0 (0.0%) | 0 (0.0%) |
| Health Diagnosing & Treating | 0 (0.0%) | 0 (0.0%) |
| Health Technologists | 0 (0.0%) | 0 (0.0%) |
| Total (Category) | 2 (6.5%) | 29 (93.5%) |
| Total (Overall) | 48 (41.0%) | 69 (59.0%) |
Services Occupations
The most common Services occupations in Bajandas are , and Healthcare Support (40 | 34.2%).
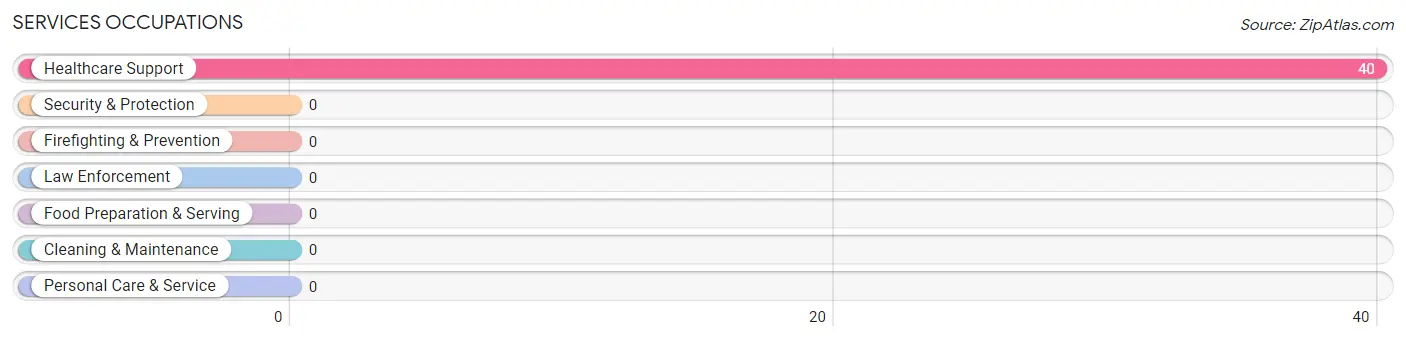
Services Occupations by Sex
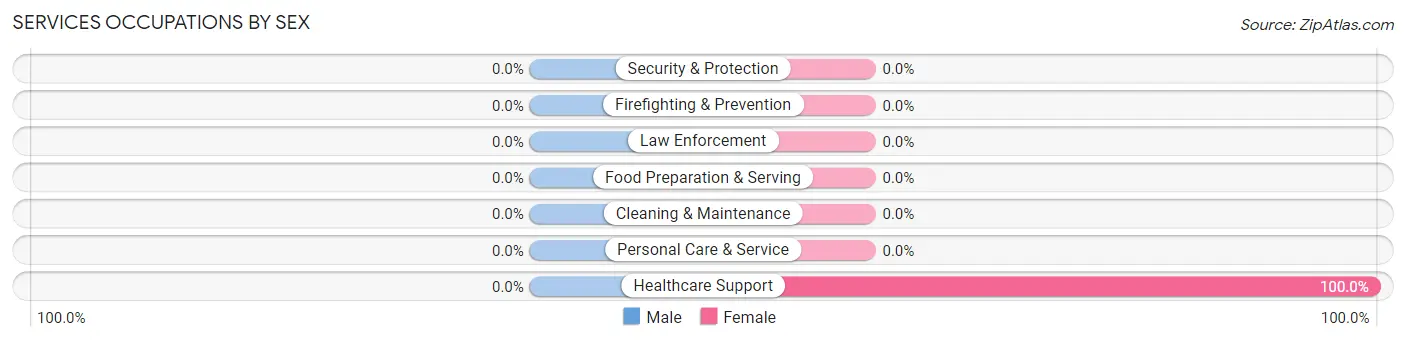
| Occupation | Male | Female |
| Healthcare Support | 0 (0.0%) | 40 (100.0%) |
| Security & Protection | 0 (0.0%) | 0 (0.0%) |
| Firefighting & Prevention | 0 (0.0%) | 0 (0.0%) |
| Law Enforcement | 0 (0.0%) | 0 (0.0%) |
| Food Preparation & Serving | 0 (0.0%) | 0 (0.0%) |
| Cleaning & Maintenance | 0 (0.0%) | 0 (0.0%) |
| Personal Care & Service | 0 (0.0%) | 0 (0.0%) |
| Total (Category) | 0 (0.0%) | 40 (100.0%) |
| Total (Overall) | 48 (41.0%) | 69 (59.0%) |
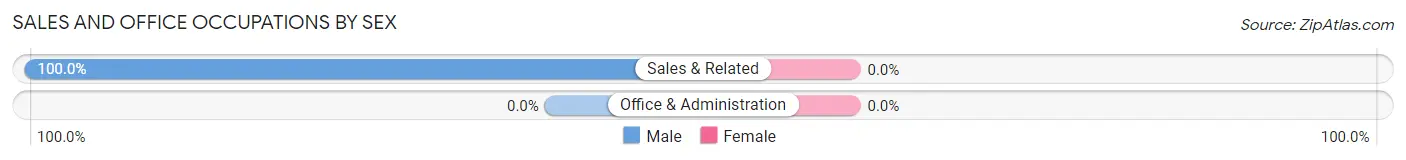
Sales and Office Occupations
The most common Sales and Office occupations in Bajandas are , and Sales & Related (14 | 12.0%).
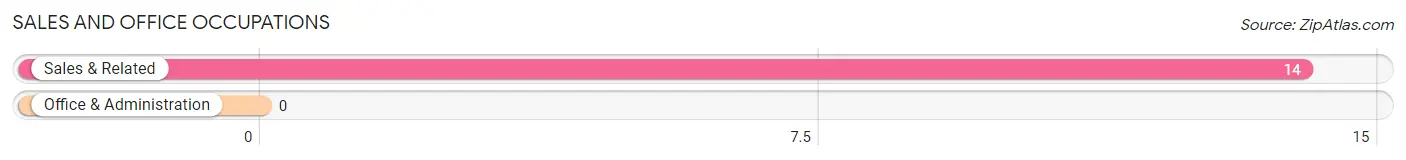
Sales and Office Occupations by Sex
| Occupation | Male | Female |
| Sales & Related | 14 (100.0%) | 0 (0.0%) |
| Office & Administration | 0 (0.0%) | 0 (0.0%) |
| Total (Category) | 14 (100.0%) | 0 (0.0%) |
| Total (Overall) | 48 (41.0%) | 69 (59.0%) |
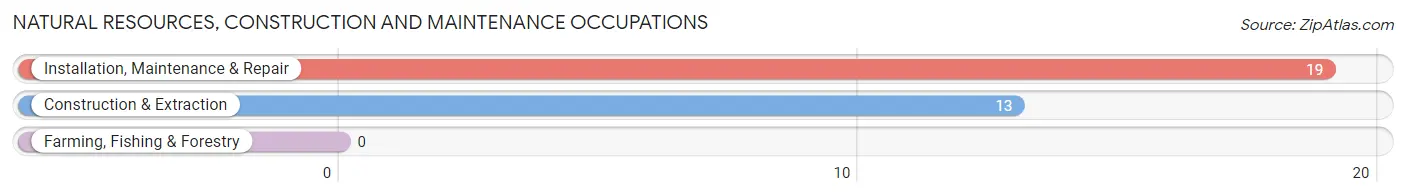
Natural Resources, Construction and Maintenance Occupations
The most common Natural Resources, Construction and Maintenance occupations in Bajandas are Installation, Maintenance & Repair (19 | 16.2%), and Construction & Extraction (13 | 11.1%).
Natural Resources, Construction and Maintenance Occupations by Sex
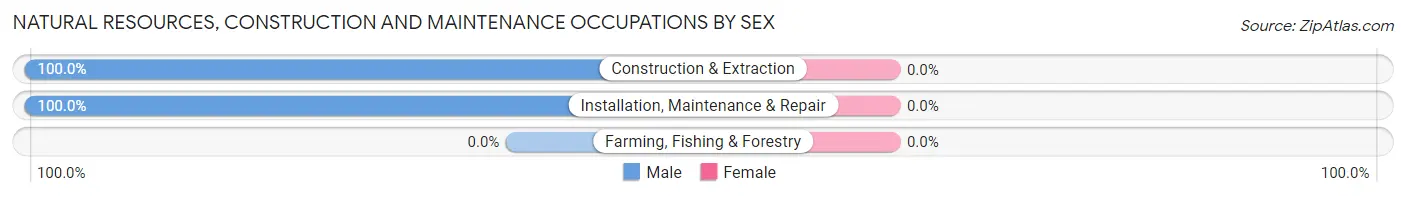
| Occupation | Male | Female |
| Farming, Fishing & Forestry | 0 (0.0%) | 0 (0.0%) |
| Construction & Extraction | 13 (100.0%) | 0 (0.0%) |
| Installation, Maintenance & Repair | 19 (100.0%) | 0 (0.0%) |
| Total (Category) | 32 (100.0%) | 0 (0.0%) |
| Total (Overall) | 48 (41.0%) | 69 (59.0%) |
Production, Transportation and Moving Occupations
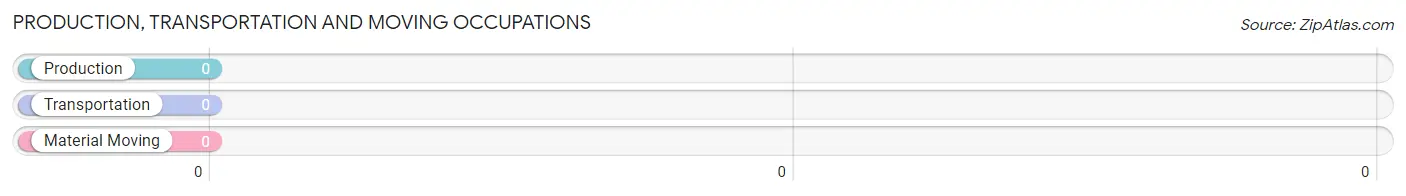
Production, Transportation and Moving Occupations by Sex
| Occupation | Male | Female |
| Production | 0 (0.0%) | 0 (0.0%) |
| Transportation | 0 (0.0%) | 0 (0.0%) |
| Material Moving | 0 (0.0%) | 0 (0.0%) |
| Total (Category) | 0 (0.0%) | 0 (0.0%) |
| Total (Overall) | 48 (41.0%) | 69 (59.0%) |
Employment Industries by Sex in Bajandas
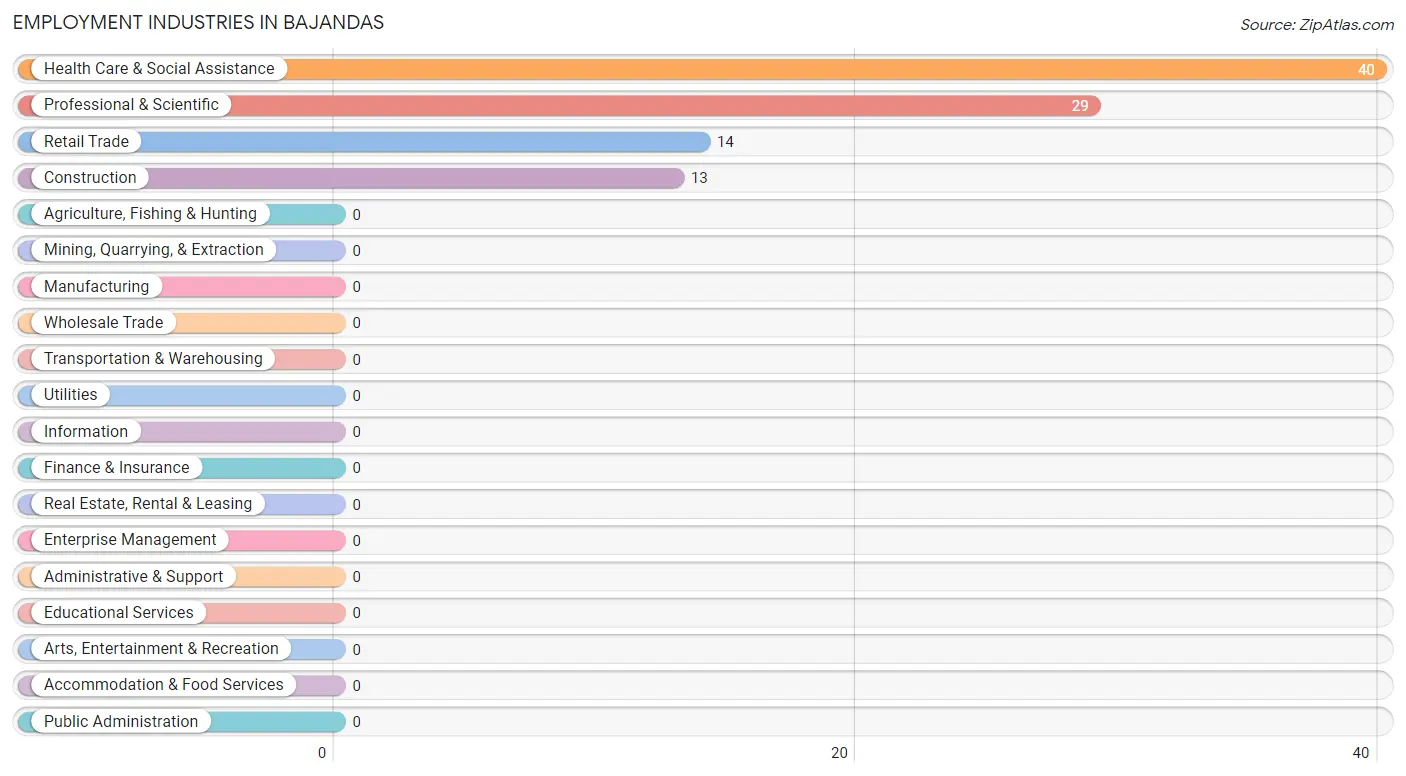
Employment Industries in Bajandas
The major employment industries in Bajandas include Health Care & Social Assistance (40 | 34.2%), Professional & Scientific (29 | 24.8%), Retail Trade (14 | 12.0%), and Construction (13 | 11.1%).
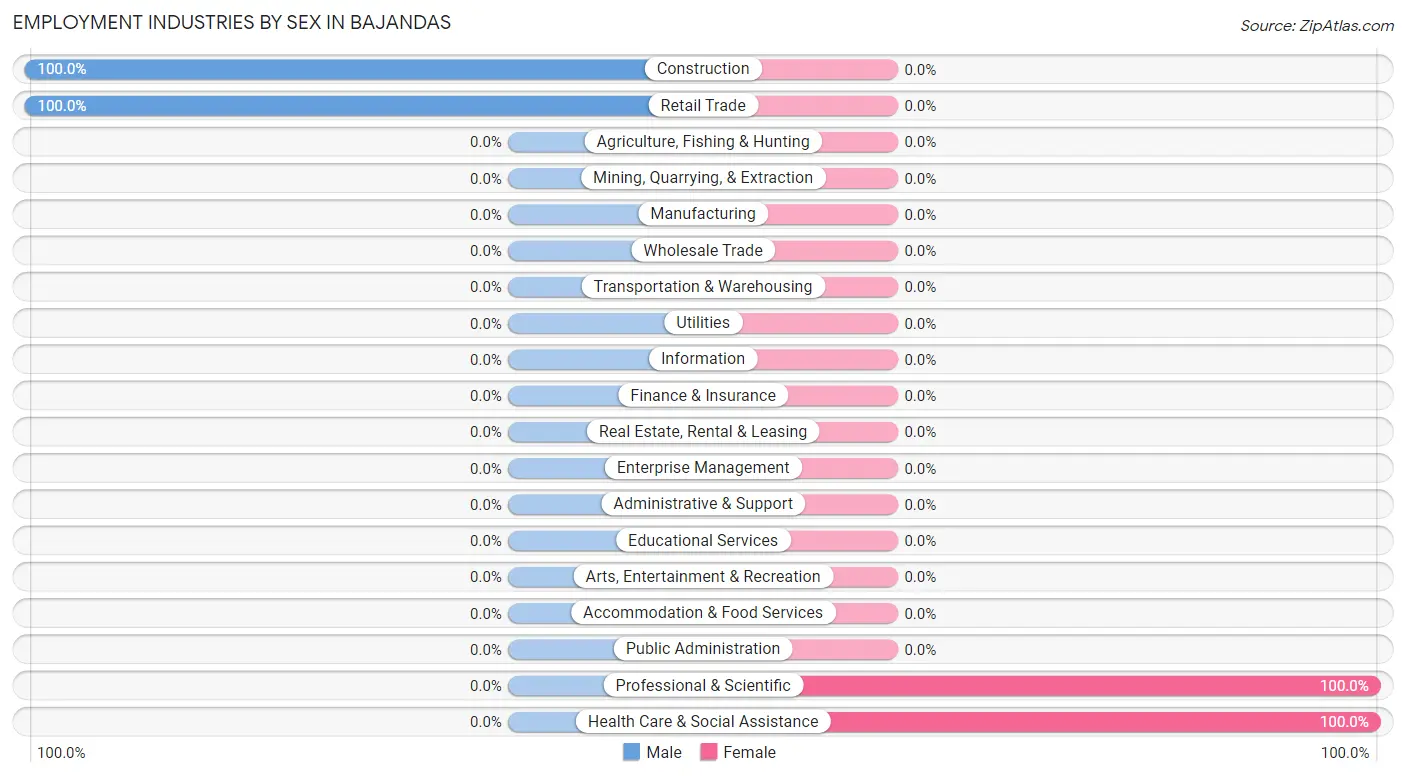
Employment Industries by Sex in Bajandas
The Bajandas industries that see more men than women are Construction (100.0%), and Retail Trade (100.0%), whereas the industries that tend to have a higher number of women are Professional & Scientific (100.0%), and Health Care & Social Assistance (100.0%).
| Industry | Male | Female |
| Agriculture, Fishing & Hunting | 0 (0.0%) | 0 (0.0%) |
| Mining, Quarrying, & Extraction | 0 (0.0%) | 0 (0.0%) |
| Construction | 13 (100.0%) | 0 (0.0%) |
| Manufacturing | 0 (0.0%) | 0 (0.0%) |
| Wholesale Trade | 0 (0.0%) | 0 (0.0%) |
| Retail Trade | 14 (100.0%) | 0 (0.0%) |
| Transportation & Warehousing | 0 (0.0%) | 0 (0.0%) |
| Utilities | 0 (0.0%) | 0 (0.0%) |
| Information | 0 (0.0%) | 0 (0.0%) |
| Finance & Insurance | 0 (0.0%) | 0 (0.0%) |
| Real Estate, Rental & Leasing | 0 (0.0%) | 0 (0.0%) |
| Professional & Scientific | 0 (0.0%) | 29 (100.0%) |
| Enterprise Management | 0 (0.0%) | 0 (0.0%) |
| Administrative & Support | 0 (0.0%) | 0 (0.0%) |
| Educational Services | 0 (0.0%) | 0 (0.0%) |
| Health Care & Social Assistance | 0 (0.0%) | 40 (100.0%) |
| Arts, Entertainment & Recreation | 0 (0.0%) | 0 (0.0%) |
| Accommodation & Food Services | 0 (0.0%) | 0 (0.0%) |
| Public Administration | 0 (0.0%) | 0 (0.0%) |
| Total | 48 (41.0%) | 69 (59.0%) |
Education in Bajandas
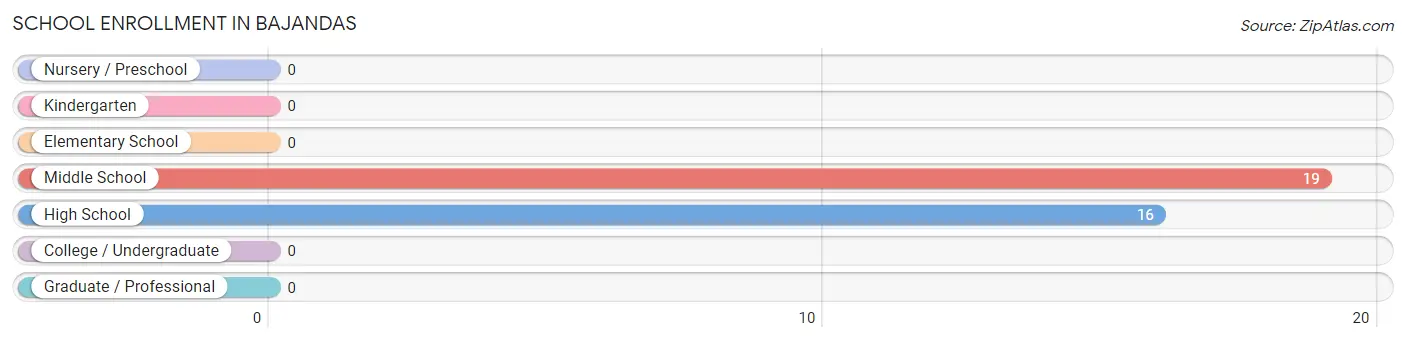
School Enrollment in Bajandas
The most common levels of schooling among the 35 students in Bajandas are middle school (19 | 54.3%), and high school (16 | 45.7%).
| School Level | # Students | % Students |
| Nursery / Preschool | 0 | 0.0% |
| Kindergarten | 0 | 0.0% |
| Elementary School | 0 | 0.0% |
| Middle School | 19 | 54.3% |
| High School | 16 | 45.7% |
| College / Undergraduate | 0 | 0.0% |
| Graduate / Professional | 0 | 0.0% |
| Total | 35 | 100.0% |
School Enrollment by Age by Funding Source in Bajandas
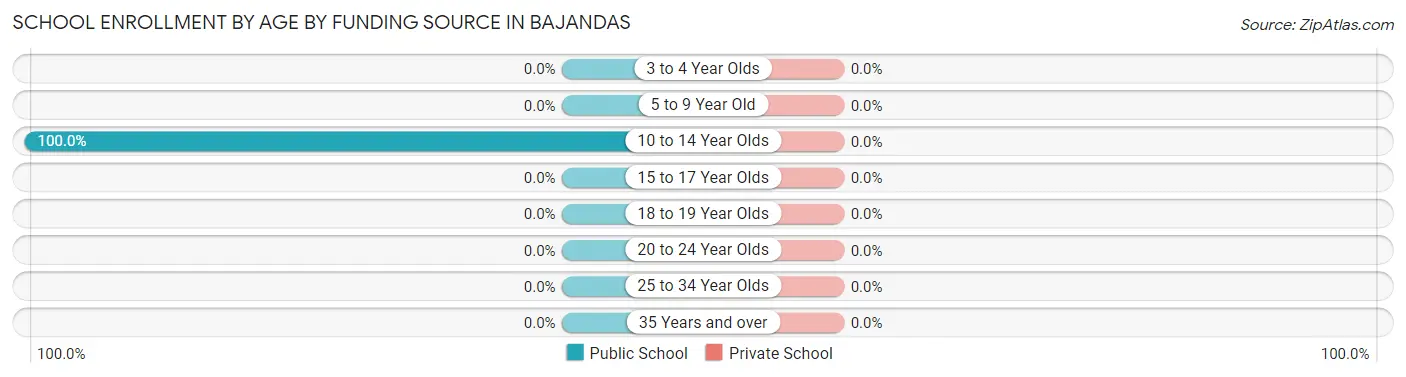
| Age Bracket | Public School | Private School |
| 3 to 4 Year Olds | 0 (0.0%) | 0 (0.0%) |
| 5 to 9 Year Old | 0 (0.0%) | 0 (0.0%) |
| 10 to 14 Year Olds | 35 (100.0%) | 0 (0.0%) |
| 15 to 17 Year Olds | 0 (0.0%) | 0 (0.0%) |
| 18 to 19 Year Olds | 0 (0.0%) | 0 (0.0%) |
| 20 to 24 Year Olds | 0 (0.0%) | 0 (0.0%) |
| 25 to 34 Year Olds | 0 (0.0%) | 0 (0.0%) |
| 35 Years and over | 0 (0.0%) | 0 (0.0%) |
| Total | 35 (100.0%) | 0 (0.0%) |
Educational Attainment by Field of Study in Bajandas
Business (85 | 97.7%), and liberal arts & history (2 | 2.3%) are the most common fields of study among 87 individuals in Bajandas who have obtained a bachelor's degree or higher.
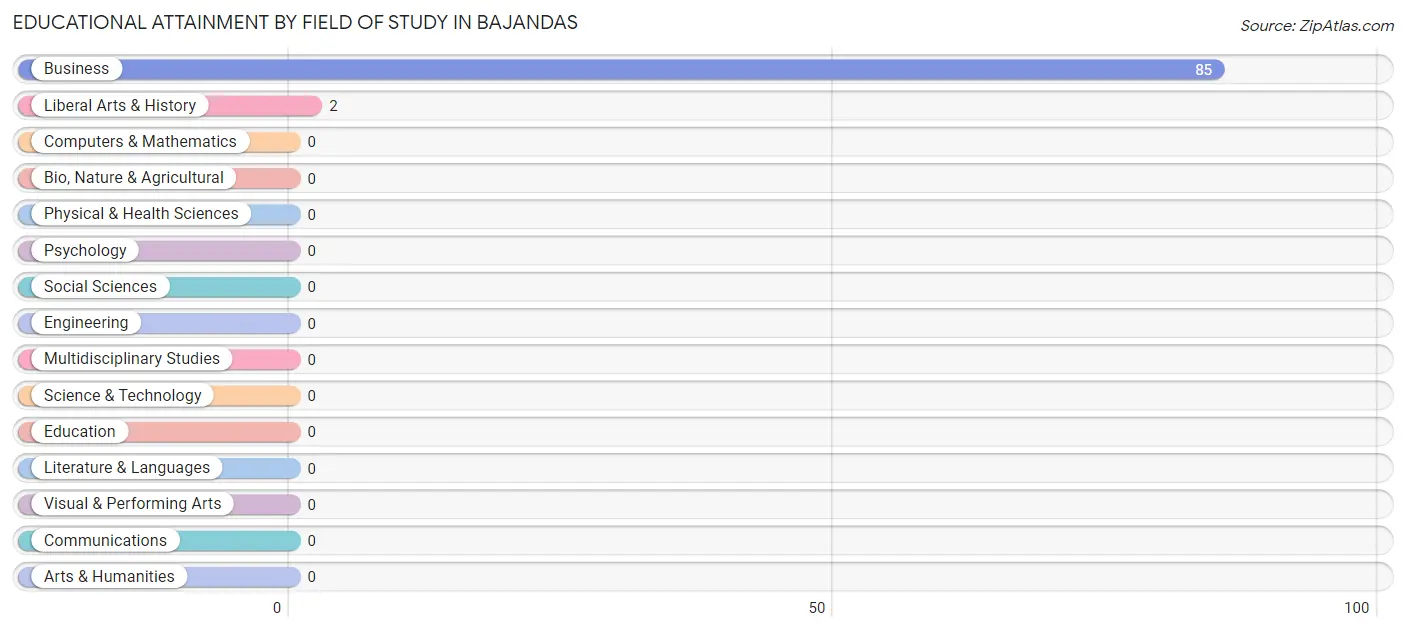
| Field of Study | # Graduates | % Graduates |
| Computers & Mathematics | 0 | 0.0% |
| Bio, Nature & Agricultural | 0 | 0.0% |
| Physical & Health Sciences | 0 | 0.0% |
| Psychology | 0 | 0.0% |
| Social Sciences | 0 | 0.0% |
| Engineering | 0 | 0.0% |
| Multidisciplinary Studies | 0 | 0.0% |
| Science & Technology | 0 | 0.0% |
| Business | 85 | 97.7% |
| Education | 0 | 0.0% |
| Literature & Languages | 0 | 0.0% |
| Liberal Arts & History | 2 | 2.3% |
| Visual & Performing Arts | 0 | 0.0% |
| Communications | 0 | 0.0% |
| Arts & Humanities | 0 | 0.0% |
| Total | 87 | 100.0% |
Transportation & Commute in Bajandas
Vehicle Availability by Sex in Bajandas
The most prevalent vehicle ownership categories in Bajandas are males with 3 vehicles (32, accounting for 69.6%) and females with 3 vehicles (29, making up 46.4%).
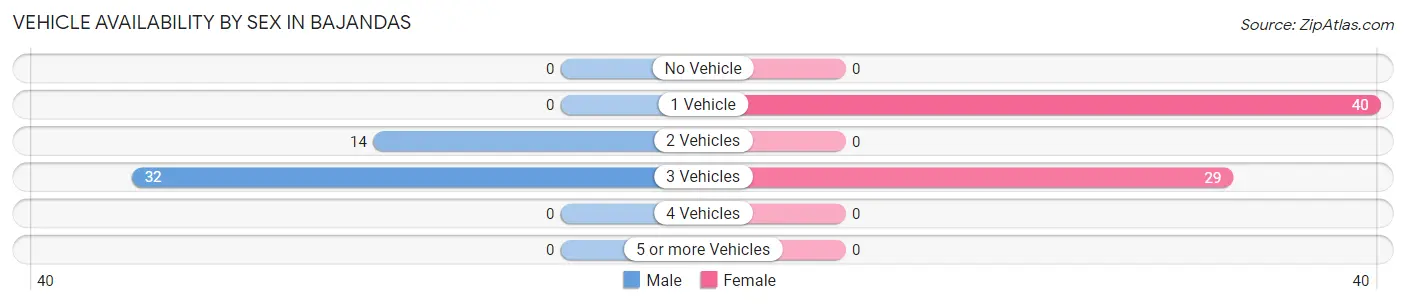
| Vehicles Available | Male | Female |
| No Vehicle | 0 (0.0%) | 0 (0.0%) |
| 1 Vehicle | 0 (0.0%) | 40 (58.0%) |
| 2 Vehicles | 14 (30.4%) | 0 (0.0%) |
| 3 Vehicles | 32 (69.6%) | 29 (42.0%) |
| 4 Vehicles | 0 (0.0%) | 0 (0.0%) |
| 5 or more Vehicles | 0 (0.0%) | 0 (0.0%) |
| Total | 46 (100.0%) | 69 (100.0%) |
Commute Time in Bajandas
The most frequently occuring commute durations in Bajandas are 25 to 29 minutes (53 commuters, 54.1%), 20 to 24 minutes (43 commuters, 43.9%), and less than 5 minutes (2 commuters, 2.0%).
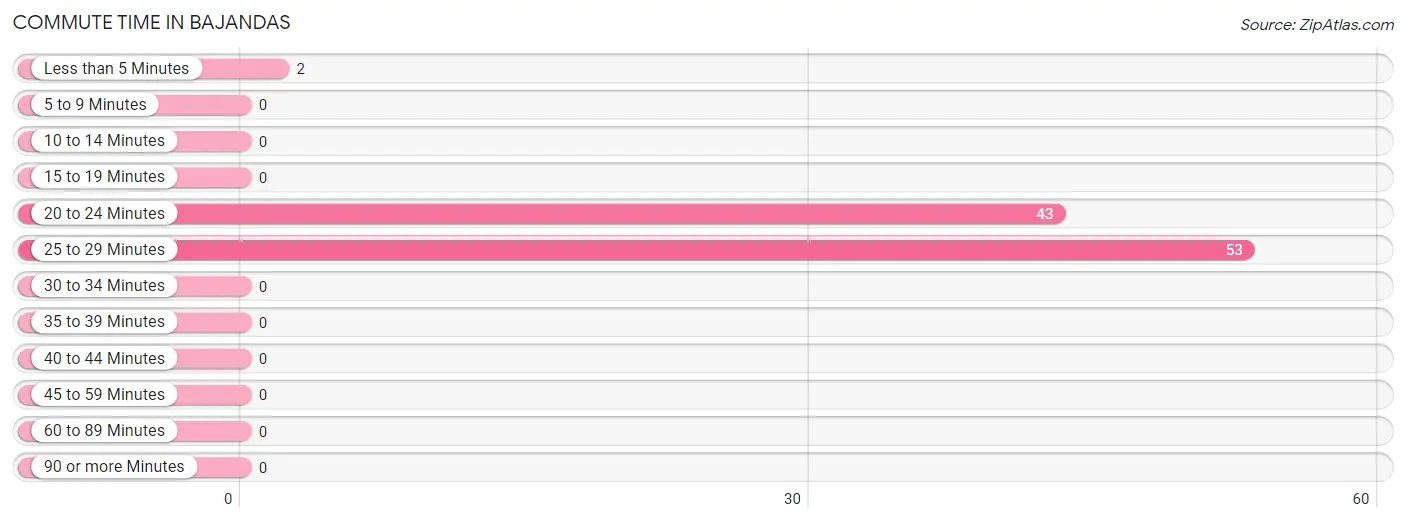
| Commute Time | # Commuters | % Commuters |
| Less than 5 Minutes | 2 | 2.0% |
| 5 to 9 Minutes | 0 | 0.0% |
| 10 to 14 Minutes | 0 | 0.0% |
| 15 to 19 Minutes | 0 | 0.0% |
| 20 to 24 Minutes | 43 | 43.9% |
| 25 to 29 Minutes | 53 | 54.1% |
| 30 to 34 Minutes | 0 | 0.0% |
| 35 to 39 Minutes | 0 | 0.0% |
| 40 to 44 Minutes | 0 | 0.0% |
| 45 to 59 Minutes | 0 | 0.0% |
| 60 to 89 Minutes | 0 | 0.0% |
| 90 or more Minutes | 0 | 0.0% |
Commute Time by Sex in Bajandas
The most common commute times in Bajandas are 20 to 24 minutes (14 commuters, 48.3%) for males and 25 to 29 minutes (40 commuters, 58.0%) for females.
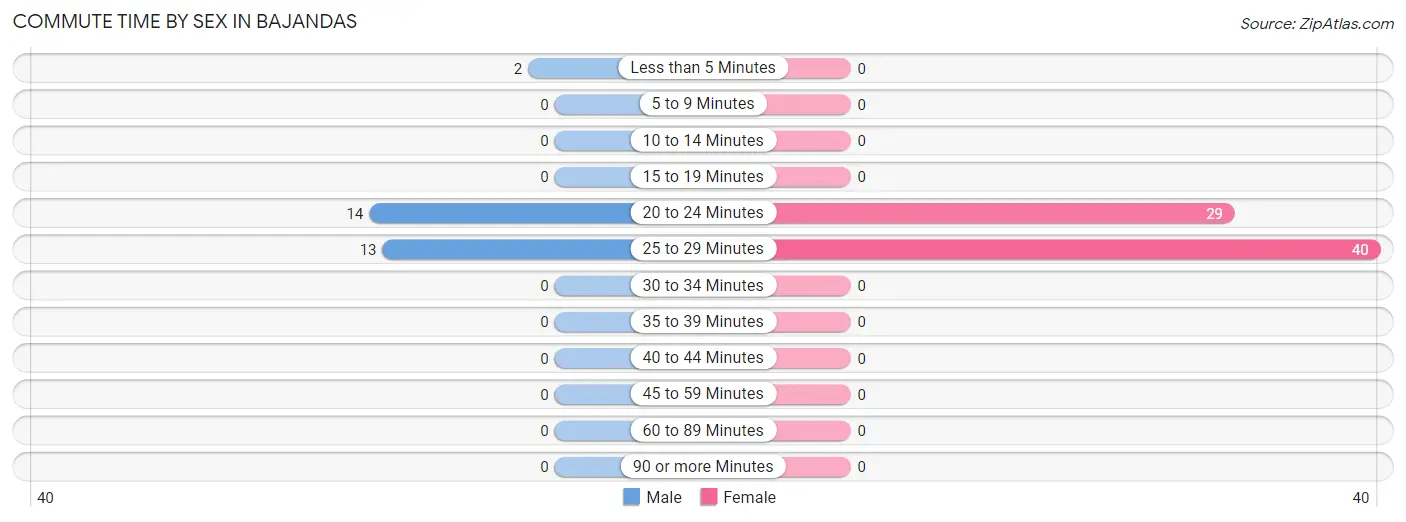
| Commute Time | Male | Female |
| Less than 5 Minutes | 2 (6.9%) | 0 (0.0%) |
| 5 to 9 Minutes | 0 (0.0%) | 0 (0.0%) |
| 10 to 14 Minutes | 0 (0.0%) | 0 (0.0%) |
| 15 to 19 Minutes | 0 (0.0%) | 0 (0.0%) |
| 20 to 24 Minutes | 14 (48.3%) | 29 (42.0%) |
| 25 to 29 Minutes | 13 (44.8%) | 40 (58.0%) |
| 30 to 34 Minutes | 0 (0.0%) | 0 (0.0%) |
| 35 to 39 Minutes | 0 (0.0%) | 0 (0.0%) |
| 40 to 44 Minutes | 0 (0.0%) | 0 (0.0%) |
| 45 to 59 Minutes | 0 (0.0%) | 0 (0.0%) |
| 60 to 89 Minutes | 0 (0.0%) | 0 (0.0%) |
| 90 or more Minutes | 0 (0.0%) | 0 (0.0%) |
Time of Departure to Work by Sex in Bajandas
The most frequent times of departure to work in Bajandas are 12:00 AM to 4:59 AM (14, 48.3%) for males and 8:00 AM to 8:29 AM (69, 100.0%) for females.
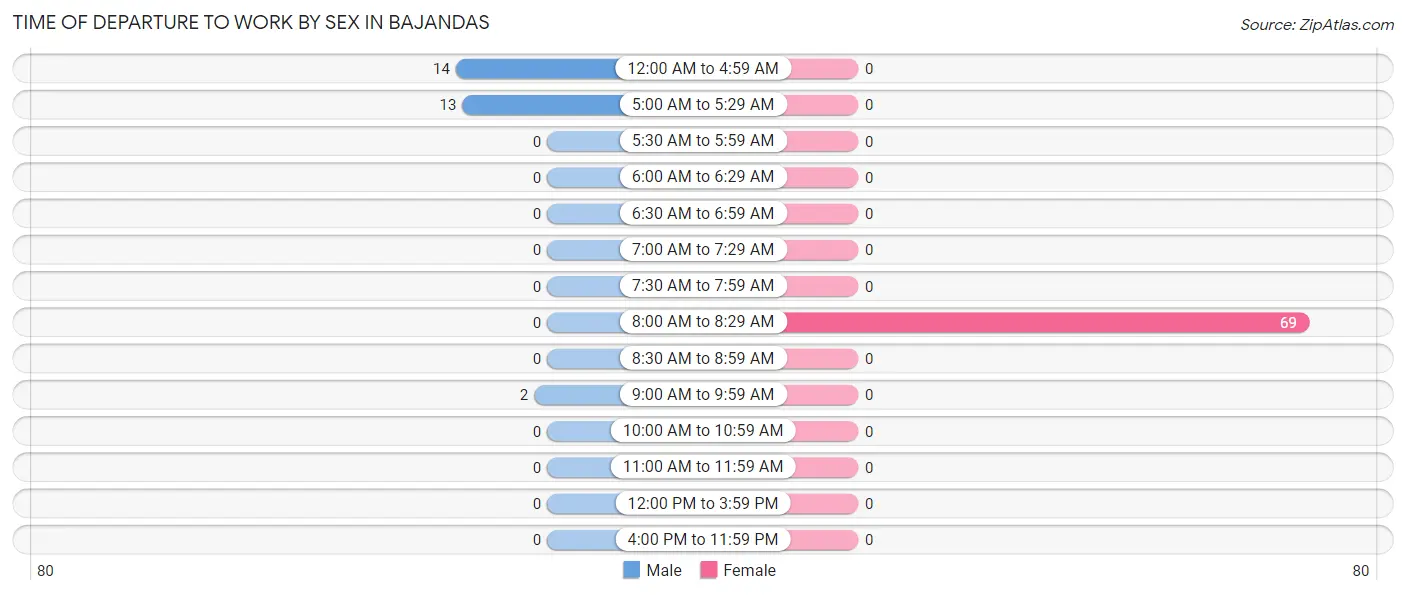
| Time of Departure | Male | Female |
| 12:00 AM to 4:59 AM | 14 (48.3%) | 0 (0.0%) |
| 5:00 AM to 5:29 AM | 13 (44.8%) | 0 (0.0%) |
| 5:30 AM to 5:59 AM | 0 (0.0%) | 0 (0.0%) |
| 6:00 AM to 6:29 AM | 0 (0.0%) | 0 (0.0%) |
| 6:30 AM to 6:59 AM | 0 (0.0%) | 0 (0.0%) |
| 7:00 AM to 7:29 AM | 0 (0.0%) | 0 (0.0%) |
| 7:30 AM to 7:59 AM | 0 (0.0%) | 0 (0.0%) |
| 8:00 AM to 8:29 AM | 0 (0.0%) | 69 (100.0%) |
| 8:30 AM to 8:59 AM | 0 (0.0%) | 0 (0.0%) |
| 9:00 AM to 9:59 AM | 2 (6.9%) | 0 (0.0%) |
| 10:00 AM to 10:59 AM | 0 (0.0%) | 0 (0.0%) |
| 11:00 AM to 11:59 AM | 0 (0.0%) | 0 (0.0%) |
| 12:00 PM to 3:59 PM | 0 (0.0%) | 0 (0.0%) |
| 4:00 PM to 11:59 PM | 0 (0.0%) | 0 (0.0%) |
| Total | 29 (100.0%) | 69 (100.0%) |
Housing Occupancy in Bajandas
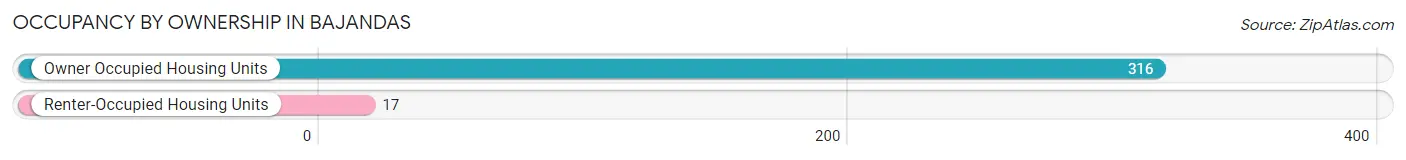
Occupancy by Ownership in Bajandas
Of the total 333 dwellings in Bajandas, owner-occupied units account for 316 (94.9%), while renter-occupied units make up 17 (5.1%).
| Occupancy | # Housing Units | % Housing Units |
| Owner Occupied Housing Units | 316 | 94.9% |
| Renter-Occupied Housing Units | 17 | 5.1% |
| Total Occupied Housing Units | 333 | 100.0% |
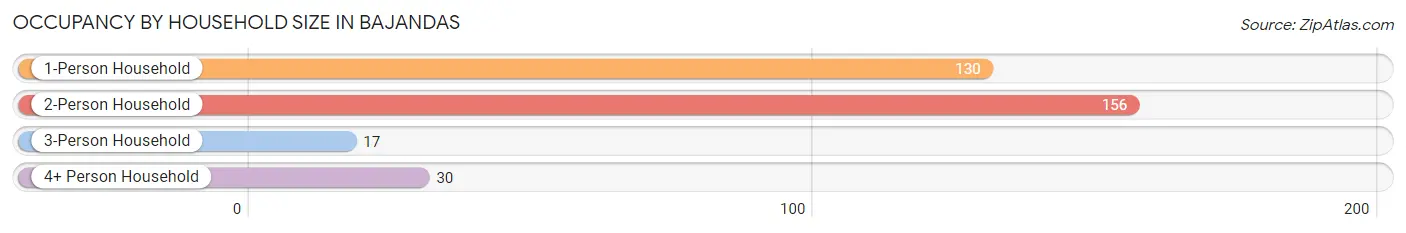
Occupancy by Household Size in Bajandas
| Household Size | # Housing Units | % Housing Units |
| 1-Person Household | 130 | 39.0% |
| 2-Person Household | 156 | 46.9% |
| 3-Person Household | 17 | 5.1% |
| 4+ Person Household | 30 | 9.0% |
| Total Housing Units | 333 | 100.0% |
Occupancy by Ownership by Household Size in Bajandas
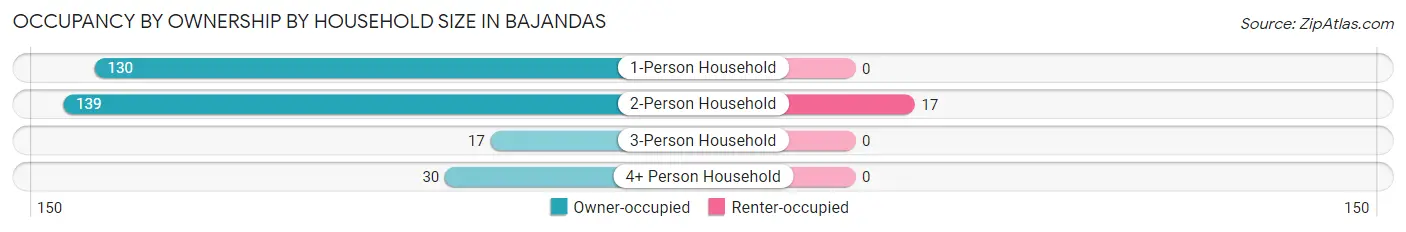
| Household Size | Owner-occupied | Renter-occupied |
| 1-Person Household | 130 (100.0%) | 0 (0.0%) |
| 2-Person Household | 139 (89.1%) | 17 (10.9%) |
| 3-Person Household | 17 (100.0%) | 0 (0.0%) |
| 4+ Person Household | 30 (100.0%) | 0 (0.0%) |
| Total Housing Units | 316 (94.9%) | 17 (5.1%) |
Occupancy by Educational Attainment in Bajandas
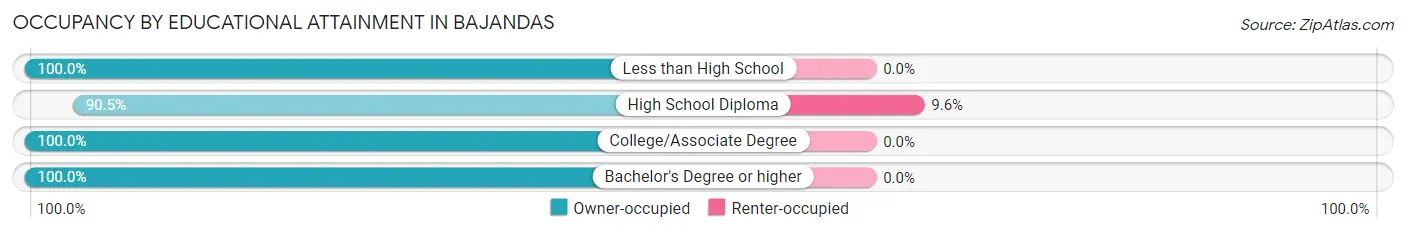
| Household Size | Owner-occupied | Renter-occupied |
| Less than High School | 83 (100.0%) | 0 (0.0%) |
| High School Diploma | 161 (90.4%) | 17 (9.6%) |
| College/Associate Degree | 16 (100.0%) | 0 (0.0%) |
| Bachelor's Degree or higher | 56 (100.0%) | 0 (0.0%) |
Occupancy by Age of Householder in Bajandas
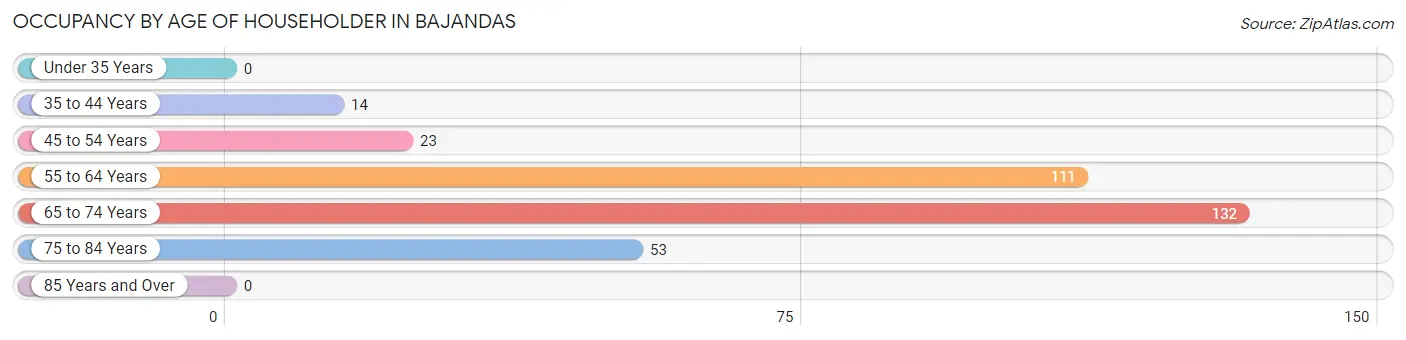
| Age Bracket | # Households | % Households |
| Under 35 Years | 0 | 0.0% |
| 35 to 44 Years | 14 | 4.2% |
| 45 to 54 Years | 23 | 6.9% |
| 55 to 64 Years | 111 | 33.3% |
| 65 to 74 Years | 132 | 39.6% |
| 75 to 84 Years | 53 | 15.9% |
| 85 Years and Over | 0 | 0.0% |
| Total | 333 | 100.0% |
Housing Finances in Bajandas
Median Income by Occupancy in Bajandas
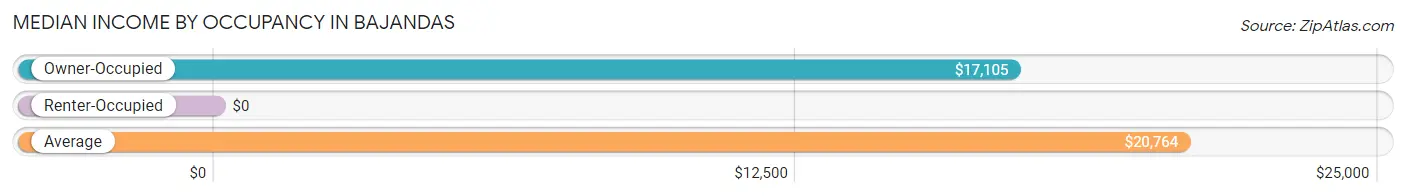
| Occupancy Type | # Households | Median Income |
| Owner-Occupied | 316 (94.9%) | $17,105 |
| Renter-Occupied | 17 (5.1%) | $0 |
| Average | 333 (100.0%) | $20,764 |
Occupancy by Householder Income Bracket in Bajandas
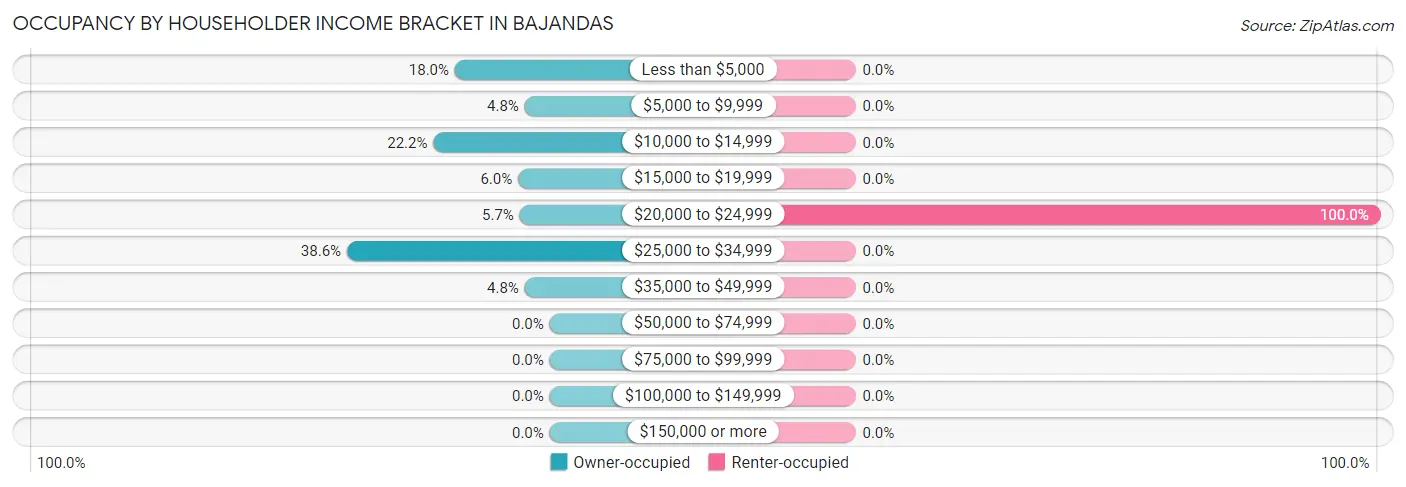
| Income Bracket | Owner-occupied | Renter-occupied |
| Less than $5,000 | 57 (18.0%) | 0 (0.0%) |
| $5,000 to $9,999 | 15 (4.8%) | 0 (0.0%) |
| $10,000 to $14,999 | 70 (22.2%) | 0 (0.0%) |
| $15,000 to $19,999 | 19 (6.0%) | 0 (0.0%) |
| $20,000 to $24,999 | 18 (5.7%) | 17 (100.0%) |
| $25,000 to $34,999 | 122 (38.6%) | 0 (0.0%) |
| $35,000 to $49,999 | 15 (4.8%) | 0 (0.0%) |
| $50,000 to $74,999 | 0 (0.0%) | 0 (0.0%) |
| $75,000 to $99,999 | 0 (0.0%) | 0 (0.0%) |
| $100,000 to $149,999 | 0 (0.0%) | 0 (0.0%) |
| $150,000 or more | 0 (0.0%) | 0 (0.0%) |
| Total | 316 (100.0%) | 17 (100.0%) |
Monthly Housing Cost Tiers in Bajandas
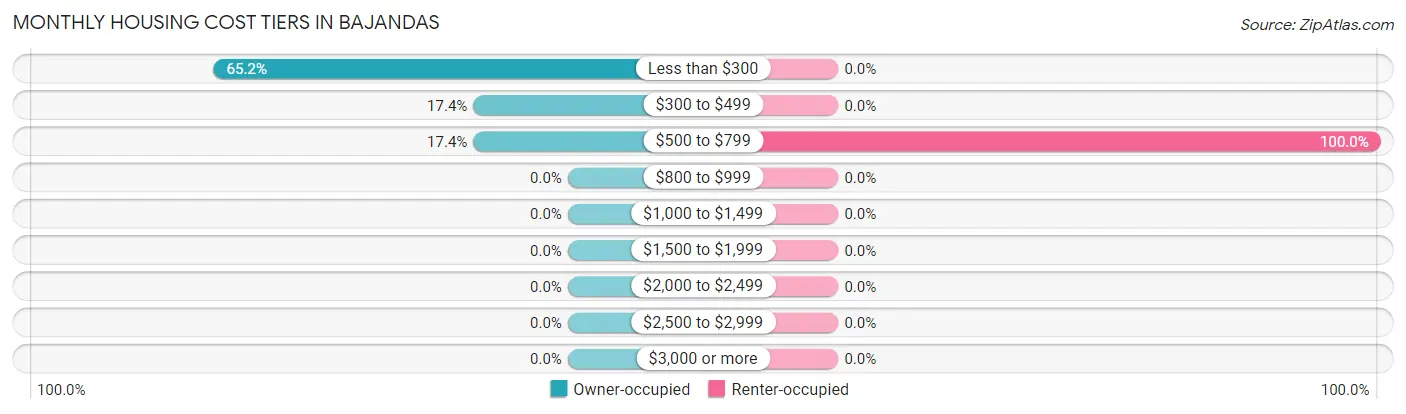
| Monthly Cost | Owner-occupied | Renter-occupied |
| Less than $300 | 206 (65.2%) | 0 (0.0%) |
| $300 to $499 | 55 (17.4%) | 0 (0.0%) |
| $500 to $799 | 55 (17.4%) | 17 (100.0%) |
| $800 to $999 | 0 (0.0%) | 0 (0.0%) |
| $1,000 to $1,499 | 0 (0.0%) | 0 (0.0%) |
| $1,500 to $1,999 | 0 (0.0%) | 0 (0.0%) |
| $2,000 to $2,499 | 0 (0.0%) | 0 (0.0%) |
| $2,500 to $2,999 | 0 (0.0%) | 0 (0.0%) |
| $3,000 or more | 0 (0.0%) | 0 (0.0%) |
| Total | 316 (100.0%) | 17 (100.0%) |
Physical Housing Characteristics in Bajandas
Housing Structures in Bajandas
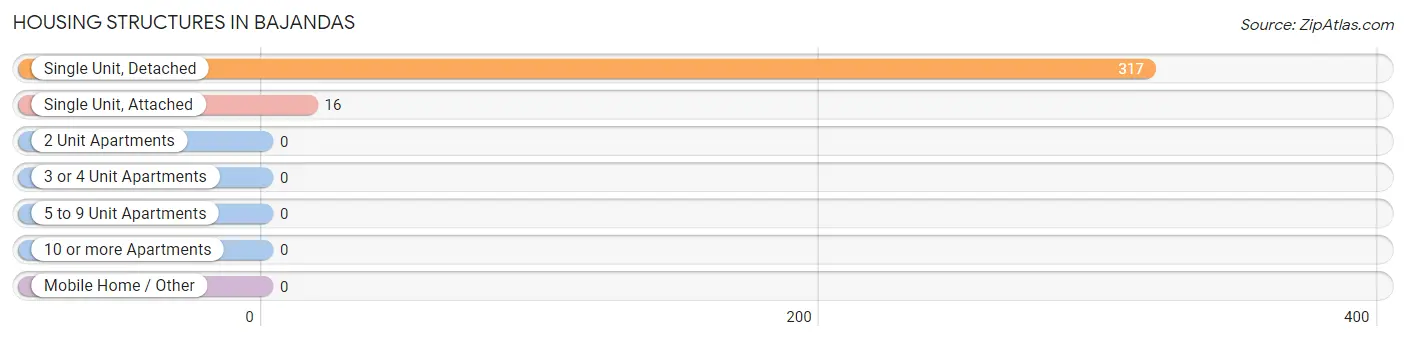
| Structure Type | # Housing Units | % Housing Units |
| Single Unit, Detached | 317 | 95.2% |
| Single Unit, Attached | 16 | 4.8% |
| 2 Unit Apartments | 0 | 0.0% |
| 3 or 4 Unit Apartments | 0 | 0.0% |
| 5 to 9 Unit Apartments | 0 | 0.0% |
| 10 or more Apartments | 0 | 0.0% |
| Mobile Home / Other | 0 | 0.0% |
| Total | 333 | 100.0% |
Housing Structures by Occupancy in Bajandas
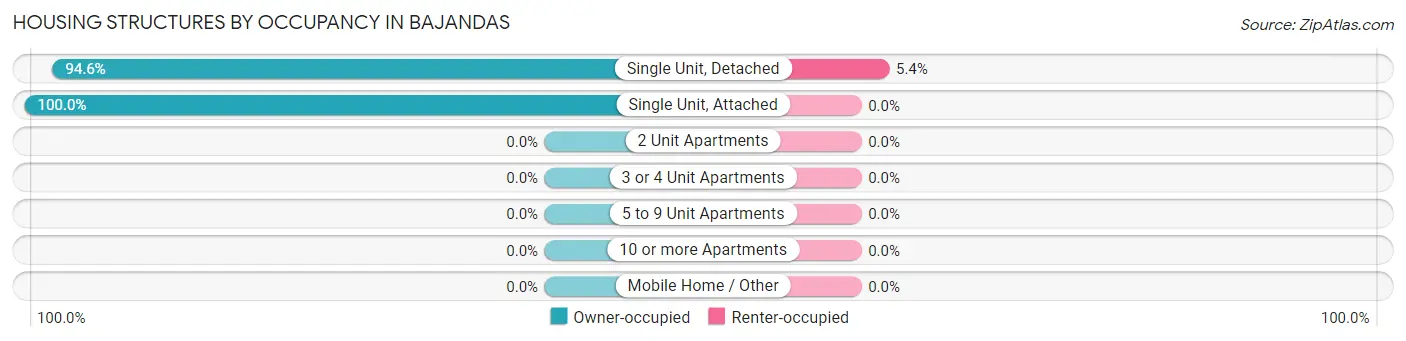
| Structure Type | Owner-occupied | Renter-occupied |
| Single Unit, Detached | 300 (94.6%) | 17 (5.4%) |
| Single Unit, Attached | 16 (100.0%) | 0 (0.0%) |
| 2 Unit Apartments | 0 (0.0%) | 0 (0.0%) |
| 3 or 4 Unit Apartments | 0 (0.0%) | 0 (0.0%) |
| 5 to 9 Unit Apartments | 0 (0.0%) | 0 (0.0%) |
| 10 or more Apartments | 0 (0.0%) | 0 (0.0%) |
| Mobile Home / Other | 0 (0.0%) | 0 (0.0%) |
| Total | 316 (94.9%) | 17 (5.1%) |
Housing Structures by Number of Rooms in Bajandas
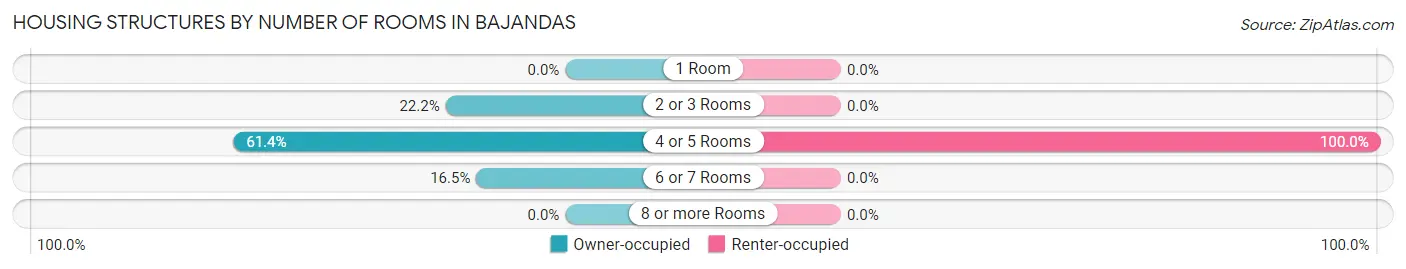
| Number of Rooms | Owner-occupied | Renter-occupied |
| 1 Room | 0 (0.0%) | 0 (0.0%) |
| 2 or 3 Rooms | 70 (22.2%) | 0 (0.0%) |
| 4 or 5 Rooms | 194 (61.4%) | 17 (100.0%) |
| 6 or 7 Rooms | 52 (16.5%) | 0 (0.0%) |
| 8 or more Rooms | 0 (0.0%) | 0 (0.0%) |
| Total | 316 (100.0%) | 17 (100.0%) |
Housing Structure by Heating Type in Bajandas
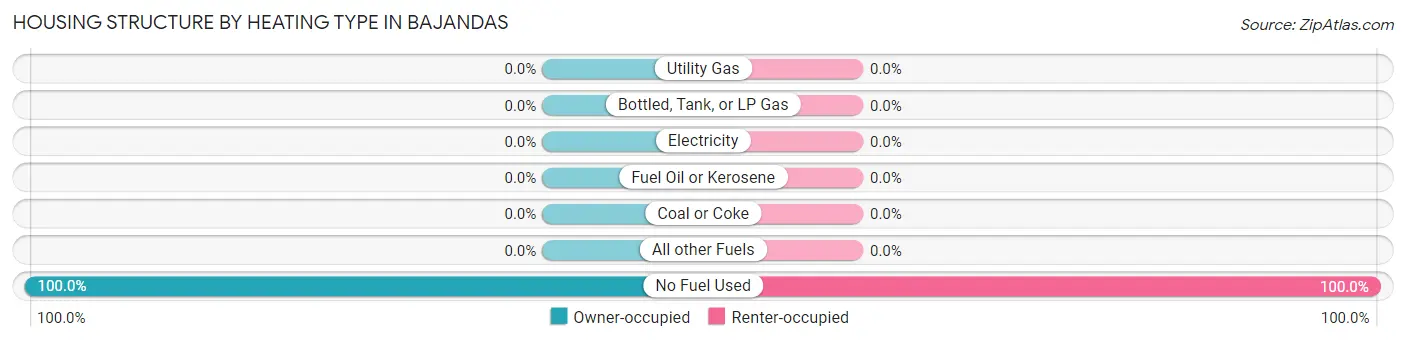
| Heating Type | Owner-occupied | Renter-occupied |
| Utility Gas | 0 (0.0%) | 0 (0.0%) |
| Bottled, Tank, or LP Gas | 0 (0.0%) | 0 (0.0%) |
| Electricity | 0 (0.0%) | 0 (0.0%) |
| Fuel Oil or Kerosene | 0 (0.0%) | 0 (0.0%) |
| Coal or Coke | 0 (0.0%) | 0 (0.0%) |
| All other Fuels | 0 (0.0%) | 0 (0.0%) |
| No Fuel Used | 316 (100.0%) | 17 (100.0%) |
| Total | 316 (100.0%) | 17 (100.0%) |
Household Vehicle Usage in Bajandas
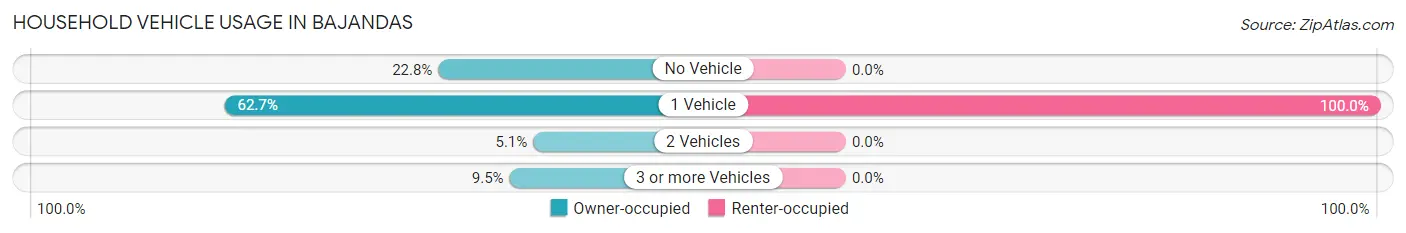
| Vehicles per Household | Owner-occupied | Renter-occupied |
| No Vehicle | 72 (22.8%) | 0 (0.0%) |
| 1 Vehicle | 198 (62.7%) | 17 (100.0%) |
| 2 Vehicles | 16 (5.1%) | 0 (0.0%) |
| 3 or more Vehicles | 30 (9.5%) | 0 (0.0%) |
| Total | 316 (100.0%) | 17 (100.0%) |
Real Estate & Mortgages in Bajandas
Real Estate and Mortgage Overview in Bajandas
| Characteristic | Without Mortgage | With Mortgage |
| Housing Units | 244 | 72 |
| Median Property Value | $96,900 | $75,000 |
| Median Household Income | $13,810 | $0 |
| Monthly Housing Costs | $167 | $0 |
| Real Estate Taxes | - | - |
Property Value by Mortgage Status in Bajandas
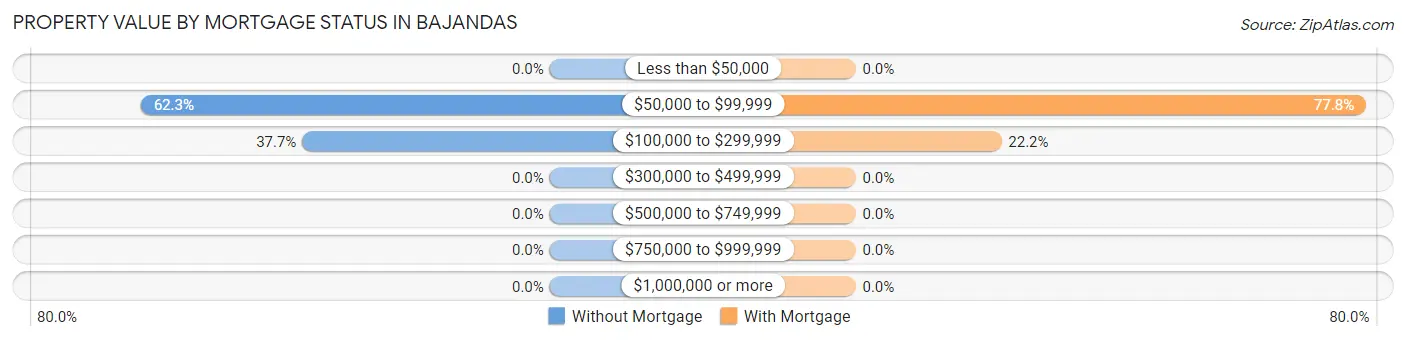
| Property Value | Without Mortgage | With Mortgage |
| Less than $50,000 | 0 (0.0%) | 0 (0.0%) |
| $50,000 to $99,999 | 152 (62.3%) | 56 (77.8%) |
| $100,000 to $299,999 | 92 (37.7%) | 16 (22.2%) |
| $300,000 to $499,999 | 0 (0.0%) | 0 (0.0%) |
| $500,000 to $749,999 | 0 (0.0%) | 0 (0.0%) |
| $750,000 to $999,999 | 0 (0.0%) | 0 (0.0%) |
| $1,000,000 or more | 0 (0.0%) | 0 (0.0%) |
| Total | 244 (100.0%) | 72 (100.0%) |
Household Income by Mortgage Status in Bajandas
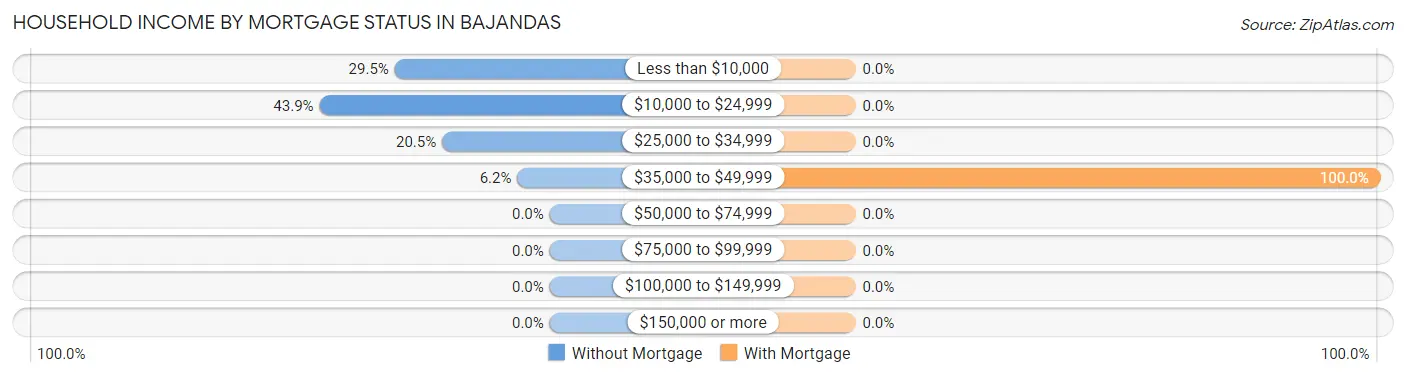
| Household Income | Without Mortgage | With Mortgage |
| Less than $10,000 | 72 (29.5%) | 0 (0.0%) |
| $10,000 to $24,999 | 107 (43.9%) | 0 (0.0%) |
| $25,000 to $34,999 | 50 (20.5%) | 0 (0.0%) |
| $35,000 to $49,999 | 15 (6.1%) | 72 (100.0%) |
| $50,000 to $74,999 | 0 (0.0%) | 0 (0.0%) |
| $75,000 to $99,999 | 0 (0.0%) | 0 (0.0%) |
| $100,000 to $149,999 | 0 (0.0%) | 0 (0.0%) |
| $150,000 or more | 0 (0.0%) | 0 (0.0%) |
| Total | 244 (100.0%) | 72 (100.0%) |
Property Value to Household Income Ratio in Bajandas
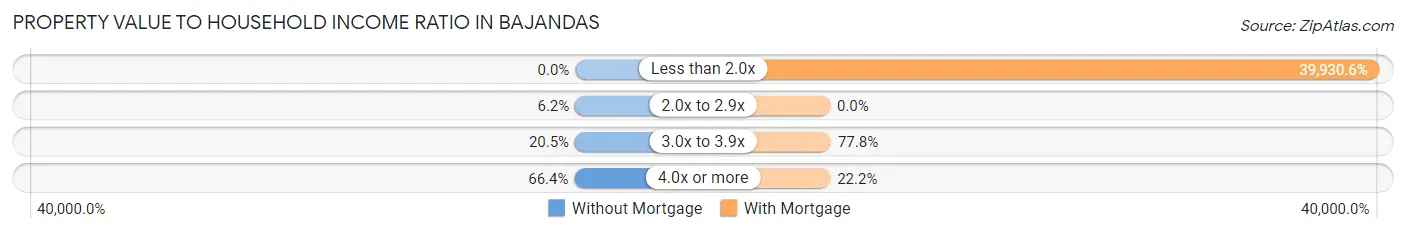
| Value-to-Income Ratio | Without Mortgage | With Mortgage |
| Less than 2.0x | 0 (0.0%) | 28,750 (39,930.6%) |
| 2.0x to 2.9x | 15 (6.1%) | 0 (0.0%) |
| 3.0x to 3.9x | 50 (20.5%) | 56 (77.8%) |
| 4.0x or more | 162 (66.4%) | 16 (22.2%) |
| Total | 244 (100.0%) | 72 (100.0%) |
Real Estate Taxes by Mortgage Status in Bajandas
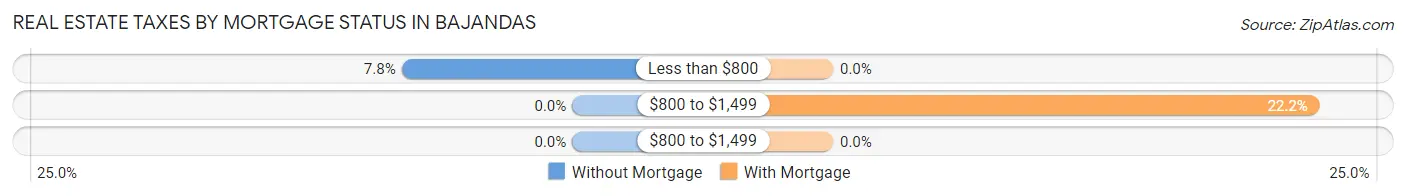
| Property Taxes | Without Mortgage | With Mortgage |
| Less than $800 | 19 (7.8%) | 0 (0.0%) |
| $800 to $1,499 | 0 (0.0%) | 16 (22.2%) |
| $800 to $1,499 | 0 (0.0%) | 0 (0.0%) |
| Total | 244 (100.0%) | 72 (100.0%) |
Health & Disability in Bajandas
Health Insurance Coverage by Age in Bajandas
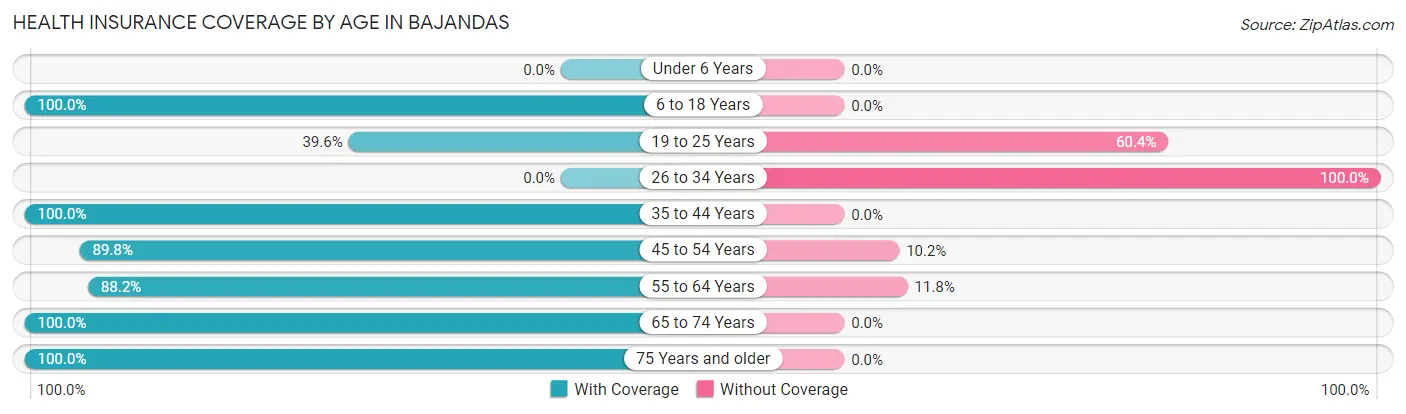
| Age Bracket | With Coverage | Without Coverage |
| Under 6 Years | 0 (0.0%) | 0 (0.0%) |
| 6 to 18 Years | 35 (100.0%) | 0 (0.0%) |
| 19 to 25 Years | 40 (39.6%) | 61 (60.4%) |
| 26 to 34 Years | 0 (0.0%) | 29 (100.0%) |
| 35 to 44 Years | 14 (100.0%) | 0 (0.0%) |
| 45 to 54 Years | 114 (89.8%) | 13 (10.2%) |
| 55 to 64 Years | 112 (88.2%) | 15 (11.8%) |
| 65 to 74 Years | 273 (100.0%) | 0 (0.0%) |
| 75 Years and older | 71 (100.0%) | 0 (0.0%) |
| Total | 659 (84.8%) | 118 (15.2%) |
Health Insurance Coverage by Citizenship Status in Bajandas
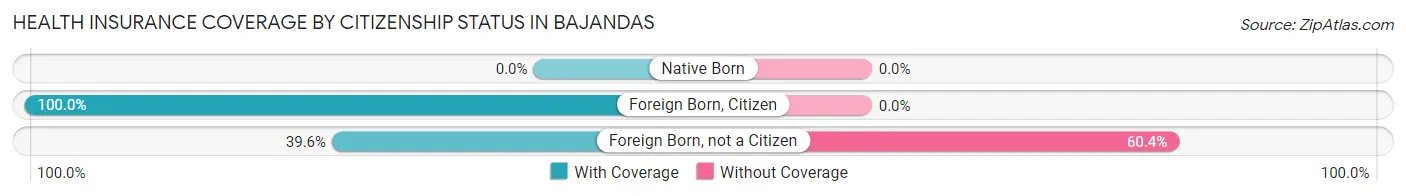
| Citizenship Status | With Coverage | Without Coverage |
| Native Born | 0 (0.0%) | 0 (0.0%) |
| Foreign Born, Citizen | 35 (100.0%) | 0 (0.0%) |
| Foreign Born, not a Citizen | 40 (39.6%) | 61 (60.4%) |
Health Insurance Coverage by Household Income in Bajandas
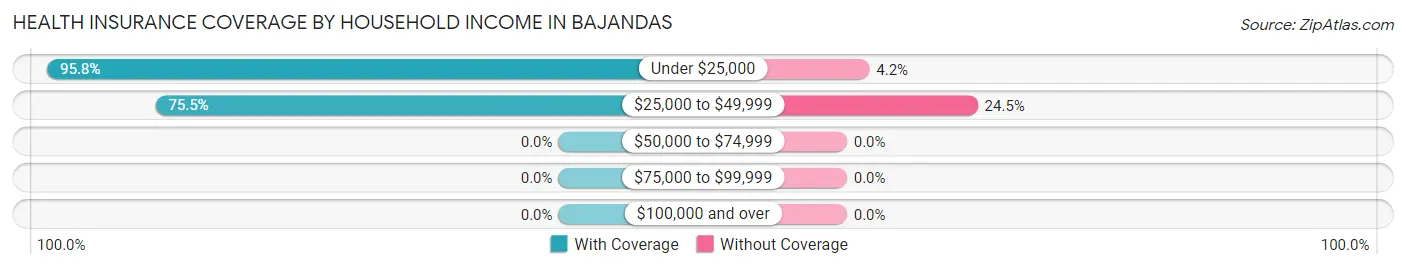
| Household Income | With Coverage | Without Coverage |
| Under $25,000 | 340 (95.8%) | 15 (4.2%) |
| $25,000 to $49,999 | 317 (75.5%) | 103 (24.5%) |
| $50,000 to $74,999 | 0 (0.0%) | 0 (0.0%) |
| $75,000 to $99,999 | 0 (0.0%) | 0 (0.0%) |
| $100,000 and over | 0 (0.0%) | 0 (0.0%) |
Public vs Private Health Insurance Coverage by Age in Bajandas
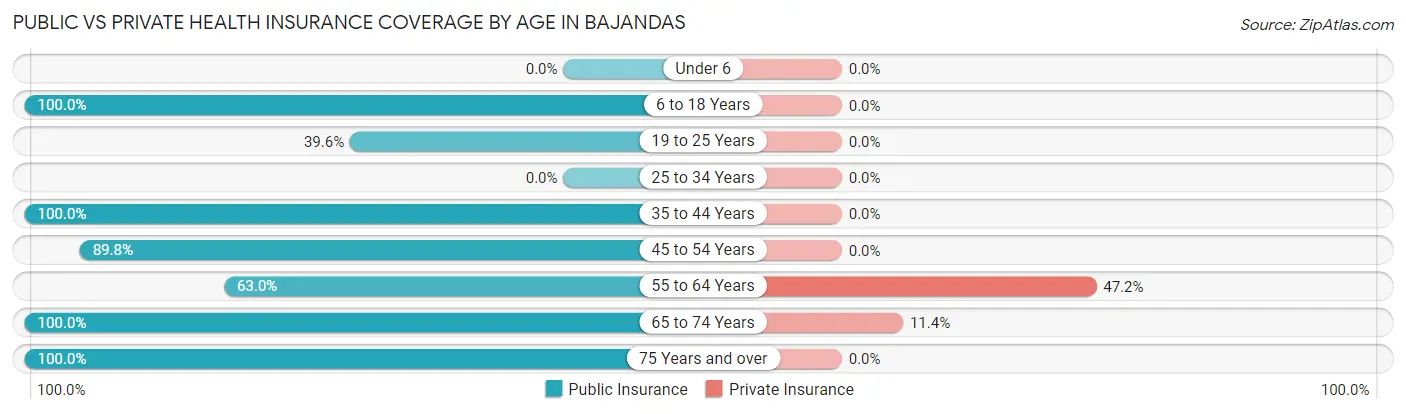
| Age Bracket | Public Insurance | Private Insurance |
| Under 6 | 0 (0.0%) | 0 (0.0%) |
| 6 to 18 Years | 35 (100.0%) | 0 (0.0%) |
| 19 to 25 Years | 40 (39.6%) | 0 (0.0%) |
| 25 to 34 Years | 0 (0.0%) | 0 (0.0%) |
| 35 to 44 Years | 14 (100.0%) | 0 (0.0%) |
| 45 to 54 Years | 114 (89.8%) | 0 (0.0%) |
| 55 to 64 Years | 80 (63.0%) | 60 (47.2%) |
| 65 to 74 Years | 273 (100.0%) | 31 (11.4%) |
| 75 Years and over | 71 (100.0%) | 0 (0.0%) |
| Total | 627 (80.7%) | 91 (11.7%) |
Disability Status by Sex by Age in Bajandas
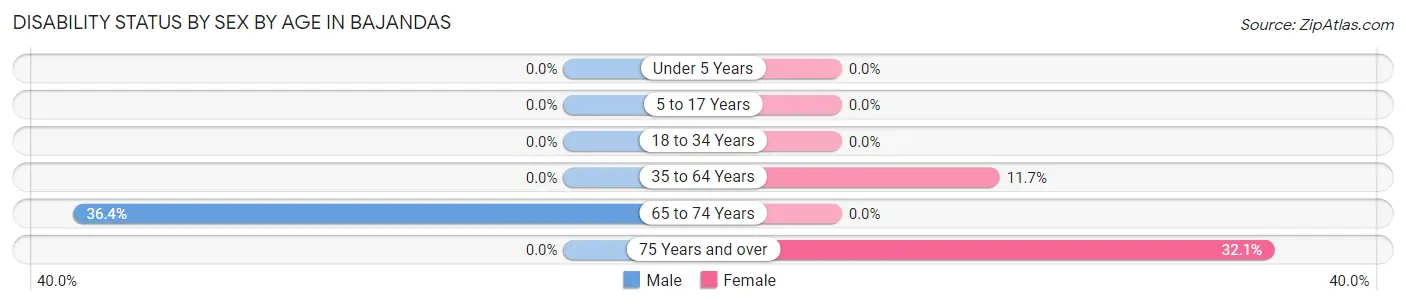
| Age Bracket | Male | Female |
| Under 5 Years | 0 (0.0%) | 0 (0.0%) |
| 5 to 17 Years | 0 (0.0%) | 0 (0.0%) |
| 18 to 34 Years | 0 (0.0%) | 0 (0.0%) |
| 35 to 64 Years | 0 (0.0%) | 23 (11.7%) |
| 65 to 74 Years | 32 (36.4%) | 0 (0.0%) |
| 75 Years and over | 0 (0.0%) | 17 (32.1%) |
Disability Class by Sex by Age in Bajandas
Disability Class: Hearing Difficulty
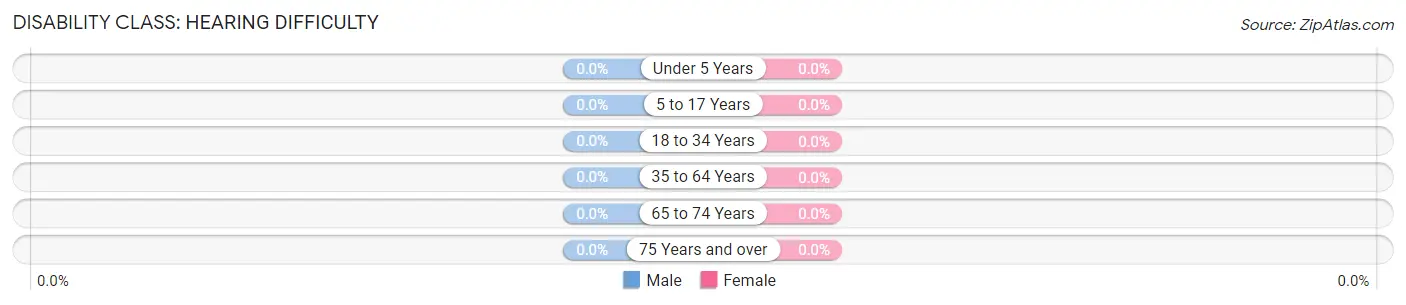
| Age Bracket | Male | Female |
| Under 5 Years | 0 (0.0%) | 0 (0.0%) |
| 5 to 17 Years | 0 (0.0%) | 0 (0.0%) |
| 18 to 34 Years | 0 (0.0%) | 0 (0.0%) |
| 35 to 64 Years | 0 (0.0%) | 0 (0.0%) |
| 65 to 74 Years | 0 (0.0%) | 0 (0.0%) |
| 75 Years and over | 0 (0.0%) | 0 (0.0%) |
Disability Class: Vision Difficulty
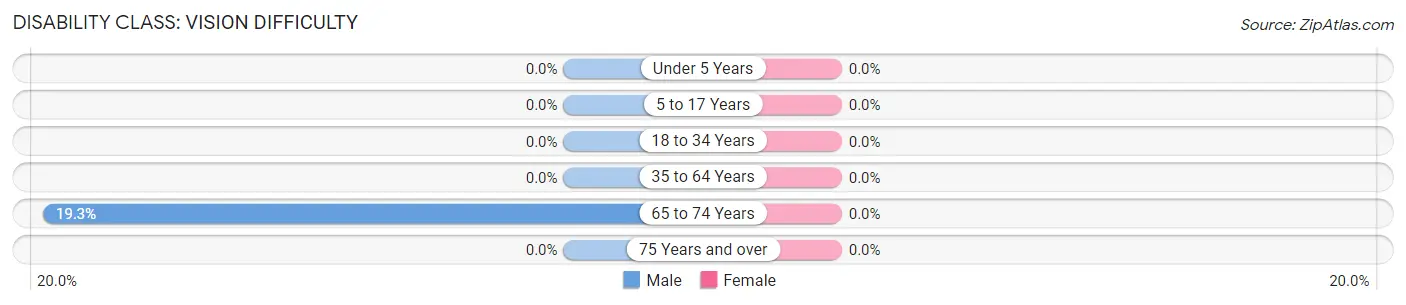
| Age Bracket | Male | Female |
| Under 5 Years | 0 (0.0%) | 0 (0.0%) |
| 5 to 17 Years | 0 (0.0%) | 0 (0.0%) |
| 18 to 34 Years | 0 (0.0%) | 0 (0.0%) |
| 35 to 64 Years | 0 (0.0%) | 0 (0.0%) |
| 65 to 74 Years | 17 (19.3%) | 0 (0.0%) |
| 75 Years and over | 0 (0.0%) | 0 (0.0%) |
Disability Class: Cognitive Difficulty
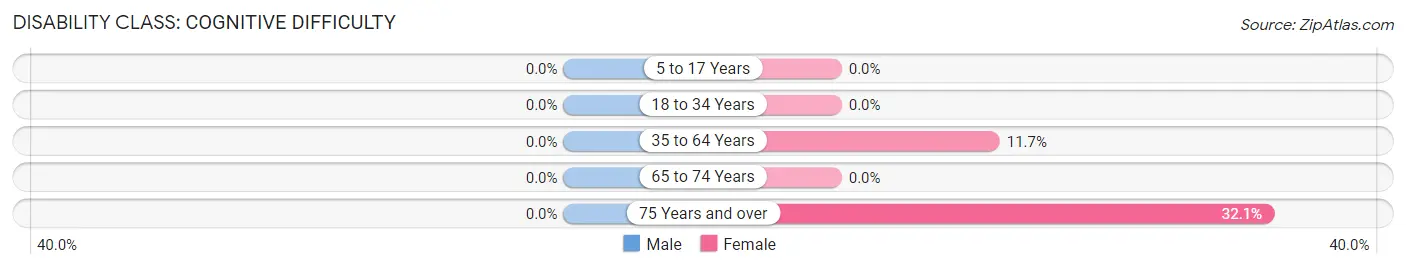
| Age Bracket | Male | Female |
| 5 to 17 Years | 0 (0.0%) | 0 (0.0%) |
| 18 to 34 Years | 0 (0.0%) | 0 (0.0%) |
| 35 to 64 Years | 0 (0.0%) | 23 (11.7%) |
| 65 to 74 Years | 0 (0.0%) | 0 (0.0%) |
| 75 Years and over | 0 (0.0%) | 17 (32.1%) |
Disability Class: Ambulatory Difficulty
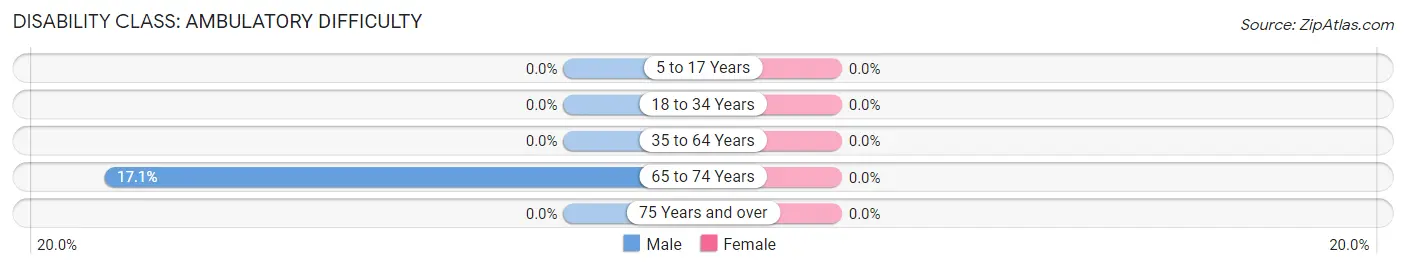
| Age Bracket | Male | Female |
| 5 to 17 Years | 0 (0.0%) | 0 (0.0%) |
| 18 to 34 Years | 0 (0.0%) | 0 (0.0%) |
| 35 to 64 Years | 0 (0.0%) | 0 (0.0%) |
| 65 to 74 Years | 15 (17.1%) | 0 (0.0%) |
| 75 Years and over | 0 (0.0%) | 0 (0.0%) |
Disability Class: Self-Care Difficulty
| Age Bracket | Male | Female |
| 5 to 17 Years | 0 (0.0%) | 0 (0.0%) |
| 18 to 34 Years | 0 (0.0%) | 0 (0.0%) |
| 35 to 64 Years | 0 (0.0%) | 0 (0.0%) |
| 65 to 74 Years | 0 (0.0%) | 0 (0.0%) |
| 75 Years and over | 0 (0.0%) | 0 (0.0%) |
Technology Access in Bajandas
Computing Device Access in Bajandas
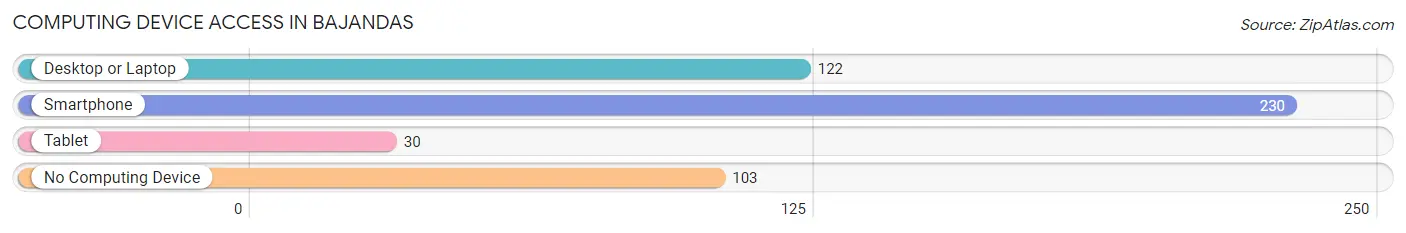
| Device Type | # Households | % Households |
| Desktop or Laptop | 122 | 36.6% |
| Smartphone | 230 | 69.1% |
| Tablet | 30 | 9.0% |
| No Computing Device | 103 | 30.9% |
| Total | 333 | 100.0% |
Internet Access in Bajandas
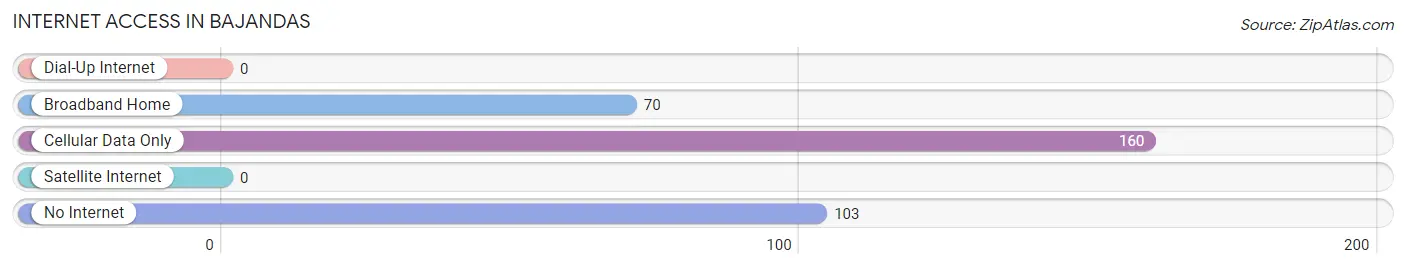
| Internet Type | # Households | % Households |
| Dial-Up Internet | 0 | 0.0% |
| Broadband Home | 70 | 21.0% |
| Cellular Data Only | 160 | 48.0% |
| Satellite Internet | 0 | 0.0% |
| No Internet | 103 | 30.9% |
| Total | 333 | 100.0% |
Bajandas Summary
Puerto Rico is an unincorporated territory of the United States located in the northeastern Caribbean Sea. It is an archipelago that includes the main island of Puerto Rico and several smaller islands, such as Vieques, Culebra, and Mona. The total land area of Puerto Rico is 3,515 square miles, making it the third-largest island in the Caribbean. Puerto Rico is known for its beautiful beaches, lush rainforests, and vibrant culture.
History
Puerto Rico has a long and rich history that dates back to the early 16th century. The island was first inhabited by the Taíno people, who were later displaced by Spanish settlers in the late 1500s. The Spanish established a colony on the island and named it Puerto Rico, which translates to “rich port.” The island was a Spanish colony for nearly 400 years, until it was ceded to the United States in 1898 following the Spanish-American War.
In 1917, the Jones-Shafroth Act granted U.S. citizenship to all Puerto Ricans. In 1952, Puerto Rico became an unincorporated territory of the United States, and in 1952, the island was granted limited autonomy. In recent years, Puerto Rico has been struggling with a severe economic crisis, which has led to calls for greater autonomy and even independence from the United States.
Geography
Puerto Rico is located in the northeastern Caribbean Sea, about 1,000 miles southeast of Miami, Florida. The island is roughly 100 miles long and 35 miles wide, making it the third-largest island in the Caribbean. Puerto Rico is divided into 78 municipalities, each with its own government. The capital and largest city is San Juan, which is located on the northern coast of the island.
The terrain of Puerto Rico is mostly mountainous, with the highest peak being Cerro de Punta at 4,390 feet. The island is home to several rivers, including the Rio Grande de Loíza, which is the longest river in Puerto Rico. The climate of Puerto Rico is tropical, with temperatures ranging from the mid-70s to the mid-80s year-round.
Economy
Puerto Rico has a mixed economy that is largely dependent on tourism and manufacturing. The island is home to several large companies, such as pharmaceutical giant Pfizer and rum producer Bacardi. Tourism is a major source of income for the island, with millions of visitors coming to Puerto Rico each year to enjoy its beaches, rainforests, and vibrant culture.
The manufacturing sector is also an important part of the economy, with products such as electronics, chemicals, and pharmaceuticals being produced on the island. The government of Puerto Rico is also a major employer, with many government jobs being available in the areas of education, health care, and public safety.
Demographics
As of 2020, the population of Puerto Rico is estimated to be 3.2 million. The majority of the population is of Hispanic or Latino descent, with the largest ethnic group being Puerto Ricans. Other ethnic groups on the island include African Americans, Europeans, and Asians. The official language of Puerto Rico is Spanish, although English is also widely spoken.
The majority of the population is Roman Catholic, with other religious groups including Protestants, Jews, and Muslims. The median household income in Puerto Rico is $20,000, which is significantly lower than the median household income in the United States. The poverty rate in Puerto Rico is also higher than the national average, with nearly half of the population living below the poverty line.
Common Questions
What is Per Capita Income in Bajandas?
Per Capita income in Bajandas is $9,270.
What is the Median Family Income in Bajandas?
Median Family Income in Bajandas is $26,346.
What is the Median Household income in Bajandas?
Median Household Income in Bajandas is $20,764.
What is Inequality or Gini Index in Bajandas?
Inequality or Gini Index in Bajandas is 0.33.
What is the Total Population of Bajandas?
Total Population of Bajandas is 777.
What is the Total Male Population of Bajandas?
Total Male Population of Bajandas is 253.
What is the Total Female Population of Bajandas?
Total Female Population of Bajandas is 524.
What is the Ratio of Males per 100 Females in Bajandas?
There are 48.28 Males per 100 Females in Bajandas.
What is the Ratio of Females per 100 Males in Bajandas?
There are 207.11 Females per 100 Males in Bajandas.
What is the Median Population Age in Bajandas?
Median Population Age in Bajandas is 62.5 Years.
What is the Average Family Size in Bajandas
Average Family Size in Bajandas is 3.3 People.
What is the Average Household Size in Bajandas
Average Household Size in Bajandas is 2.3 People.
How Large is the Labor Force in Bajandas?
There are 117 People in the Labor Forcein in Bajandas.
What is the Percentage of People in the Labor Force in Bajandas?
15.8% of People are in the Labor Force in Bajandas.