Zip Codes with the Most Immigrants from Latin America in Pell City, AL
RELATED REPORTS & OPTIONS
Latin America
Pell City
Compare Zip Codes
Map of Zip Codes with the Most Immigrants from Latin America in Pell City
27
65
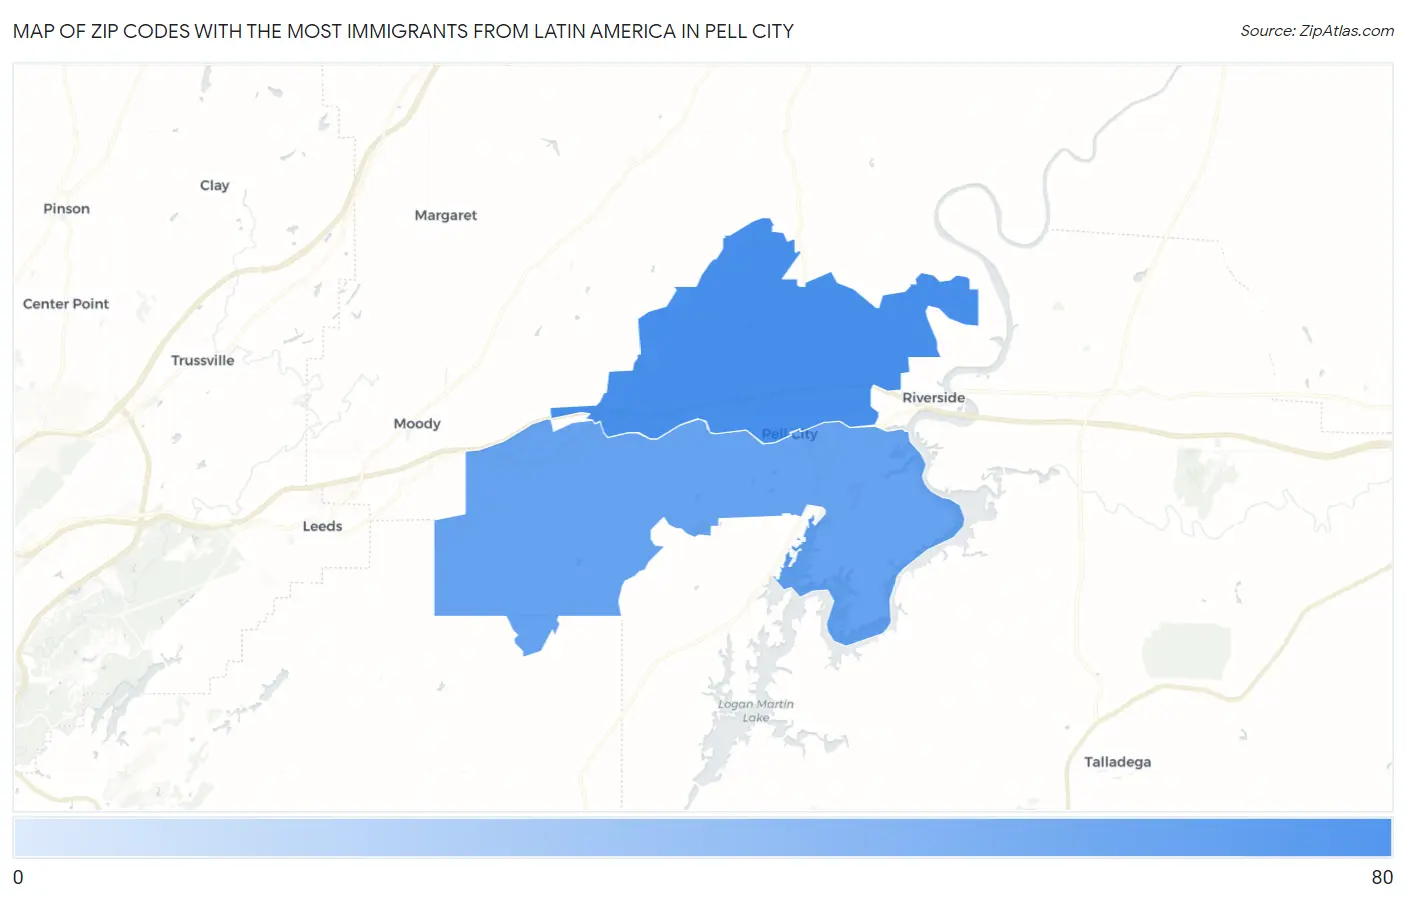
Zip Codes with the Most Immigrants from Latin America in Pell City, AL
| Zip Code | Latin America | vs State | vs National | |
| 1. | 35125 | 65 | 86,480(0.08%)#220 | 22,649,518(0.00%)#12,473 |
| 2. | 35128 | 27 | 86,480(0.03%)#286 | 22,649,518(0.00%)#15,082 |
1
Common Questions
What are the Top Zip Codes with the Most Immigrants from Latin America in Pell City, AL?
Top Zip Codes with the Most Immigrants from Latin America in Pell City, AL are:
What zip code has the Most Immigrants from Latin America in Pell City, AL?
35125 has the Most Immigrants from Latin America in Pell City, AL with 65.
What is the Total Immigrants from Latin America in Pell City, AL?
Total Immigrants from Latin America in Pell City is 65.
What is the Total Immigrants from Latin America in Alabama?
Total Immigrants from Latin America in Alabama is 86,480.
What is the Total Immigrants from Latin America in the United States?
Total Immigrants from Latin America in the United States is 22,649,518.