Zip Codes with the Highest Percentage of Population Employed in Office & Administration in Huntsville, TX
RELATED REPORTS & OPTIONS
Office & Administration
Huntsville
Compare Zip Codes
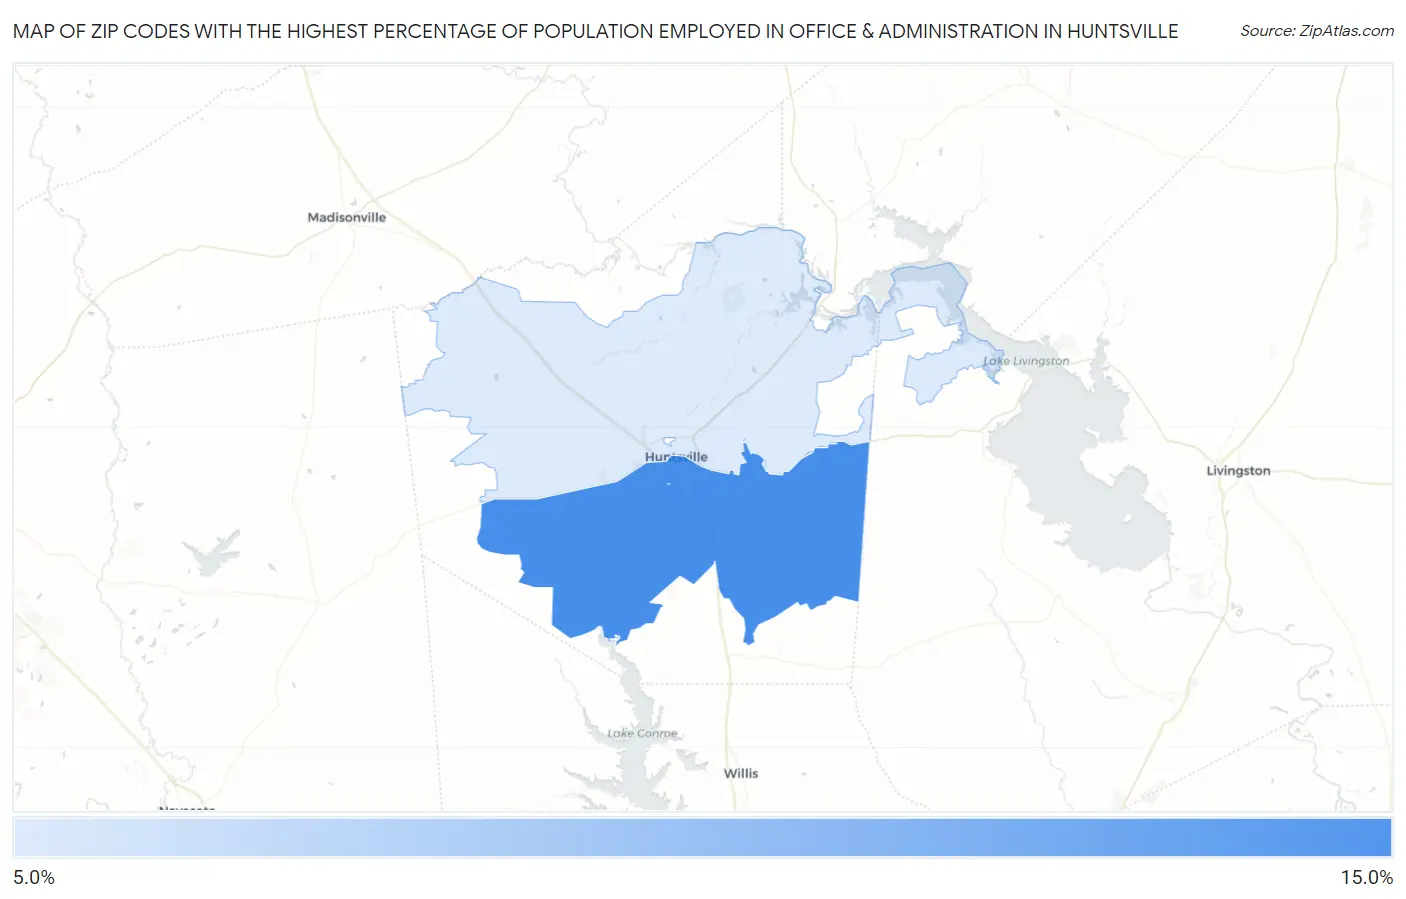
Map of Zip Codes with the Highest Percentage of Population Employed in Office & Administration in Huntsville
11.2%
12.6%
Zip Codes with the Highest Percentage of Population Employed in Office & Administration in Huntsville, TX
| Zip Code | % Employed | vs State | vs National | |
| 1. | 77340 | 12.6% | 11.0%(+1.67)#562 | 10.9%(+1.78)#8,940 |
| 2. | 77320 | 11.2% | 11.0%(+0.193)#792 | 10.9%(+0.308)#13,317 |
1
Common Questions
What are the Top Zip Codes with the Highest Percentage of Population Employed in Office & Administration in Huntsville, TX?
Top Zip Codes with the Highest Percentage of Population Employed in Office & Administration in Huntsville, TX are:
What zip code has the Highest Percentage of Population Employed in Office & Administration in Huntsville, TX?
77340 has the Highest Percentage of Population Employed in Office & Administration in Huntsville, TX with 12.6%.
What is the Percentage of Population Employed in Office & Administration in Huntsville, TX?
Percentage of Population Employed in Office & Administration in Huntsville is 12.1%.
What is the Percentage of Population Employed in Office & Administration in Texas?
Percentage of Population Employed in Office & Administration in Texas is 11.0%.
What is the Percentage of Population Employed in Office & Administration in the United States?
Percentage of Population Employed in Office & Administration in the United States is 10.9%.