Zip Codes with the Highest Percentage of Population Taking Taxi / Cab to Work in Huntsville, TX
RELATED REPORTS & OPTIONS
Taxi / Cab
Huntsville
Compare Zip Codes
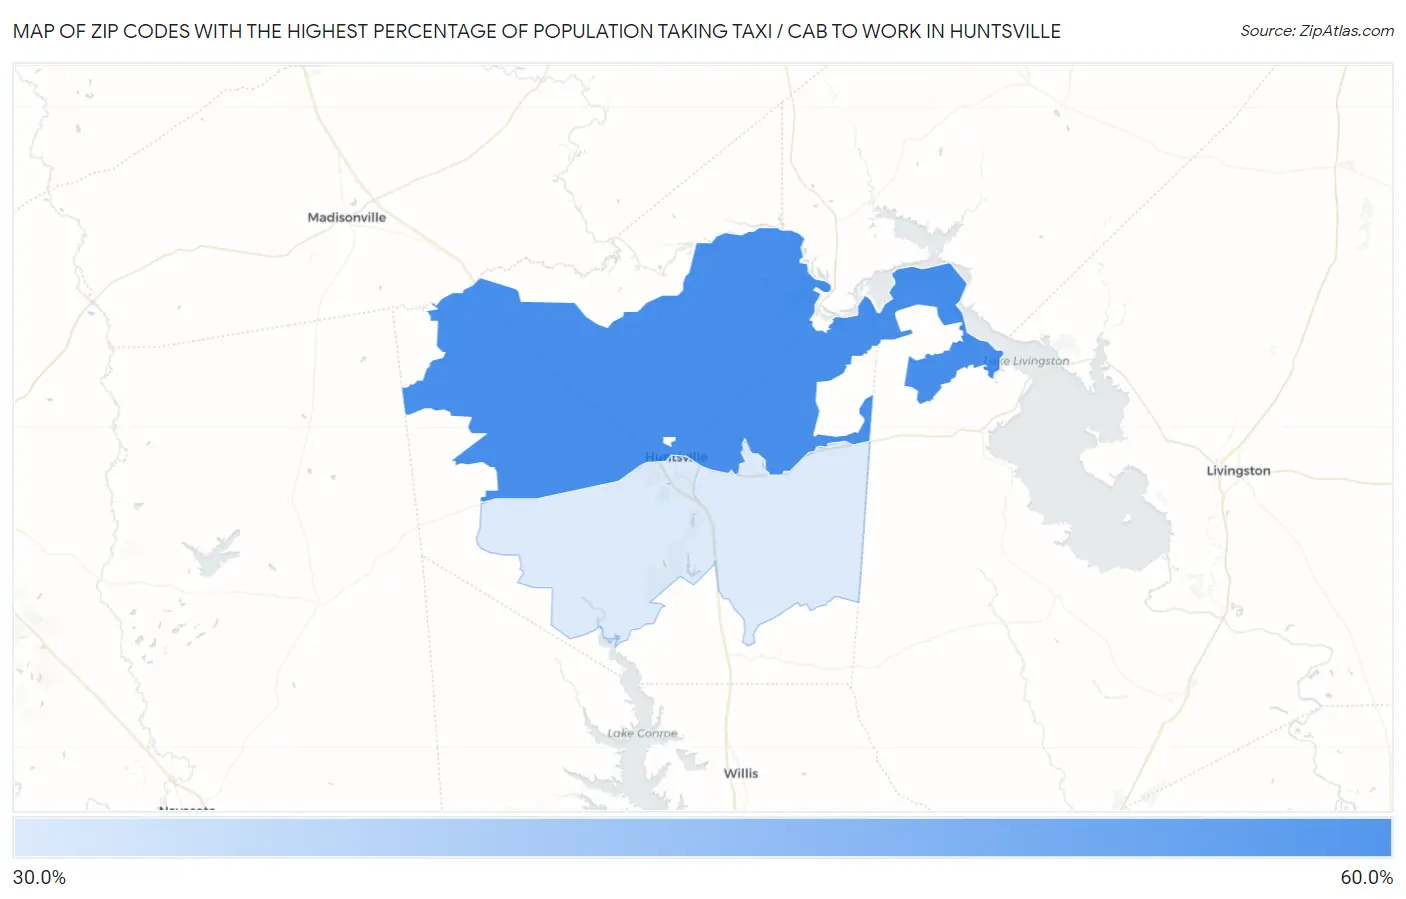
Map of Zip Codes with the Highest Percentage of Population Taking Taxi / Cab to Work in Huntsville
33.3%
51.0%
Zip Codes with the Highest Percentage of Population Taking Taxi / Cab to Work in Huntsville, TX
| Zip Code | % Take Taxi / Cab | vs State | vs National | |
| 1. | 77320 | 51.0% | 36.9%(+14.1)#151 | 38.2%(+12.8)#2,666 |
| 2. | 77340 | 33.3% | 36.9%(-3.60)#609 | 38.2%(-4.90)#9,658 |
1
Common Questions
What are the Top Zip Codes with the Highest Percentage of Population Taking Taxi / Cab to Work in Huntsville, TX?
Top Zip Codes with the Highest Percentage of Population Taking Taxi / Cab to Work in Huntsville, TX are:
What zip code has the Highest Percentage of Population Taking Taxi / Cab to Work in Huntsville, TX?
77320 has the Highest Percentage of Population Taking Taxi / Cab to Work in Huntsville, TX with 51.0%.
What is the Percentage of Population Taking Taxi / Cab to Work in Huntsville, TX?
Percentage of Population Taking Taxi / Cab to Work in Huntsville is 25.8%.
What is the Percentage of Population Taking Taxi / Cab to Work in Texas?
Percentage of Population Taking Taxi / Cab to Work in Texas is 36.9%.
What is the Percentage of Population Taking Taxi / Cab to Work in the United States?
Percentage of Population Taking Taxi / Cab to Work in the United States is 38.2%.