Immigrants from Burma/Myanmar vs Yugoslavian Single Female Poverty
COMPARE
Immigrants from Burma/Myanmar
Yugoslavian
Single Female Poverty
Single Female Poverty Comparison
Immigrants from Burma/Myanmar
Yugoslavians
22.6%
SINGLE FEMALE POVERTY
0.8/ 100
METRIC RATING
254th/ 347
METRIC RANK
21.2%
SINGLE FEMALE POVERTY
35.4/ 100
METRIC RATING
188th/ 347
METRIC RANK
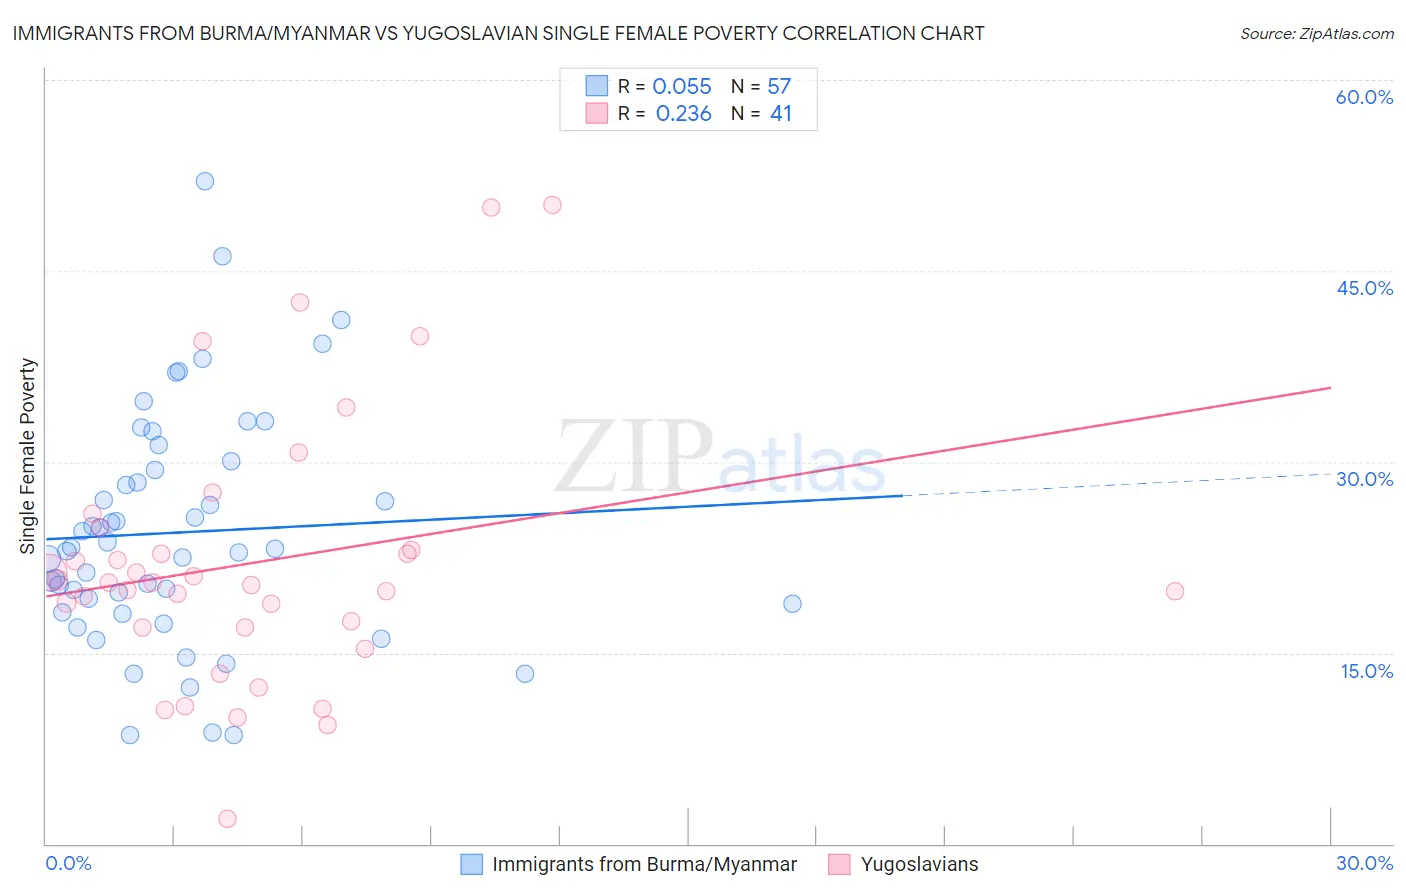
Immigrants from Burma/Myanmar vs Yugoslavian Single Female Poverty Correlation Chart
The statistical analysis conducted on geographies consisting of 171,274,747 people shows a slight positive correlation between the proportion of Immigrants from Burma/Myanmar and poverty level among single females in the United States with a correlation coefficient (R) of 0.055 and weighted average of 22.6%. Similarly, the statistical analysis conducted on geographies consisting of 282,795,313 people shows a weak positive correlation between the proportion of Yugoslavians and poverty level among single females in the United States with a correlation coefficient (R) of 0.236 and weighted average of 21.2%, a difference of 6.4%.
Single Female Poverty Correlation Summary
| Measurement | Immigrants from Burma/Myanmar | Yugoslavian |
| Minimum | 8.5% | 2.0% |
| Maximum | 52.0% | 50.2% |
| Range | 43.5% | 48.2% |
| Mean | 24.5% | 22.1% |
| Median | 23.1% | 20.5% |
| Interquartile 25% (IQ1) | 18.5% | 17.0% |
| Interquartile 75% (IQ3) | 29.7% | 23.9% |
| Interquartile Range (IQR) | 11.2% | 7.0% |
| Standard Deviation (Sample) | 9.1% | 10.4% |
| Standard Deviation (Population) | 9.1% | 10.3% |
Similar Demographics by Single Female Poverty
Demographics Similar to Immigrants from Burma/Myanmar by Single Female Poverty
In terms of single female poverty, the demographic groups most similar to Immigrants from Burma/Myanmar are Immigrants from Sudan (22.6%, a difference of 0.0%), Immigrants from Liberia (22.5%, a difference of 0.10%), Immigrants from Belize (22.6%, a difference of 0.15%), Delaware (22.5%, a difference of 0.19%), and Sudanese (22.6%, a difference of 0.29%).
| Demographics | Rating | Rank | Single Female Poverty |
| Immigrants | El Salvador | 1.4 /100 | #247 | Tragic 22.4% |
| Belizeans | 1.4 /100 | #248 | Tragic 22.4% |
| Immigrants | Caribbean | 1.3 /100 | #249 | Tragic 22.4% |
| Immigrants | Bahamas | 1.2 /100 | #250 | Tragic 22.5% |
| Immigrants | West Indies | 1.0 /100 | #251 | Tragic 22.5% |
| Delaware | 1.0 /100 | #252 | Tragic 22.5% |
| Immigrants | Liberia | 0.9 /100 | #253 | Tragic 22.5% |
| Immigrants | Burma/Myanmar | 0.8 /100 | #254 | Tragic 22.6% |
| Immigrants | Sudan | 0.8 /100 | #255 | Tragic 22.6% |
| Immigrants | Belize | 0.8 /100 | #256 | Tragic 22.6% |
| Sudanese | 0.7 /100 | #257 | Tragic 22.6% |
| Bahamians | 0.6 /100 | #258 | Tragic 22.7% |
| Whites/Caucasians | 0.6 /100 | #259 | Tragic 22.7% |
| Celtics | 0.5 /100 | #260 | Tragic 22.7% |
| Immigrants | Cabo Verde | 0.4 /100 | #261 | Tragic 22.8% |
Demographics Similar to Yugoslavians by Single Female Poverty
In terms of single female poverty, the demographic groups most similar to Yugoslavians are Immigrants from Cuba (21.2%, a difference of 0.010%), Trinidadian and Tobagonian (21.2%, a difference of 0.010%), Immigrants from Nigeria (21.2%, a difference of 0.090%), Hawaiian (21.2%, a difference of 0.15%), and Immigrants from Cambodia (21.2%, a difference of 0.19%).
| Demographics | Rating | Rank | Single Female Poverty |
| Europeans | 42.3 /100 | #181 | Average 21.1% |
| Slavs | 40.5 /100 | #182 | Average 21.1% |
| Slovaks | 39.7 /100 | #183 | Fair 21.1% |
| Hungarians | 39.6 /100 | #184 | Fair 21.1% |
| Immigrants | Cambodia | 38.2 /100 | #185 | Fair 21.2% |
| Hawaiians | 37.7 /100 | #186 | Fair 21.2% |
| Immigrants | Nigeria | 36.8 /100 | #187 | Fair 21.2% |
| Yugoslavians | 35.4 /100 | #188 | Fair 21.2% |
| Immigrants | Cuba | 35.3 /100 | #189 | Fair 21.2% |
| Trinidadians and Tobagonians | 35.2 /100 | #190 | Fair 21.2% |
| Immigrants | Germany | 31.1 /100 | #191 | Fair 21.3% |
| Immigrants | Jamaica | 30.5 /100 | #192 | Fair 21.3% |
| Basques | 28.1 /100 | #193 | Fair 21.3% |
| Czechoslovakians | 27.7 /100 | #194 | Fair 21.3% |
| Nicaraguans | 27.6 /100 | #195 | Fair 21.3% |