Immigrants from Burma/Myanmar vs Immigrants from Middle Africa Single Female Poverty
COMPARE
Immigrants from Burma/Myanmar
Immigrants from Middle Africa
Single Female Poverty
Single Female Poverty Comparison
Immigrants from Burma/Myanmar
Immigrants from Middle Africa
22.6%
SINGLE FEMALE POVERTY
0.8/ 100
METRIC RATING
254th/ 347
METRIC RANK
22.3%
SINGLE FEMALE POVERTY
1.9/ 100
METRIC RATING
244th/ 347
METRIC RANK
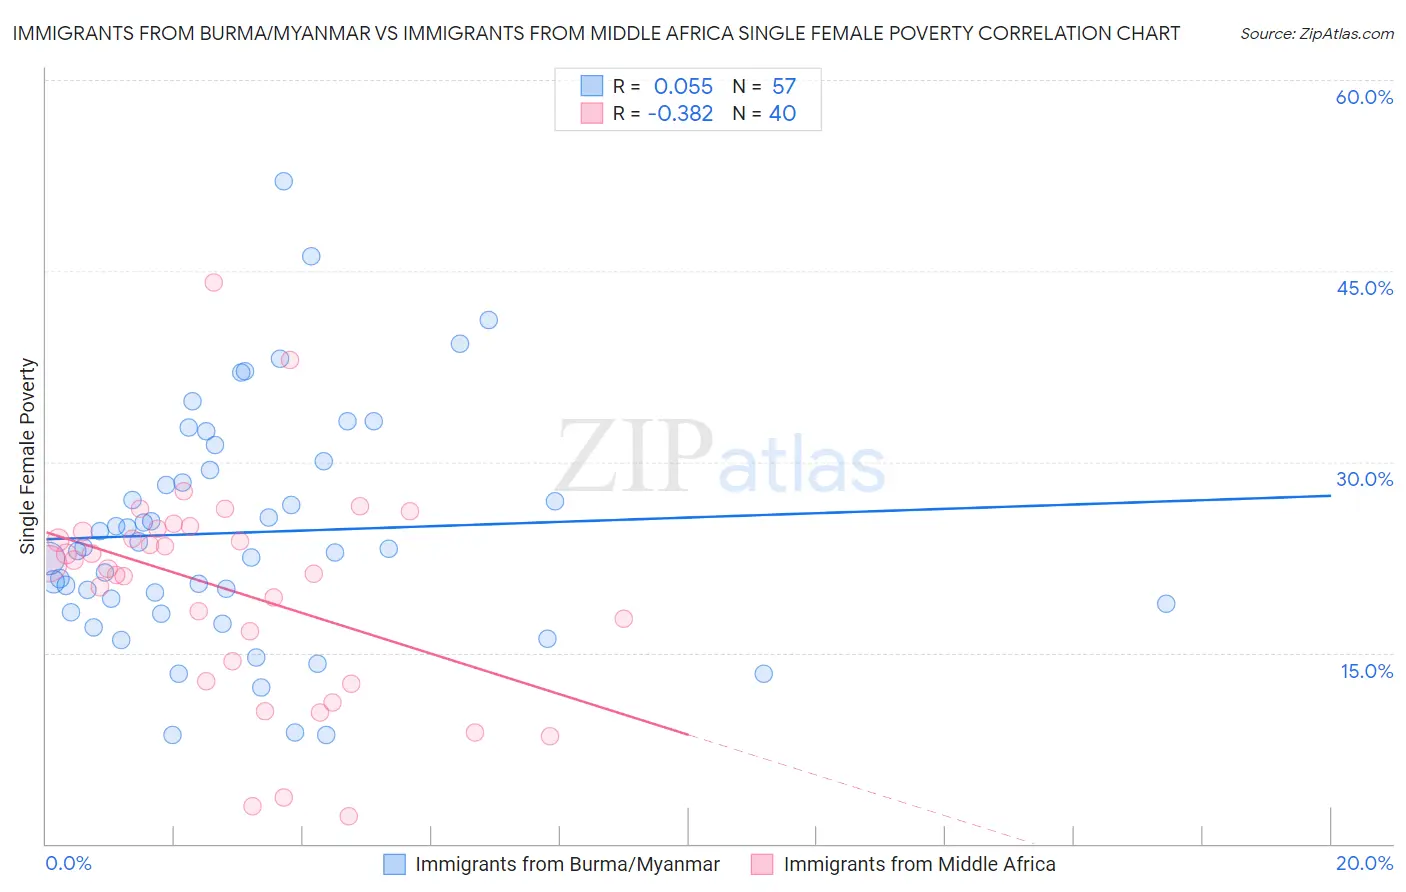
Immigrants from Burma/Myanmar vs Immigrants from Middle Africa Single Female Poverty Correlation Chart
The statistical analysis conducted on geographies consisting of 171,274,747 people shows a slight positive correlation between the proportion of Immigrants from Burma/Myanmar and poverty level among single females in the United States with a correlation coefficient (R) of 0.055 and weighted average of 22.6%. Similarly, the statistical analysis conducted on geographies consisting of 201,606,644 people shows a mild negative correlation between the proportion of Immigrants from Middle Africa and poverty level among single females in the United States with a correlation coefficient (R) of -0.382 and weighted average of 22.3%, a difference of 1.2%.
Single Female Poverty Correlation Summary
| Measurement | Immigrants from Burma/Myanmar | Immigrants from Middle Africa |
| Minimum | 8.5% | 2.2% |
| Maximum | 52.0% | 44.1% |
| Range | 43.5% | 42.0% |
| Mean | 24.5% | 19.9% |
| Median | 23.1% | 21.8% |
| Interquartile 25% (IQ1) | 18.5% | 13.6% |
| Interquartile 75% (IQ3) | 29.7% | 24.6% |
| Interquartile Range (IQR) | 11.2% | 11.1% |
| Standard Deviation (Sample) | 9.1% | 8.6% |
| Standard Deviation (Population) | 9.1% | 8.5% |
Demographics Similar to Immigrants from Burma/Myanmar and Immigrants from Middle Africa by Single Female Poverty
In terms of single female poverty, the demographic groups most similar to Immigrants from Burma/Myanmar are Immigrants from Sudan (22.6%, a difference of 0.0%), Immigrants from Liberia (22.5%, a difference of 0.10%), Immigrants from Belize (22.6%, a difference of 0.15%), Delaware (22.5%, a difference of 0.19%), and Sudanese (22.6%, a difference of 0.29%). Similarly, the demographic groups most similar to Immigrants from Middle Africa are West Indian (22.3%, a difference of 0.010%), Immigrants from Bangladesh (22.3%, a difference of 0.040%), Bermudan (22.3%, a difference of 0.10%), Cape Verdean (22.3%, a difference of 0.17%), and French (22.2%, a difference of 0.31%).
| Demographics | Rating | Rank | Single Female Poverty |
| Malaysians | 2.8 /100 | #239 | Tragic 22.2% |
| French | 2.3 /100 | #240 | Tragic 22.2% |
| Cape Verdeans | 2.1 /100 | #241 | Tragic 22.3% |
| Bermudans | 2.0 /100 | #242 | Tragic 22.3% |
| West Indians | 1.9 /100 | #243 | Tragic 22.3% |
| Immigrants | Middle Africa | 1.9 /100 | #244 | Tragic 22.3% |
| Immigrants | Bangladesh | 1.8 /100 | #245 | Tragic 22.3% |
| Liberians | 1.4 /100 | #246 | Tragic 22.4% |
| Immigrants | El Salvador | 1.4 /100 | #247 | Tragic 22.4% |
| Belizeans | 1.4 /100 | #248 | Tragic 22.4% |
| Immigrants | Caribbean | 1.3 /100 | #249 | Tragic 22.4% |
| Immigrants | Bahamas | 1.2 /100 | #250 | Tragic 22.5% |
| Immigrants | West Indies | 1.0 /100 | #251 | Tragic 22.5% |
| Delaware | 1.0 /100 | #252 | Tragic 22.5% |
| Immigrants | Liberia | 0.9 /100 | #253 | Tragic 22.5% |
| Immigrants | Burma/Myanmar | 0.8 /100 | #254 | Tragic 22.6% |
| Immigrants | Sudan | 0.8 /100 | #255 | Tragic 22.6% |
| Immigrants | Belize | 0.8 /100 | #256 | Tragic 22.6% |
| Sudanese | 0.7 /100 | #257 | Tragic 22.6% |
| Bahamians | 0.6 /100 | #258 | Tragic 22.7% |
| Whites/Caucasians | 0.6 /100 | #259 | Tragic 22.7% |