Yaqui vs Czech Married-Couple Family Poverty
COMPARE
Yaqui
Czech
Married-Couple Family Poverty
Married-Couple Family Poverty Comparison
Yaqui
Czechs
6.3%
MARRIED-COUPLE FAMILY POVERTY
0.1/ 100
METRIC RATING
276th/ 347
METRIC RANK
4.0%
MARRIED-COUPLE FAMILY POVERTY
100.0/ 100
METRIC RATING
13th/ 347
METRIC RANK
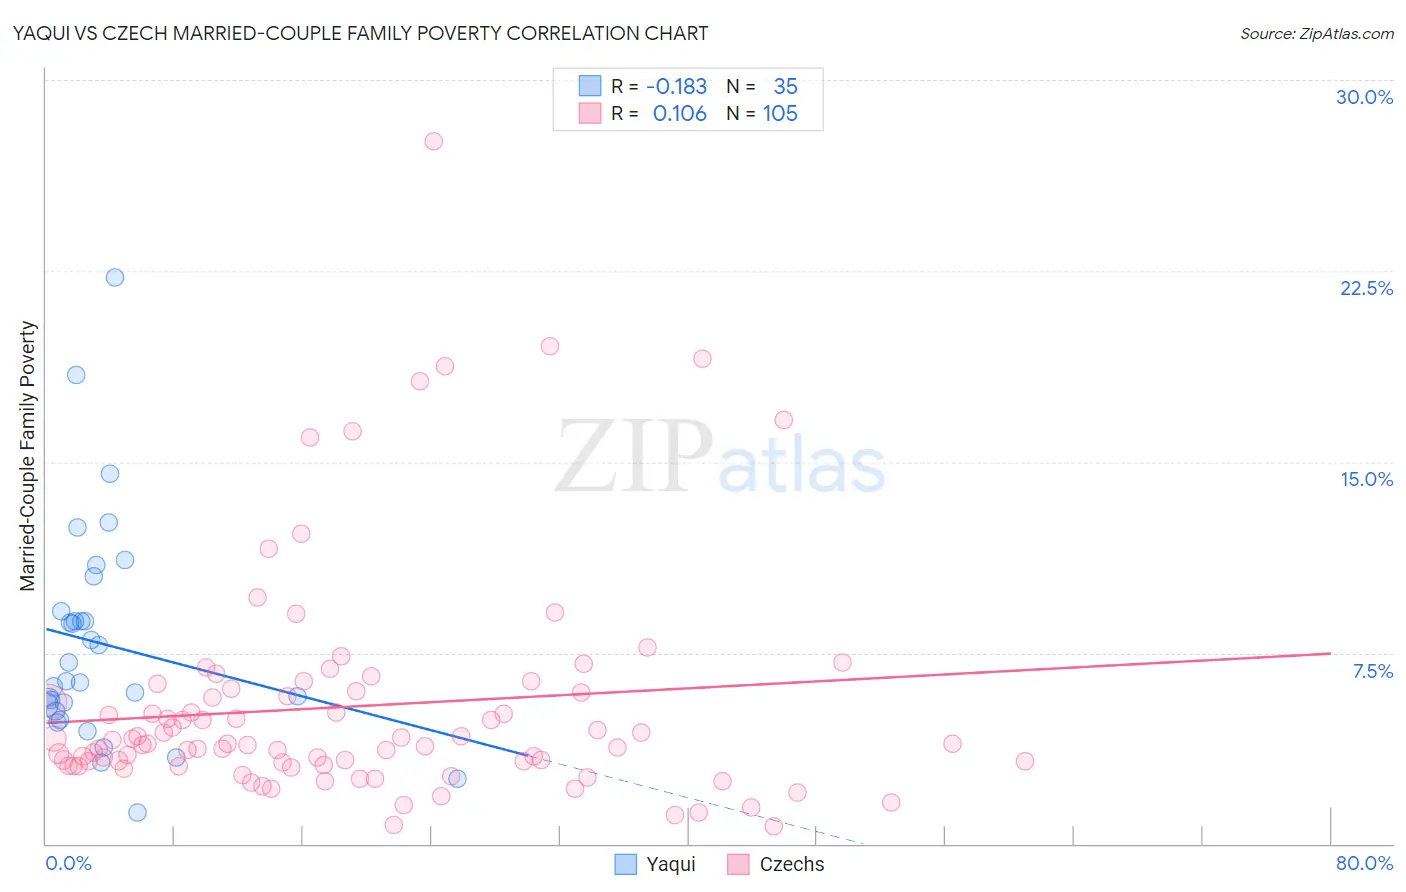
Yaqui vs Czech Married-Couple Family Poverty Correlation Chart
The statistical analysis conducted on geographies consisting of 107,553,636 people shows a poor negative correlation between the proportion of Yaqui and poverty level among married-couple families in the United States with a correlation coefficient (R) of -0.183 and weighted average of 6.3%. Similarly, the statistical analysis conducted on geographies consisting of 476,498,804 people shows a poor positive correlation between the proportion of Czechs and poverty level among married-couple families in the United States with a correlation coefficient (R) of 0.106 and weighted average of 4.0%, a difference of 57.2%.
Married-Couple Family Poverty Correlation Summary
| Measurement | Yaqui | Czech |
| Minimum | 1.2% | 0.69% |
| Maximum | 22.2% | 27.6% |
| Range | 21.0% | 26.9% |
| Mean | 7.9% | 5.4% |
| Median | 6.4% | 3.9% |
| Interquartile 25% (IQ1) | 5.2% | 3.1% |
| Interquartile 75% (IQ3) | 9.1% | 6.0% |
| Interquartile Range (IQR) | 3.9% | 2.9% |
| Standard Deviation (Sample) | 4.3% | 4.5% |
| Standard Deviation (Population) | 4.3% | 4.5% |
Similar Demographics by Married-Couple Family Poverty
Demographics Similar to Yaqui by Married-Couple Family Poverty
In terms of married-couple family poverty, the demographic groups most similar to Yaqui are Indonesian (6.3%, a difference of 0.14%), Choctaw (6.3%, a difference of 0.45%), Barbadian (6.3%, a difference of 0.62%), Immigrants from Trinidad and Tobago (6.4%, a difference of 0.62%), and Colville (6.3%, a difference of 0.66%).
| Demographics | Rating | Rank | Married-Couple Family Poverty |
| Immigrants | West Indies | 0.1 /100 | #269 | Tragic 6.2% |
| Immigrants | Jamaica | 0.1 /100 | #270 | Tragic 6.2% |
| Immigrants | Bahamas | 0.1 /100 | #271 | Tragic 6.2% |
| Trinidadians and Tobagonians | 0.1 /100 | #272 | Tragic 6.2% |
| Colville | 0.1 /100 | #273 | Tragic 6.3% |
| Barbadians | 0.1 /100 | #274 | Tragic 6.3% |
| Choctaw | 0.1 /100 | #275 | Tragic 6.3% |
| Yaqui | 0.1 /100 | #276 | Tragic 6.3% |
| Indonesians | 0.1 /100 | #277 | Tragic 6.3% |
| Immigrants | Trinidad and Tobago | 0.1 /100 | #278 | Tragic 6.4% |
| Houma | 0.0 /100 | #279 | Tragic 6.4% |
| West Indians | 0.0 /100 | #280 | Tragic 6.4% |
| Mexican American Indians | 0.0 /100 | #281 | Tragic 6.4% |
| Seminole | 0.0 /100 | #282 | Tragic 6.4% |
| Ute | 0.0 /100 | #283 | Tragic 6.4% |
Demographics Similar to Czechs by Married-Couple Family Poverty
In terms of married-couple family poverty, the demographic groups most similar to Czechs are Slovak (4.0%, a difference of 0.040%), Polish (4.0%, a difference of 0.070%), German (4.0%, a difference of 0.34%), Filipino (4.0%, a difference of 0.37%), and Italian (4.0%, a difference of 0.38%).
| Demographics | Rating | Rank | Married-Couple Family Poverty |
| Luxembourgers | 100.0 /100 | #6 | Exceptional 3.9% |
| Latvians | 100.0 /100 | #7 | Exceptional 3.9% |
| Thais | 100.0 /100 | #8 | Exceptional 3.9% |
| Croatians | 100.0 /100 | #9 | Exceptional 3.9% |
| Carpatho Rusyns | 100.0 /100 | #10 | Exceptional 3.9% |
| Lithuanians | 100.0 /100 | #11 | Exceptional 4.0% |
| Bulgarians | 100.0 /100 | #12 | Exceptional 4.0% |
| Czechs | 100.0 /100 | #13 | Exceptional 4.0% |
| Slovaks | 100.0 /100 | #14 | Exceptional 4.0% |
| Poles | 100.0 /100 | #15 | Exceptional 4.0% |
| Germans | 100.0 /100 | #16 | Exceptional 4.0% |
| Filipinos | 100.0 /100 | #17 | Exceptional 4.0% |
| Italians | 100.0 /100 | #18 | Exceptional 4.0% |
| Immigrants | Ireland | 99.9 /100 | #19 | Exceptional 4.1% |
| Maltese | 99.9 /100 | #20 | Exceptional 4.1% |