Immigrants from Haiti vs Czech Married-Couple Family Poverty
COMPARE
Immigrants from Haiti
Czech
Married-Couple Family Poverty
Married-Couple Family Poverty Comparison
Immigrants from Haiti
Czechs
7.0%
MARRIED-COUPLE FAMILY POVERTY
0.0/ 100
METRIC RATING
306th/ 347
METRIC RANK
4.0%
MARRIED-COUPLE FAMILY POVERTY
100.0/ 100
METRIC RATING
13th/ 347
METRIC RANK
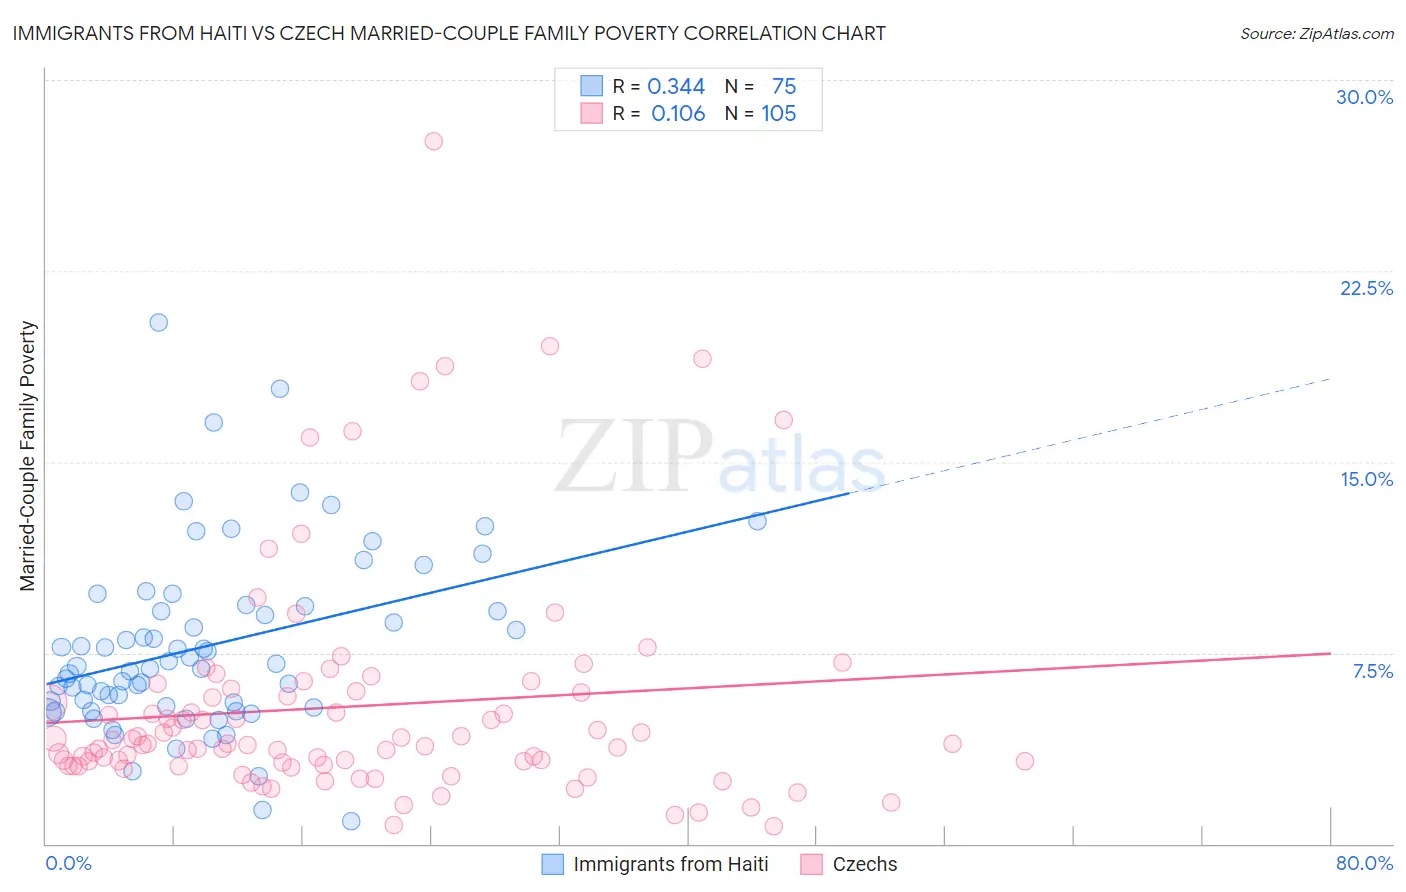
Immigrants from Haiti vs Czech Married-Couple Family Poverty Correlation Chart
The statistical analysis conducted on geographies consisting of 224,016,924 people shows a mild positive correlation between the proportion of Immigrants from Haiti and poverty level among married-couple families in the United States with a correlation coefficient (R) of 0.344 and weighted average of 7.0%. Similarly, the statistical analysis conducted on geographies consisting of 476,498,804 people shows a poor positive correlation between the proportion of Czechs and poverty level among married-couple families in the United States with a correlation coefficient (R) of 0.106 and weighted average of 4.0%, a difference of 73.1%.
Married-Couple Family Poverty Correlation Summary
| Measurement | Immigrants from Haiti | Czech |
| Minimum | 0.90% | 0.69% |
| Maximum | 20.5% | 27.6% |
| Range | 19.6% | 26.9% |
| Mean | 7.8% | 5.4% |
| Median | 7.0% | 3.9% |
| Interquartile 25% (IQ1) | 5.4% | 3.1% |
| Interquartile 75% (IQ3) | 9.3% | 6.0% |
| Interquartile Range (IQR) | 4.0% | 2.9% |
| Standard Deviation (Sample) | 3.5% | 4.5% |
| Standard Deviation (Population) | 3.5% | 4.5% |
Similar Demographics by Married-Couple Family Poverty
Demographics Similar to Immigrants from Haiti by Married-Couple Family Poverty
In terms of married-couple family poverty, the demographic groups most similar to Immigrants from Haiti are Guatemalan (7.0%, a difference of 1.1%), Spanish American Indian (7.1%, a difference of 1.3%), Hopi (7.1%, a difference of 1.9%), Immigrants from Nicaragua (7.1%, a difference of 1.9%), and Immigrants from Dominica (7.1%, a difference of 2.0%).
| Demographics | Rating | Rank | Married-Couple Family Poverty |
| Nicaraguans | 0.0 /100 | #299 | Tragic 6.7% |
| Immigrants | Belize | 0.0 /100 | #300 | Tragic 6.7% |
| Central Americans | 0.0 /100 | #301 | Tragic 6.7% |
| Immigrants | Ecuador | 0.0 /100 | #302 | Tragic 6.7% |
| Immigrants | El Salvador | 0.0 /100 | #303 | Tragic 6.8% |
| Cubans | 0.0 /100 | #304 | Tragic 6.8% |
| Haitians | 0.0 /100 | #305 | Tragic 6.8% |
| Immigrants | Haiti | 0.0 /100 | #306 | Tragic 7.0% |
| Guatemalans | 0.0 /100 | #307 | Tragic 7.0% |
| Spanish American Indians | 0.0 /100 | #308 | Tragic 7.1% |
| Hopi | 0.0 /100 | #309 | Tragic 7.1% |
| Immigrants | Nicaragua | 0.0 /100 | #310 | Tragic 7.1% |
| Immigrants | Dominica | 0.0 /100 | #311 | Tragic 7.1% |
| Immigrants | Armenia | 0.0 /100 | #312 | Tragic 7.1% |
| Immigrants | St. Vincent and the Grenadines | 0.0 /100 | #313 | Tragic 7.1% |
Demographics Similar to Czechs by Married-Couple Family Poverty
In terms of married-couple family poverty, the demographic groups most similar to Czechs are Slovak (4.0%, a difference of 0.040%), Polish (4.0%, a difference of 0.070%), German (4.0%, a difference of 0.34%), Filipino (4.0%, a difference of 0.37%), and Italian (4.0%, a difference of 0.38%).
| Demographics | Rating | Rank | Married-Couple Family Poverty |
| Luxembourgers | 100.0 /100 | #6 | Exceptional 3.9% |
| Latvians | 100.0 /100 | #7 | Exceptional 3.9% |
| Thais | 100.0 /100 | #8 | Exceptional 3.9% |
| Croatians | 100.0 /100 | #9 | Exceptional 3.9% |
| Carpatho Rusyns | 100.0 /100 | #10 | Exceptional 3.9% |
| Lithuanians | 100.0 /100 | #11 | Exceptional 4.0% |
| Bulgarians | 100.0 /100 | #12 | Exceptional 4.0% |
| Czechs | 100.0 /100 | #13 | Exceptional 4.0% |
| Slovaks | 100.0 /100 | #14 | Exceptional 4.0% |
| Poles | 100.0 /100 | #15 | Exceptional 4.0% |
| Germans | 100.0 /100 | #16 | Exceptional 4.0% |
| Filipinos | 100.0 /100 | #17 | Exceptional 4.0% |
| Italians | 100.0 /100 | #18 | Exceptional 4.0% |
| Immigrants | Ireland | 99.9 /100 | #19 | Exceptional 4.1% |
| Maltese | 99.9 /100 | #20 | Exceptional 4.1% |