Samoan vs Immigrants from Syria Married-Couple Family Poverty
COMPARE
Samoan
Immigrants from Syria
Married-Couple Family Poverty
Married-Couple Family Poverty Comparison
Samoans
Immigrants from Syria
4.9%
MARRIED-COUPLE FAMILY POVERTY
90.2/ 100
METRIC RATING
134th/ 347
METRIC RANK
5.5%
MARRIED-COUPLE FAMILY POVERTY
15.4/ 100
METRIC RATING
209th/ 347
METRIC RANK
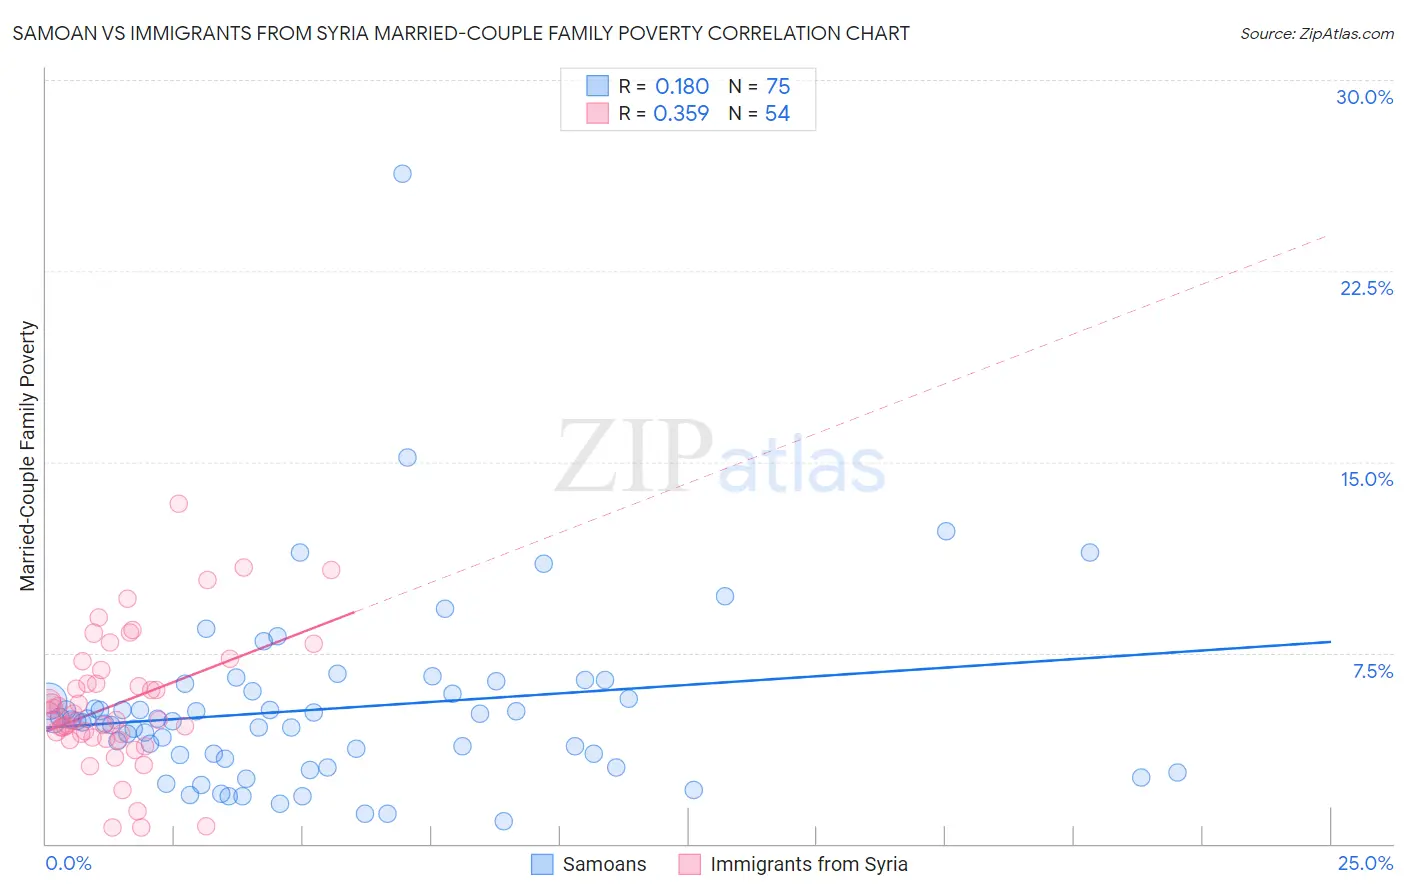
Samoan vs Immigrants from Syria Married-Couple Family Poverty Correlation Chart
The statistical analysis conducted on geographies consisting of 224,354,255 people shows a poor positive correlation between the proportion of Samoans and poverty level among married-couple families in the United States with a correlation coefficient (R) of 0.180 and weighted average of 4.9%. Similarly, the statistical analysis conducted on geographies consisting of 173,511,056 people shows a mild positive correlation between the proportion of Immigrants from Syria and poverty level among married-couple families in the United States with a correlation coefficient (R) of 0.359 and weighted average of 5.5%, a difference of 12.2%.
Married-Couple Family Poverty Correlation Summary
| Measurement | Samoan | Immigrants from Syria |
| Minimum | 0.90% | 0.62% |
| Maximum | 26.3% | 13.3% |
| Range | 25.4% | 12.7% |
| Mean | 5.3% | 5.5% |
| Median | 4.8% | 5.0% |
| Interquartile 25% (IQ1) | 3.3% | 4.2% |
| Interquartile 75% (IQ3) | 6.0% | 6.8% |
| Interquartile Range (IQR) | 2.7% | 2.6% |
| Standard Deviation (Sample) | 3.7% | 2.6% |
| Standard Deviation (Population) | 3.6% | 2.6% |
Similar Demographics by Married-Couple Family Poverty
Demographics Similar to Samoans by Married-Couple Family Poverty
In terms of married-couple family poverty, the demographic groups most similar to Samoans are Immigrants from Kenya (4.9%, a difference of 0.010%), Puget Sound Salish (4.9%, a difference of 0.080%), Immigrants from Eastern Europe (4.9%, a difference of 0.090%), Soviet Union (4.9%, a difference of 0.16%), and Immigrants from Pakistan (4.9%, a difference of 0.17%).
| Demographics | Rating | Rank | Married-Couple Family Poverty |
| Egyptians | 92.0 /100 | #127 | Exceptional 4.8% |
| Palestinians | 91.2 /100 | #128 | Exceptional 4.9% |
| Immigrants | Pakistan | 90.7 /100 | #129 | Exceptional 4.9% |
| Soviet Union | 90.7 /100 | #130 | Exceptional 4.9% |
| Immigrants | Eastern Europe | 90.5 /100 | #131 | Exceptional 4.9% |
| Puget Sound Salish | 90.4 /100 | #132 | Exceptional 4.9% |
| Immigrants | Kenya | 90.2 /100 | #133 | Exceptional 4.9% |
| Samoans | 90.2 /100 | #134 | Exceptional 4.9% |
| Assyrians/Chaldeans/Syriacs | 89.4 /100 | #135 | Excellent 4.9% |
| Immigrants | Hungary | 88.7 /100 | #136 | Excellent 4.9% |
| Guamanians/Chamorros | 86.5 /100 | #137 | Excellent 4.9% |
| Chileans | 86.0 /100 | #138 | Excellent 4.9% |
| German Russians | 85.1 /100 | #139 | Excellent 5.0% |
| Immigrants | Portugal | 84.8 /100 | #140 | Excellent 5.0% |
| Immigrants | Brazil | 84.6 /100 | #141 | Excellent 5.0% |
Demographics Similar to Immigrants from Syria by Married-Couple Family Poverty
In terms of married-couple family poverty, the demographic groups most similar to Immigrants from Syria are French American Indian (5.5%, a difference of 0.14%), Immigrants from Micronesia (5.5%, a difference of 0.21%), Nigerian (5.5%, a difference of 0.23%), Immigrants from Thailand (5.5%, a difference of 0.30%), and Immigrants from Africa (5.5%, a difference of 0.46%).
| Demographics | Rating | Rank | Married-Couple Family Poverty |
| Immigrants | Middle Africa | 23.8 /100 | #202 | Fair 5.4% |
| Immigrants | Peru | 21.8 /100 | #203 | Fair 5.4% |
| Immigrants | Costa Rica | 19.4 /100 | #204 | Poor 5.4% |
| Chippewa | 18.9 /100 | #205 | Poor 5.4% |
| Osage | 18.4 /100 | #206 | Poor 5.4% |
| Immigrants | Africa | 17.6 /100 | #207 | Poor 5.5% |
| French American Indians | 16.1 /100 | #208 | Poor 5.5% |
| Immigrants | Syria | 15.4 /100 | #209 | Poor 5.5% |
| Immigrants | Micronesia | 14.4 /100 | #210 | Poor 5.5% |
| Nigerians | 14.3 /100 | #211 | Poor 5.5% |
| Immigrants | Thailand | 14.0 /100 | #212 | Poor 5.5% |
| Immigrants | Liberia | 13.3 /100 | #213 | Poor 5.5% |
| Iroquois | 13.1 /100 | #214 | Poor 5.5% |
| Armenians | 12.8 /100 | #215 | Poor 5.5% |
| Potawatomi | 12.4 /100 | #216 | Poor 5.5% |