Polish vs West Indian Married-Couple Family Poverty
COMPARE
Polish
West Indian
Married-Couple Family Poverty
Married-Couple Family Poverty Comparison
Poles
West Indians
4.0%
MARRIED-COUPLE FAMILY POVERTY
100.0/ 100
METRIC RATING
15th/ 347
METRIC RANK
6.4%
MARRIED-COUPLE FAMILY POVERTY
0.0/ 100
METRIC RATING
280th/ 347
METRIC RANK
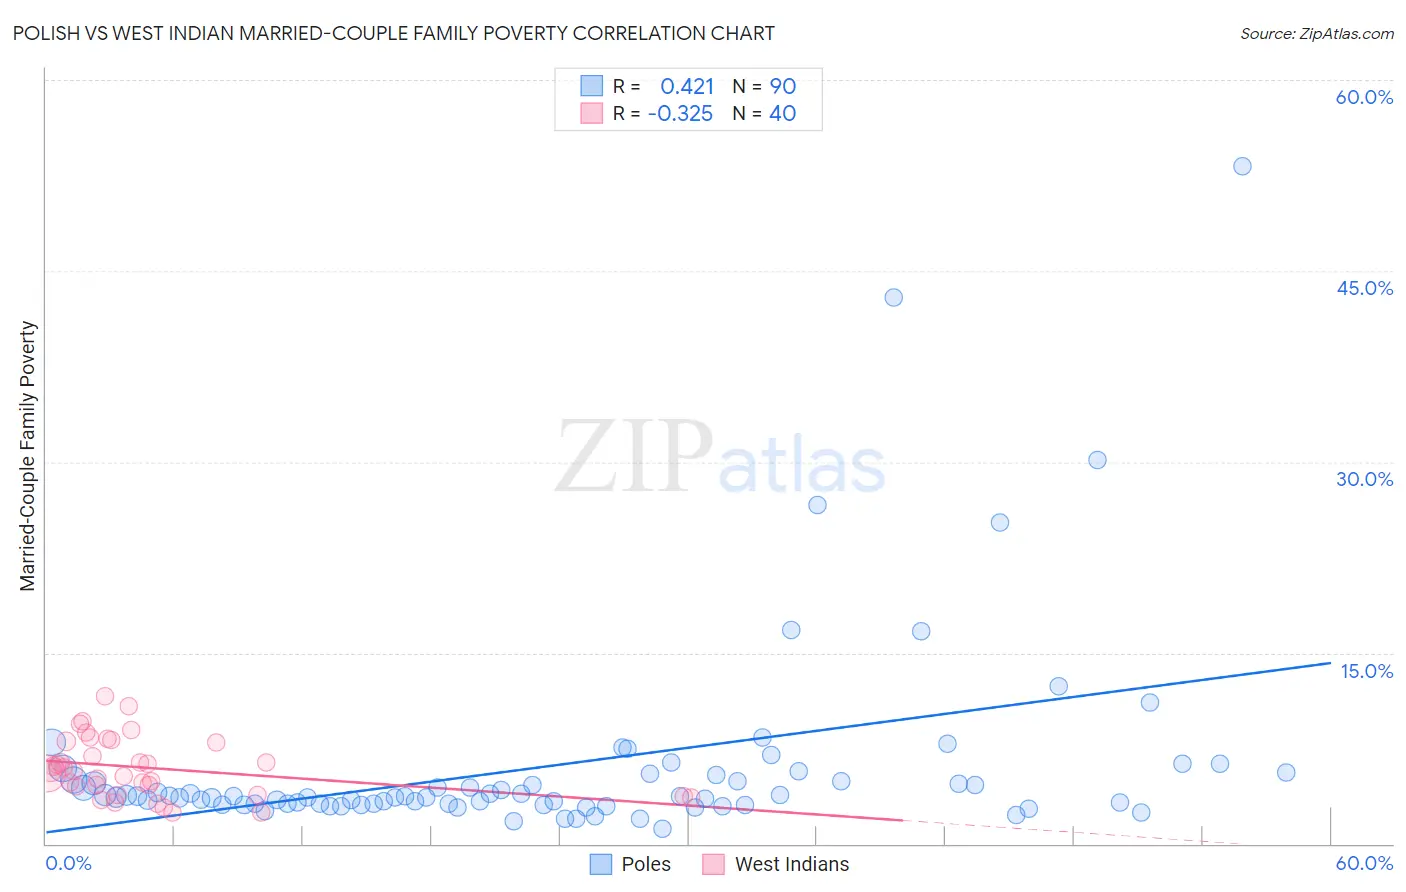
Polish vs West Indian Married-Couple Family Poverty Correlation Chart
The statistical analysis conducted on geographies consisting of 546,544,798 people shows a moderate positive correlation between the proportion of Poles and poverty level among married-couple families in the United States with a correlation coefficient (R) of 0.421 and weighted average of 4.0%. Similarly, the statistical analysis conducted on geographies consisting of 252,794,442 people shows a mild negative correlation between the proportion of West Indians and poverty level among married-couple families in the United States with a correlation coefficient (R) of -0.325 and weighted average of 6.4%, a difference of 58.5%.
Married-Couple Family Poverty Correlation Summary
| Measurement | Polish | West Indian |
| Minimum | 1.1% | 2.5% |
| Maximum | 53.2% | 11.6% |
| Range | 52.1% | 9.1% |
| Mean | 6.2% | 6.0% |
| Median | 3.7% | 5.7% |
| Interquartile 25% (IQ1) | 3.1% | 4.2% |
| Interquartile 75% (IQ3) | 5.4% | 8.0% |
| Interquartile Range (IQR) | 2.3% | 3.8% |
| Standard Deviation (Sample) | 8.1% | 2.3% |
| Standard Deviation (Population) | 8.0% | 2.3% |
Similar Demographics by Married-Couple Family Poverty
Demographics Similar to Poles by Married-Couple Family Poverty
In terms of married-couple family poverty, the demographic groups most similar to Poles are Slovak (4.0%, a difference of 0.030%), Czech (4.0%, a difference of 0.070%), German (4.0%, a difference of 0.27%), Filipino (4.0%, a difference of 0.30%), and Italian (4.0%, a difference of 0.31%).
| Demographics | Rating | Rank | Married-Couple Family Poverty |
| Thais | 100.0 /100 | #8 | Exceptional 3.9% |
| Croatians | 100.0 /100 | #9 | Exceptional 3.9% |
| Carpatho Rusyns | 100.0 /100 | #10 | Exceptional 3.9% |
| Lithuanians | 100.0 /100 | #11 | Exceptional 4.0% |
| Bulgarians | 100.0 /100 | #12 | Exceptional 4.0% |
| Czechs | 100.0 /100 | #13 | Exceptional 4.0% |
| Slovaks | 100.0 /100 | #14 | Exceptional 4.0% |
| Poles | 100.0 /100 | #15 | Exceptional 4.0% |
| Germans | 100.0 /100 | #16 | Exceptional 4.0% |
| Filipinos | 100.0 /100 | #17 | Exceptional 4.0% |
| Italians | 100.0 /100 | #18 | Exceptional 4.0% |
| Immigrants | Ireland | 99.9 /100 | #19 | Exceptional 4.1% |
| Maltese | 99.9 /100 | #20 | Exceptional 4.1% |
| Zimbabweans | 99.9 /100 | #21 | Exceptional 4.1% |
| Immigrants | Singapore | 99.9 /100 | #22 | Exceptional 4.1% |
Demographics Similar to West Indians by Married-Couple Family Poverty
In terms of married-couple family poverty, the demographic groups most similar to West Indians are Houma (6.4%, a difference of 0.050%), Immigrants from Trinidad and Tobago (6.4%, a difference of 0.29%), Mexican American Indian (6.4%, a difference of 0.51%), Seminole (6.4%, a difference of 0.51%), and Indonesian (6.3%, a difference of 0.78%).
| Demographics | Rating | Rank | Married-Couple Family Poverty |
| Colville | 0.1 /100 | #273 | Tragic 6.3% |
| Barbadians | 0.1 /100 | #274 | Tragic 6.3% |
| Choctaw | 0.1 /100 | #275 | Tragic 6.3% |
| Yaqui | 0.1 /100 | #276 | Tragic 6.3% |
| Indonesians | 0.1 /100 | #277 | Tragic 6.3% |
| Immigrants | Trinidad and Tobago | 0.1 /100 | #278 | Tragic 6.4% |
| Houma | 0.0 /100 | #279 | Tragic 6.4% |
| West Indians | 0.0 /100 | #280 | Tragic 6.4% |
| Mexican American Indians | 0.0 /100 | #281 | Tragic 6.4% |
| Seminole | 0.0 /100 | #282 | Tragic 6.4% |
| Ute | 0.0 /100 | #283 | Tragic 6.4% |
| Dutch West Indians | 0.0 /100 | #284 | Tragic 6.4% |
| Blacks/African Americans | 0.0 /100 | #285 | Tragic 6.5% |
| Guyanese | 0.0 /100 | #286 | Tragic 6.5% |
| Ecuadorians | 0.0 /100 | #287 | Tragic 6.5% |