Polish vs English Married-Couple Family Poverty
COMPARE
Polish
English
Married-Couple Family Poverty
Married-Couple Family Poverty Comparison
Poles
English
4.0%
MARRIED-COUPLE FAMILY POVERTY
100.0/ 100
METRIC RATING
15th/ 347
METRIC RANK
4.2%
MARRIED-COUPLE FAMILY POVERTY
99.9/ 100
METRIC RATING
36th/ 347
METRIC RANK
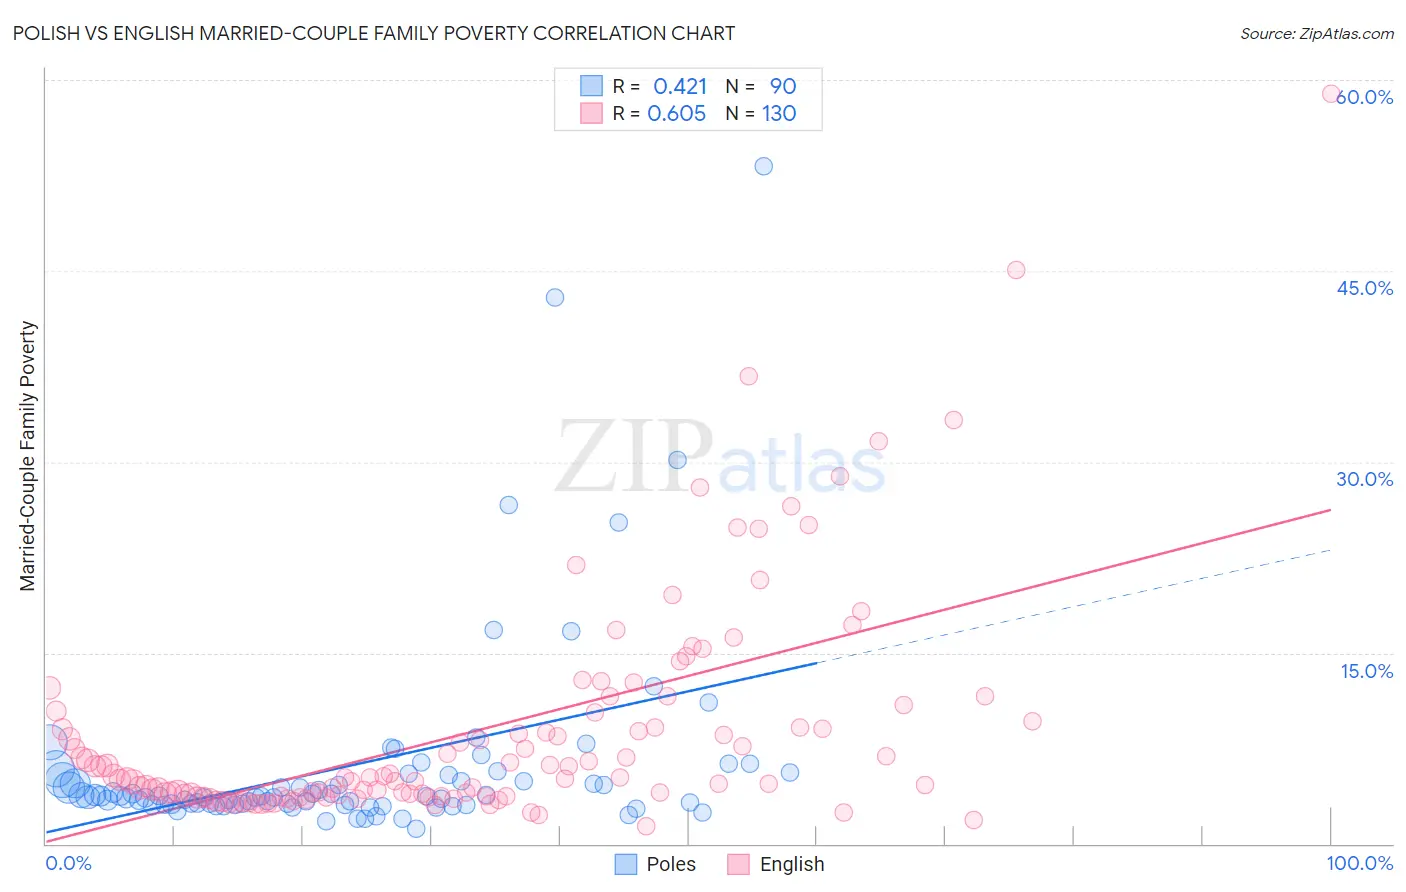
Polish vs English Married-Couple Family Poverty Correlation Chart
The statistical analysis conducted on geographies consisting of 546,544,798 people shows a moderate positive correlation between the proportion of Poles and poverty level among married-couple families in the United States with a correlation coefficient (R) of 0.421 and weighted average of 4.0%. Similarly, the statistical analysis conducted on geographies consisting of 562,851,245 people shows a significant positive correlation between the proportion of English and poverty level among married-couple families in the United States with a correlation coefficient (R) of 0.605 and weighted average of 4.2%, a difference of 4.9%.
Married-Couple Family Poverty Correlation Summary
| Measurement | Polish | English |
| Minimum | 1.1% | 1.4% |
| Maximum | 53.2% | 58.9% |
| Range | 52.1% | 57.6% |
| Mean | 6.2% | 8.9% |
| Median | 3.7% | 5.2% |
| Interquartile 25% (IQ1) | 3.1% | 3.7% |
| Interquartile 75% (IQ3) | 5.4% | 9.6% |
| Interquartile Range (IQR) | 2.3% | 5.9% |
| Standard Deviation (Sample) | 8.1% | 9.0% |
| Standard Deviation (Population) | 8.0% | 8.9% |
Similar Demographics by Married-Couple Family Poverty
Demographics Similar to Poles by Married-Couple Family Poverty
In terms of married-couple family poverty, the demographic groups most similar to Poles are Slovak (4.0%, a difference of 0.030%), Czech (4.0%, a difference of 0.070%), German (4.0%, a difference of 0.27%), Filipino (4.0%, a difference of 0.30%), and Italian (4.0%, a difference of 0.31%).
| Demographics | Rating | Rank | Married-Couple Family Poverty |
| Thais | 100.0 /100 | #8 | Exceptional 3.9% |
| Croatians | 100.0 /100 | #9 | Exceptional 3.9% |
| Carpatho Rusyns | 100.0 /100 | #10 | Exceptional 3.9% |
| Lithuanians | 100.0 /100 | #11 | Exceptional 4.0% |
| Bulgarians | 100.0 /100 | #12 | Exceptional 4.0% |
| Czechs | 100.0 /100 | #13 | Exceptional 4.0% |
| Slovaks | 100.0 /100 | #14 | Exceptional 4.0% |
| Poles | 100.0 /100 | #15 | Exceptional 4.0% |
| Germans | 100.0 /100 | #16 | Exceptional 4.0% |
| Filipinos | 100.0 /100 | #17 | Exceptional 4.0% |
| Italians | 100.0 /100 | #18 | Exceptional 4.0% |
| Immigrants | Ireland | 99.9 /100 | #19 | Exceptional 4.1% |
| Maltese | 99.9 /100 | #20 | Exceptional 4.1% |
| Zimbabweans | 99.9 /100 | #21 | Exceptional 4.1% |
| Immigrants | Singapore | 99.9 /100 | #22 | Exceptional 4.1% |
Demographics Similar to English by Married-Couple Family Poverty
In terms of married-couple family poverty, the demographic groups most similar to English are European (4.2%, a difference of 0.030%), Iranian (4.2%, a difference of 0.070%), Belgian (4.2%, a difference of 0.19%), Immigrants from Northern Europe (4.2%, a difference of 0.32%), and Dutch (4.2%, a difference of 0.60%).
| Demographics | Rating | Rank | Married-Couple Family Poverty |
| Immigrants | Scotland | 99.9 /100 | #29 | Exceptional 4.2% |
| Finns | 99.9 /100 | #30 | Exceptional 4.2% |
| Estonians | 99.9 /100 | #31 | Exceptional 4.2% |
| Greeks | 99.9 /100 | #32 | Exceptional 4.2% |
| Irish | 99.9 /100 | #33 | Exceptional 4.2% |
| Dutch | 99.9 /100 | #34 | Exceptional 4.2% |
| Europeans | 99.9 /100 | #35 | Exceptional 4.2% |
| English | 99.9 /100 | #36 | Exceptional 4.2% |
| Iranians | 99.9 /100 | #37 | Exceptional 4.2% |
| Belgians | 99.9 /100 | #38 | Exceptional 4.2% |
| Immigrants | Northern Europe | 99.8 /100 | #39 | Exceptional 4.2% |
| French Canadians | 99.8 /100 | #40 | Exceptional 4.2% |
| Northern Europeans | 99.8 /100 | #41 | Exceptional 4.3% |
| Scottish | 99.8 /100 | #42 | Exceptional 4.3% |
| Swiss | 99.8 /100 | #43 | Exceptional 4.3% |