Polish vs Immigrants from Uruguay Married-Couple Family Poverty
COMPARE
Polish
Immigrants from Uruguay
Married-Couple Family Poverty
Married-Couple Family Poverty Comparison
Poles
Immigrants from Uruguay
4.0%
MARRIED-COUPLE FAMILY POVERTY
100.0/ 100
METRIC RATING
15th/ 347
METRIC RANK
5.7%
MARRIED-COUPLE FAMILY POVERTY
3.7/ 100
METRIC RATING
234th/ 347
METRIC RANK
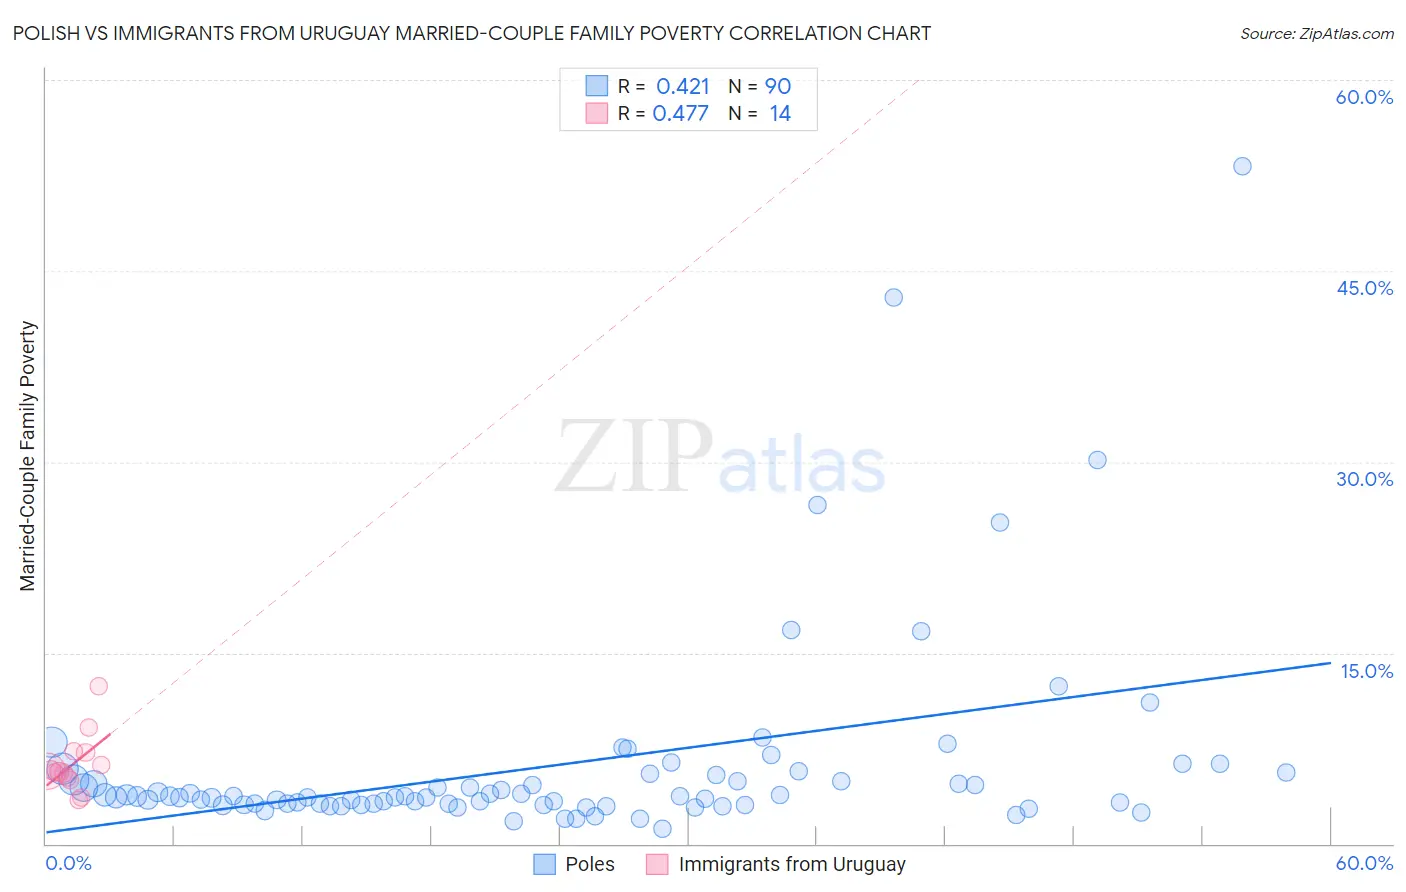
Polish vs Immigrants from Uruguay Married-Couple Family Poverty Correlation Chart
The statistical analysis conducted on geographies consisting of 546,544,798 people shows a moderate positive correlation between the proportion of Poles and poverty level among married-couple families in the United States with a correlation coefficient (R) of 0.421 and weighted average of 4.0%. Similarly, the statistical analysis conducted on geographies consisting of 132,847,236 people shows a moderate positive correlation between the proportion of Immigrants from Uruguay and poverty level among married-couple families in the United States with a correlation coefficient (R) of 0.477 and weighted average of 5.7%, a difference of 41.9%.
Married-Couple Family Poverty Correlation Summary
| Measurement | Polish | Immigrants from Uruguay |
| Minimum | 1.1% | 3.4% |
| Maximum | 53.2% | 12.4% |
| Range | 52.1% | 9.0% |
| Mean | 6.2% | 6.3% |
| Median | 3.7% | 5.7% |
| Interquartile 25% (IQ1) | 3.1% | 5.2% |
| Interquartile 75% (IQ3) | 5.4% | 7.2% |
| Interquartile Range (IQR) | 2.3% | 2.0% |
| Standard Deviation (Sample) | 8.1% | 2.3% |
| Standard Deviation (Population) | 8.0% | 2.2% |
Similar Demographics by Married-Couple Family Poverty
Demographics Similar to Poles by Married-Couple Family Poverty
In terms of married-couple family poverty, the demographic groups most similar to Poles are Slovak (4.0%, a difference of 0.030%), Czech (4.0%, a difference of 0.070%), German (4.0%, a difference of 0.27%), Filipino (4.0%, a difference of 0.30%), and Italian (4.0%, a difference of 0.31%).
| Demographics | Rating | Rank | Married-Couple Family Poverty |
| Thais | 100.0 /100 | #8 | Exceptional 3.9% |
| Croatians | 100.0 /100 | #9 | Exceptional 3.9% |
| Carpatho Rusyns | 100.0 /100 | #10 | Exceptional 3.9% |
| Lithuanians | 100.0 /100 | #11 | Exceptional 4.0% |
| Bulgarians | 100.0 /100 | #12 | Exceptional 4.0% |
| Czechs | 100.0 /100 | #13 | Exceptional 4.0% |
| Slovaks | 100.0 /100 | #14 | Exceptional 4.0% |
| Poles | 100.0 /100 | #15 | Exceptional 4.0% |
| Germans | 100.0 /100 | #16 | Exceptional 4.0% |
| Filipinos | 100.0 /100 | #17 | Exceptional 4.0% |
| Italians | 100.0 /100 | #18 | Exceptional 4.0% |
| Immigrants | Ireland | 99.9 /100 | #19 | Exceptional 4.1% |
| Maltese | 99.9 /100 | #20 | Exceptional 4.1% |
| Zimbabweans | 99.9 /100 | #21 | Exceptional 4.1% |
| Immigrants | Singapore | 99.9 /100 | #22 | Exceptional 4.1% |
Demographics Similar to Immigrants from Uruguay by Married-Couple Family Poverty
In terms of married-couple family poverty, the demographic groups most similar to Immigrants from Uruguay are Immigrants from Colombia (5.7%, a difference of 0.010%), Immigrants from Sudan (5.7%, a difference of 0.19%), Ghanaian (5.7%, a difference of 0.35%), Immigrants from Laos (5.7%, a difference of 0.44%), and Immigrants from Iraq (5.7%, a difference of 0.50%).
| Demographics | Rating | Rank | Married-Couple Family Poverty |
| Immigrants | Zaire | 5.6 /100 | #227 | Tragic 5.6% |
| Arabs | 5.4 /100 | #228 | Tragic 5.7% |
| Sub-Saharan Africans | 4.9 /100 | #229 | Tragic 5.7% |
| Moroccans | 4.9 /100 | #230 | Tragic 5.7% |
| Immigrants | Iraq | 4.4 /100 | #231 | Tragic 5.7% |
| Immigrants | Laos | 4.4 /100 | #232 | Tragic 5.7% |
| Immigrants | Colombia | 3.7 /100 | #233 | Tragic 5.7% |
| Immigrants | Uruguay | 3.7 /100 | #234 | Tragic 5.7% |
| Immigrants | Sudan | 3.5 /100 | #235 | Tragic 5.7% |
| Ghanaians | 3.3 /100 | #236 | Tragic 5.7% |
| Immigrants | South America | 3.1 /100 | #237 | Tragic 5.7% |
| Cherokee | 2.7 /100 | #238 | Tragic 5.8% |
| Venezuelans | 2.7 /100 | #239 | Tragic 5.8% |
| Fijians | 2.5 /100 | #240 | Tragic 5.8% |
| Immigrants | Panama | 2.5 /100 | #241 | Tragic 5.8% |