Immigrants from Singapore vs Immigrants from Trinidad and Tobago Married-Couple Family Poverty
COMPARE
Immigrants from Singapore
Immigrants from Trinidad and Tobago
Married-Couple Family Poverty
Married-Couple Family Poverty Comparison
Immigrants from Singapore
Immigrants from Trinidad and Tobago
4.1%
MARRIED-COUPLE FAMILY POVERTY
99.9/ 100
METRIC RATING
22nd/ 347
METRIC RANK
6.4%
MARRIED-COUPLE FAMILY POVERTY
0.1/ 100
METRIC RATING
278th/ 347
METRIC RANK
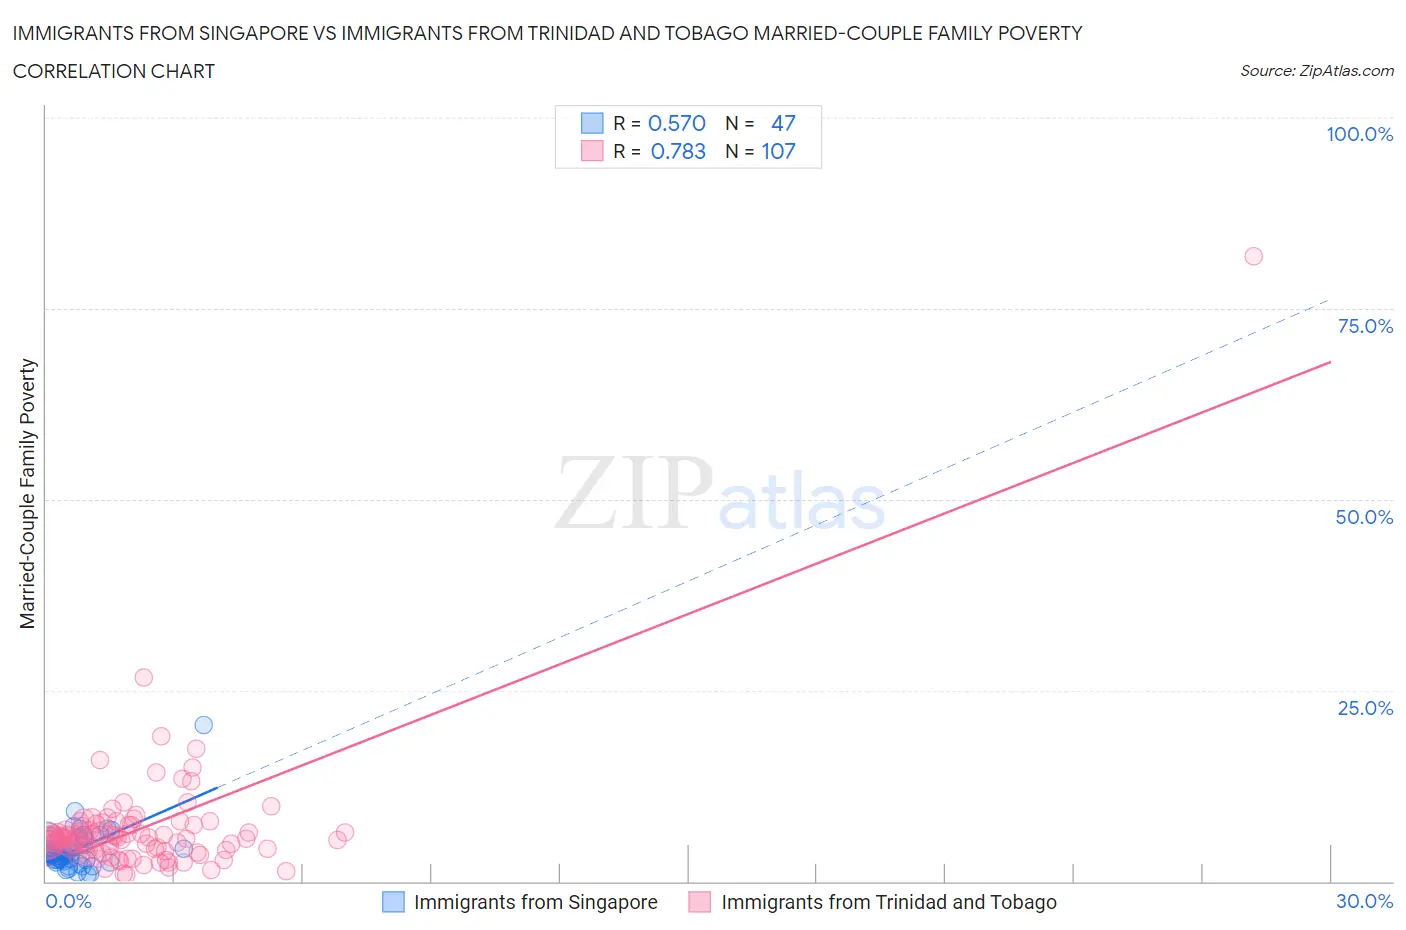
Immigrants from Singapore vs Immigrants from Trinidad and Tobago Married-Couple Family Poverty Correlation Chart
The statistical analysis conducted on geographies consisting of 136,997,668 people shows a substantial positive correlation between the proportion of Immigrants from Singapore and poverty level among married-couple families in the United States with a correlation coefficient (R) of 0.570 and weighted average of 4.1%. Similarly, the statistical analysis conducted on geographies consisting of 222,433,461 people shows a strong positive correlation between the proportion of Immigrants from Trinidad and Tobago and poverty level among married-couple families in the United States with a correlation coefficient (R) of 0.783 and weighted average of 6.4%, a difference of 55.4%.
Married-Couple Family Poverty Correlation Summary
| Measurement | Immigrants from Singapore | Immigrants from Trinidad and Tobago |
| Minimum | 0.78% | 0.88% |
| Maximum | 20.5% | 81.8% |
| Range | 19.7% | 80.9% |
| Mean | 4.1% | 6.9% |
| Median | 3.6% | 5.6% |
| Interquartile 25% (IQ1) | 2.6% | 4.1% |
| Interquartile 75% (IQ3) | 5.4% | 7.4% |
| Interquartile Range (IQR) | 2.8% | 3.2% |
| Standard Deviation (Sample) | 3.0% | 8.2% |
| Standard Deviation (Population) | 3.0% | 8.2% |
Similar Demographics by Married-Couple Family Poverty
Demographics Similar to Immigrants from Singapore by Married-Couple Family Poverty
In terms of married-couple family poverty, the demographic groups most similar to Immigrants from Singapore are Bhutanese (4.1%, a difference of 0.020%), Eastern European (4.1%, a difference of 0.26%), Zimbabwean (4.1%, a difference of 0.37%), Maltese (4.1%, a difference of 0.40%), and Immigrants from Ireland (4.1%, a difference of 0.64%).
| Demographics | Rating | Rank | Married-Couple Family Poverty |
| Poles | 100.0 /100 | #15 | Exceptional 4.0% |
| Germans | 100.0 /100 | #16 | Exceptional 4.0% |
| Filipinos | 100.0 /100 | #17 | Exceptional 4.0% |
| Italians | 100.0 /100 | #18 | Exceptional 4.0% |
| Immigrants | Ireland | 99.9 /100 | #19 | Exceptional 4.1% |
| Maltese | 99.9 /100 | #20 | Exceptional 4.1% |
| Zimbabweans | 99.9 /100 | #21 | Exceptional 4.1% |
| Immigrants | Singapore | 99.9 /100 | #22 | Exceptional 4.1% |
| Bhutanese | 99.9 /100 | #23 | Exceptional 4.1% |
| Eastern Europeans | 99.9 /100 | #24 | Exceptional 4.1% |
| Immigrants | Taiwan | 99.9 /100 | #25 | Exceptional 4.1% |
| Cypriots | 99.9 /100 | #26 | Exceptional 4.1% |
| Danes | 99.9 /100 | #27 | Exceptional 4.1% |
| Scandinavians | 99.9 /100 | #28 | Exceptional 4.1% |
| Immigrants | Scotland | 99.9 /100 | #29 | Exceptional 4.2% |
Demographics Similar to Immigrants from Trinidad and Tobago by Married-Couple Family Poverty
In terms of married-couple family poverty, the demographic groups most similar to Immigrants from Trinidad and Tobago are Houma (6.4%, a difference of 0.25%), West Indian (6.4%, a difference of 0.29%), Indonesian (6.3%, a difference of 0.48%), Yaqui (6.3%, a difference of 0.62%), and Mexican American Indian (6.4%, a difference of 0.80%).
| Demographics | Rating | Rank | Married-Couple Family Poverty |
| Immigrants | Bahamas | 0.1 /100 | #271 | Tragic 6.2% |
| Trinidadians and Tobagonians | 0.1 /100 | #272 | Tragic 6.2% |
| Colville | 0.1 /100 | #273 | Tragic 6.3% |
| Barbadians | 0.1 /100 | #274 | Tragic 6.3% |
| Choctaw | 0.1 /100 | #275 | Tragic 6.3% |
| Yaqui | 0.1 /100 | #276 | Tragic 6.3% |
| Indonesians | 0.1 /100 | #277 | Tragic 6.3% |
| Immigrants | Trinidad and Tobago | 0.1 /100 | #278 | Tragic 6.4% |
| Houma | 0.0 /100 | #279 | Tragic 6.4% |
| West Indians | 0.0 /100 | #280 | Tragic 6.4% |
| Mexican American Indians | 0.0 /100 | #281 | Tragic 6.4% |
| Seminole | 0.0 /100 | #282 | Tragic 6.4% |
| Ute | 0.0 /100 | #283 | Tragic 6.4% |
| Dutch West Indians | 0.0 /100 | #284 | Tragic 6.4% |
| Blacks/African Americans | 0.0 /100 | #285 | Tragic 6.5% |