Immigrants from Singapore vs Immigrants from Sierra Leone Married-Couple Family Poverty
COMPARE
Immigrants from Singapore
Immigrants from Sierra Leone
Married-Couple Family Poverty
Married-Couple Family Poverty Comparison
Immigrants from Singapore
Immigrants from Sierra Leone
4.1%
MARRIED-COUPLE FAMILY POVERTY
99.9/ 100
METRIC RATING
22nd/ 347
METRIC RANK
5.3%
MARRIED-COUPLE FAMILY POVERTY
39.3/ 100
METRIC RATING
180th/ 347
METRIC RANK
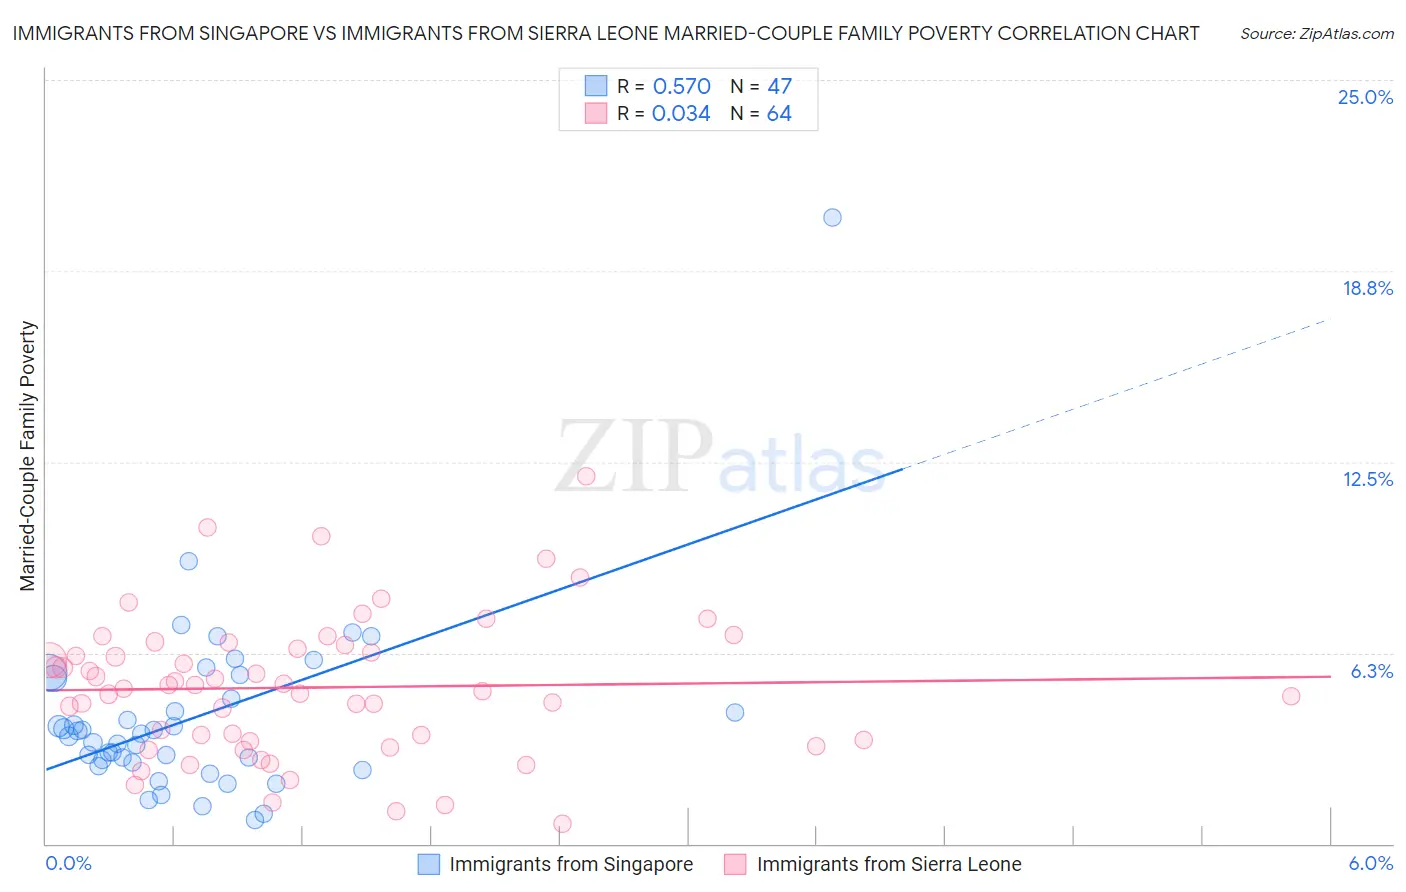
Immigrants from Singapore vs Immigrants from Sierra Leone Married-Couple Family Poverty Correlation Chart
The statistical analysis conducted on geographies consisting of 136,997,668 people shows a substantial positive correlation between the proportion of Immigrants from Singapore and poverty level among married-couple families in the United States with a correlation coefficient (R) of 0.570 and weighted average of 4.1%. Similarly, the statistical analysis conducted on geographies consisting of 101,444,500 people shows no correlation between the proportion of Immigrants from Sierra Leone and poverty level among married-couple families in the United States with a correlation coefficient (R) of 0.034 and weighted average of 5.3%, a difference of 29.1%.
Married-Couple Family Poverty Correlation Summary
| Measurement | Immigrants from Singapore | Immigrants from Sierra Leone |
| Minimum | 0.78% | 0.66% |
| Maximum | 20.5% | 12.0% |
| Range | 19.7% | 11.4% |
| Mean | 4.1% | 5.1% |
| Median | 3.6% | 5.1% |
| Interquartile 25% (IQ1) | 2.6% | 3.4% |
| Interquartile 75% (IQ3) | 5.4% | 6.4% |
| Interquartile Range (IQR) | 2.8% | 3.1% |
| Standard Deviation (Sample) | 3.0% | 2.3% |
| Standard Deviation (Population) | 3.0% | 2.3% |
Similar Demographics by Married-Couple Family Poverty
Demographics Similar to Immigrants from Singapore by Married-Couple Family Poverty
In terms of married-couple family poverty, the demographic groups most similar to Immigrants from Singapore are Bhutanese (4.1%, a difference of 0.020%), Eastern European (4.1%, a difference of 0.26%), Zimbabwean (4.1%, a difference of 0.37%), Maltese (4.1%, a difference of 0.40%), and Immigrants from Ireland (4.1%, a difference of 0.64%).
| Demographics | Rating | Rank | Married-Couple Family Poverty |
| Poles | 100.0 /100 | #15 | Exceptional 4.0% |
| Germans | 100.0 /100 | #16 | Exceptional 4.0% |
| Filipinos | 100.0 /100 | #17 | Exceptional 4.0% |
| Italians | 100.0 /100 | #18 | Exceptional 4.0% |
| Immigrants | Ireland | 99.9 /100 | #19 | Exceptional 4.1% |
| Maltese | 99.9 /100 | #20 | Exceptional 4.1% |
| Zimbabweans | 99.9 /100 | #21 | Exceptional 4.1% |
| Immigrants | Singapore | 99.9 /100 | #22 | Exceptional 4.1% |
| Bhutanese | 99.9 /100 | #23 | Exceptional 4.1% |
| Eastern Europeans | 99.9 /100 | #24 | Exceptional 4.1% |
| Immigrants | Taiwan | 99.9 /100 | #25 | Exceptional 4.1% |
| Cypriots | 99.9 /100 | #26 | Exceptional 4.1% |
| Danes | 99.9 /100 | #27 | Exceptional 4.1% |
| Scandinavians | 99.9 /100 | #28 | Exceptional 4.1% |
| Immigrants | Scotland | 99.9 /100 | #29 | Exceptional 4.2% |
Demographics Similar to Immigrants from Sierra Leone by Married-Couple Family Poverty
In terms of married-couple family poverty, the demographic groups most similar to Immigrants from Sierra Leone are Immigrants from Chile (5.3%, a difference of 0.060%), Immigrants from Vietnam (5.3%, a difference of 0.18%), Peruvian (5.3%, a difference of 0.20%), Spanish (5.3%, a difference of 0.25%), and Nonimmigrants (5.3%, a difference of 0.42%).
| Demographics | Rating | Rank | Married-Couple Family Poverty |
| Alsatians | 51.2 /100 | #173 | Average 5.2% |
| Immigrants | Eastern Africa | 50.0 /100 | #174 | Average 5.2% |
| Marshallese | 47.9 /100 | #175 | Average 5.2% |
| Menominee | 47.8 /100 | #176 | Average 5.2% |
| Immigrants | Kazakhstan | 45.1 /100 | #177 | Average 5.2% |
| Immigrants | Ukraine | 44.9 /100 | #178 | Average 5.2% |
| Spanish | 41.4 /100 | #179 | Average 5.3% |
| Immigrants | Sierra Leone | 39.3 /100 | #180 | Fair 5.3% |
| Immigrants | Chile | 38.8 /100 | #181 | Fair 5.3% |
| Immigrants | Vietnam | 37.7 /100 | #182 | Fair 5.3% |
| Peruvians | 37.6 /100 | #183 | Fair 5.3% |
| Immigrants | Nonimmigrants | 35.8 /100 | #184 | Fair 5.3% |
| Americans | 35.4 /100 | #185 | Fair 5.3% |
| Hungarians | 34.7 /100 | #186 | Fair 5.3% |
| Immigrants | Albania | 33.8 /100 | #187 | Fair 5.3% |