Houma vs Jordanian Married-Couple Family Poverty
COMPARE
Houma
Jordanian
Married-Couple Family Poverty
Married-Couple Family Poverty Comparison
Houma
Jordanians
6.4%
MARRIED-COUPLE FAMILY POVERTY
0.0/ 100
METRIC RATING
279th/ 347
METRIC RANK
4.8%
MARRIED-COUPLE FAMILY POVERTY
93.1/ 100
METRIC RATING
123rd/ 347
METRIC RANK
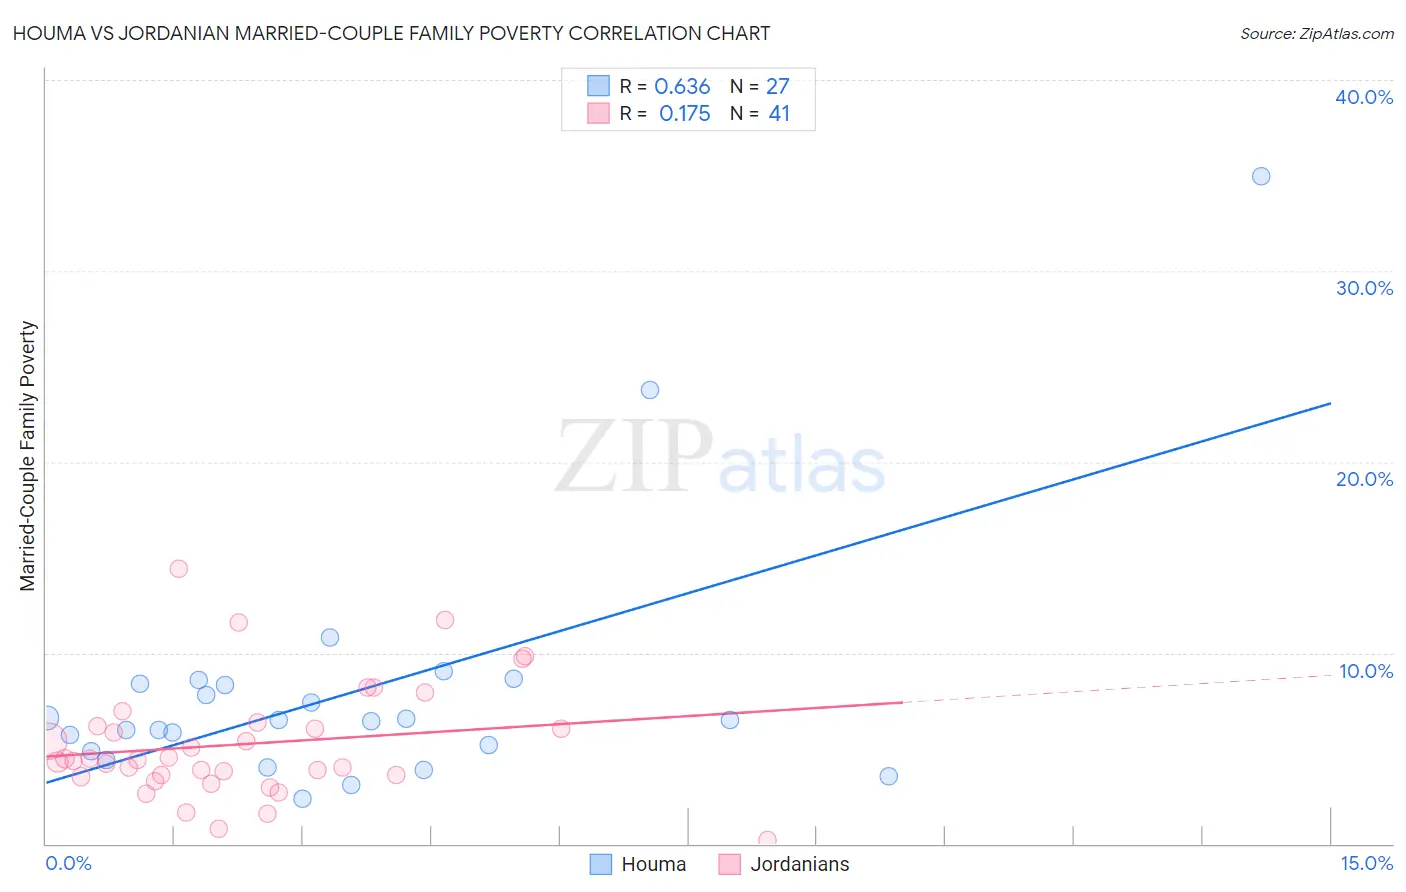
Houma vs Jordanian Married-Couple Family Poverty Correlation Chart
The statistical analysis conducted on geographies consisting of 36,736,486 people shows a significant positive correlation between the proportion of Houma and poverty level among married-couple families in the United States with a correlation coefficient (R) of 0.636 and weighted average of 6.4%. Similarly, the statistical analysis conducted on geographies consisting of 165,961,461 people shows a poor positive correlation between the proportion of Jordanians and poverty level among married-couple families in the United States with a correlation coefficient (R) of 0.175 and weighted average of 4.8%, a difference of 32.2%.
Married-Couple Family Poverty Correlation Summary
| Measurement | Houma | Jordanian |
| Minimum | 2.3% | 0.23% |
| Maximum | 34.9% | 14.4% |
| Range | 32.6% | 14.1% |
| Mean | 8.0% | 5.2% |
| Median | 6.5% | 4.4% |
| Interquartile 25% (IQ1) | 4.8% | 3.6% |
| Interquartile 75% (IQ3) | 8.4% | 6.3% |
| Interquartile Range (IQR) | 3.5% | 2.7% |
| Standard Deviation (Sample) | 6.7% | 3.0% |
| Standard Deviation (Population) | 6.5% | 3.0% |
Similar Demographics by Married-Couple Family Poverty
Demographics Similar to Houma by Married-Couple Family Poverty
In terms of married-couple family poverty, the demographic groups most similar to Houma are West Indian (6.4%, a difference of 0.050%), Immigrants from Trinidad and Tobago (6.4%, a difference of 0.25%), Mexican American Indian (6.4%, a difference of 0.56%), Seminole (6.4%, a difference of 0.56%), and Indonesian (6.3%, a difference of 0.73%).
| Demographics | Rating | Rank | Married-Couple Family Poverty |
| Trinidadians and Tobagonians | 0.1 /100 | #272 | Tragic 6.2% |
| Colville | 0.1 /100 | #273 | Tragic 6.3% |
| Barbadians | 0.1 /100 | #274 | Tragic 6.3% |
| Choctaw | 0.1 /100 | #275 | Tragic 6.3% |
| Yaqui | 0.1 /100 | #276 | Tragic 6.3% |
| Indonesians | 0.1 /100 | #277 | Tragic 6.3% |
| Immigrants | Trinidad and Tobago | 0.1 /100 | #278 | Tragic 6.4% |
| Houma | 0.0 /100 | #279 | Tragic 6.4% |
| West Indians | 0.0 /100 | #280 | Tragic 6.4% |
| Mexican American Indians | 0.0 /100 | #281 | Tragic 6.4% |
| Seminole | 0.0 /100 | #282 | Tragic 6.4% |
| Ute | 0.0 /100 | #283 | Tragic 6.4% |
| Dutch West Indians | 0.0 /100 | #284 | Tragic 6.4% |
| Blacks/African Americans | 0.0 /100 | #285 | Tragic 6.5% |
| Guyanese | 0.0 /100 | #286 | Tragic 6.5% |
Demographics Similar to Jordanians by Married-Couple Family Poverty
In terms of married-couple family poverty, the demographic groups most similar to Jordanians are White/Caucasian (4.8%, a difference of 0.020%), Indian (Asian) (4.8%, a difference of 0.060%), Immigrants from Southern Europe (4.8%, a difference of 0.16%), Romanian (4.8%, a difference of 0.27%), and Immigrants from Bosnia and Herzegovina (4.8%, a difference of 0.29%).
| Demographics | Rating | Rank | Married-Couple Family Poverty |
| Celtics | 94.8 /100 | #116 | Exceptional 4.8% |
| Kenyans | 94.7 /100 | #117 | Exceptional 4.8% |
| Immigrants | Philippines | 94.6 /100 | #118 | Exceptional 4.8% |
| Immigrants | Eastern Asia | 94.0 /100 | #119 | Exceptional 4.8% |
| Immigrants | Southern Europe | 93.4 /100 | #120 | Exceptional 4.8% |
| Indians (Asian) | 93.2 /100 | #121 | Exceptional 4.8% |
| Whites/Caucasians | 93.1 /100 | #122 | Exceptional 4.8% |
| Jordanians | 93.1 /100 | #123 | Exceptional 4.8% |
| Romanians | 92.5 /100 | #124 | Exceptional 4.8% |
| Immigrants | Bosnia and Herzegovina | 92.5 /100 | #125 | Exceptional 4.8% |
| Immigrants | Asia | 92.3 /100 | #126 | Exceptional 4.8% |
| Egyptians | 92.0 /100 | #127 | Exceptional 4.8% |
| Palestinians | 91.2 /100 | #128 | Exceptional 4.9% |
| Immigrants | Pakistan | 90.7 /100 | #129 | Exceptional 4.9% |
| Soviet Union | 90.7 /100 | #130 | Exceptional 4.9% |