Zip Codes with the Highest Percentage of Births to Unmarried Women over the Age of 35 in Lancaster, PA
RELATED REPORTS & OPTIONS
Highest Illegitimacy | Women 35+
Lancaster
Compare Zip Codes
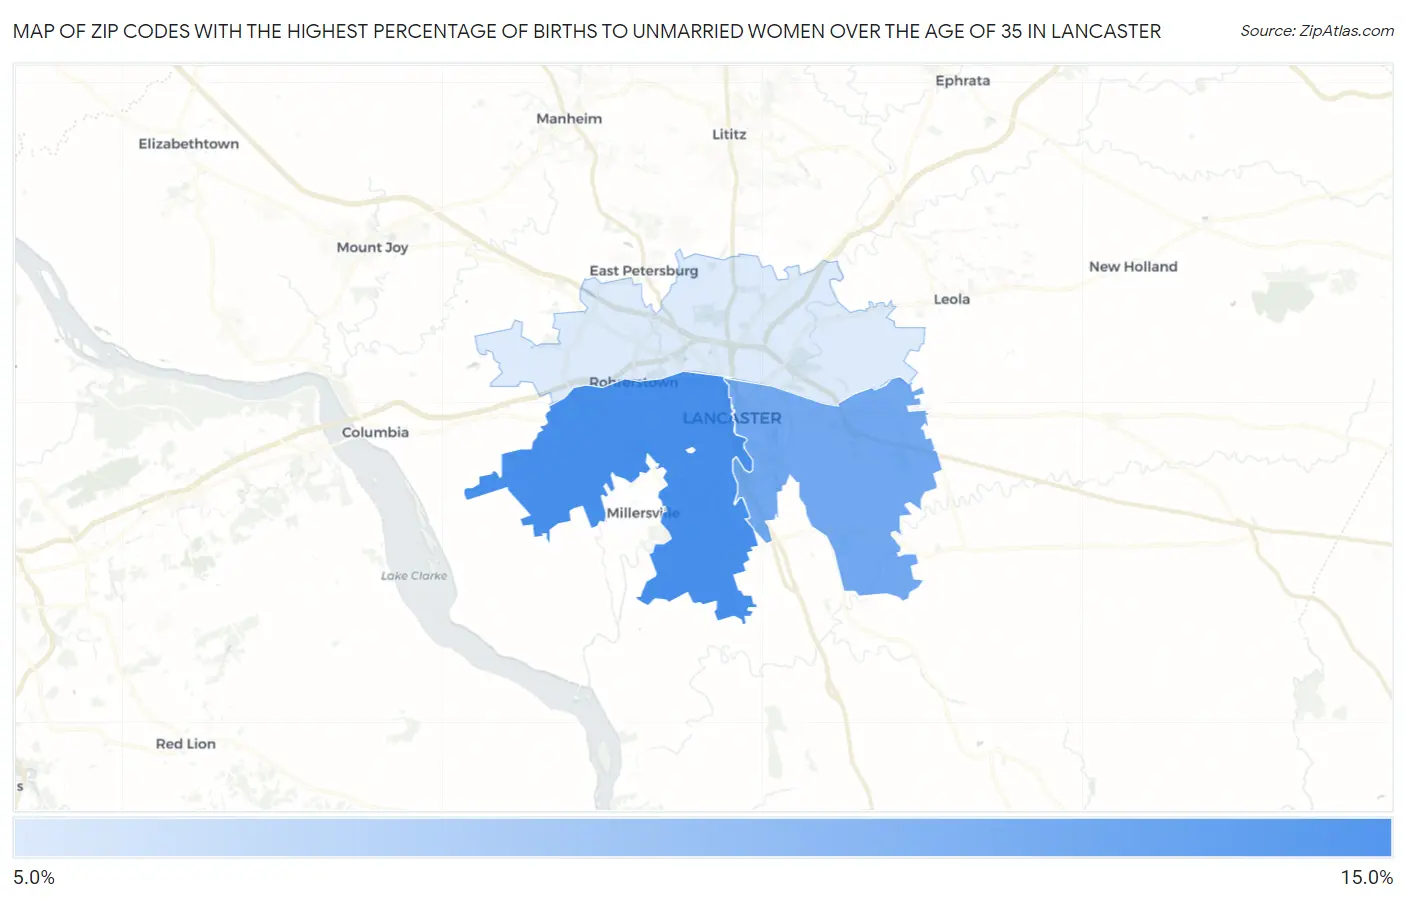
Map of Zip Codes with the Highest Percentage of Births to Unmarried Women over the Age of 35 in Lancaster
7.9%
12.8%
Zip Codes with the Highest Percentage of Births to Unmarried Women over the Age of 35 in Lancaster, PA
| Zip Code | % Unmarried | vs State | vs National | |
| 1. | 17603 | 12.8% | 19.9%(-7.10)#287 | 20.1%(-7.30)#6,109 |
| 2. | 17602 | 11.4% | 19.9%(-8.50)#293 | 20.1%(-8.70)#6,278 |
| 3. | 17601 | 7.9% | 19.9%(-12.0)#302 | 20.1%(-12.2)#6,657 |
1
Common Questions
What are the Top Zip Codes with the Highest Percentage of Births to Unmarried Women over the Age of 35 in Lancaster, PA?
Top Zip Codes with the Highest Percentage of Births to Unmarried Women over the Age of 35 in Lancaster, PA are:
What zip code has the Highest Percentage of Births to Unmarried Women over the Age of 35 in Lancaster, PA?
17603 has the Highest Percentage of Births to Unmarried Women over the Age of 35 in Lancaster, PA with 12.8%.
What is the Percentage of Births to Unmarried Women over the Age of 35 in Lancaster, PA?
Percentage of Births to Unmarried Women over the Age of 35 in Lancaster is 14.2%.
What is the Percentage of Births to Unmarried Women over the Age of 35 in Pennsylvania?
Percentage of Births to Unmarried Women over the Age of 35 in Pennsylvania is 19.9%.
What is the Percentage of Births to Unmarried Women over the Age of 35 in the United States?
Percentage of Births to Unmarried Women over the Age of 35 in the United States is 20.1%.