Zip Codes with the Highest Percentage of Families with Income Above $100,000 in Butler, PA
RELATED REPORTS & OPTIONS
Family Income | $100k+
Butler
Compare Zip Codes
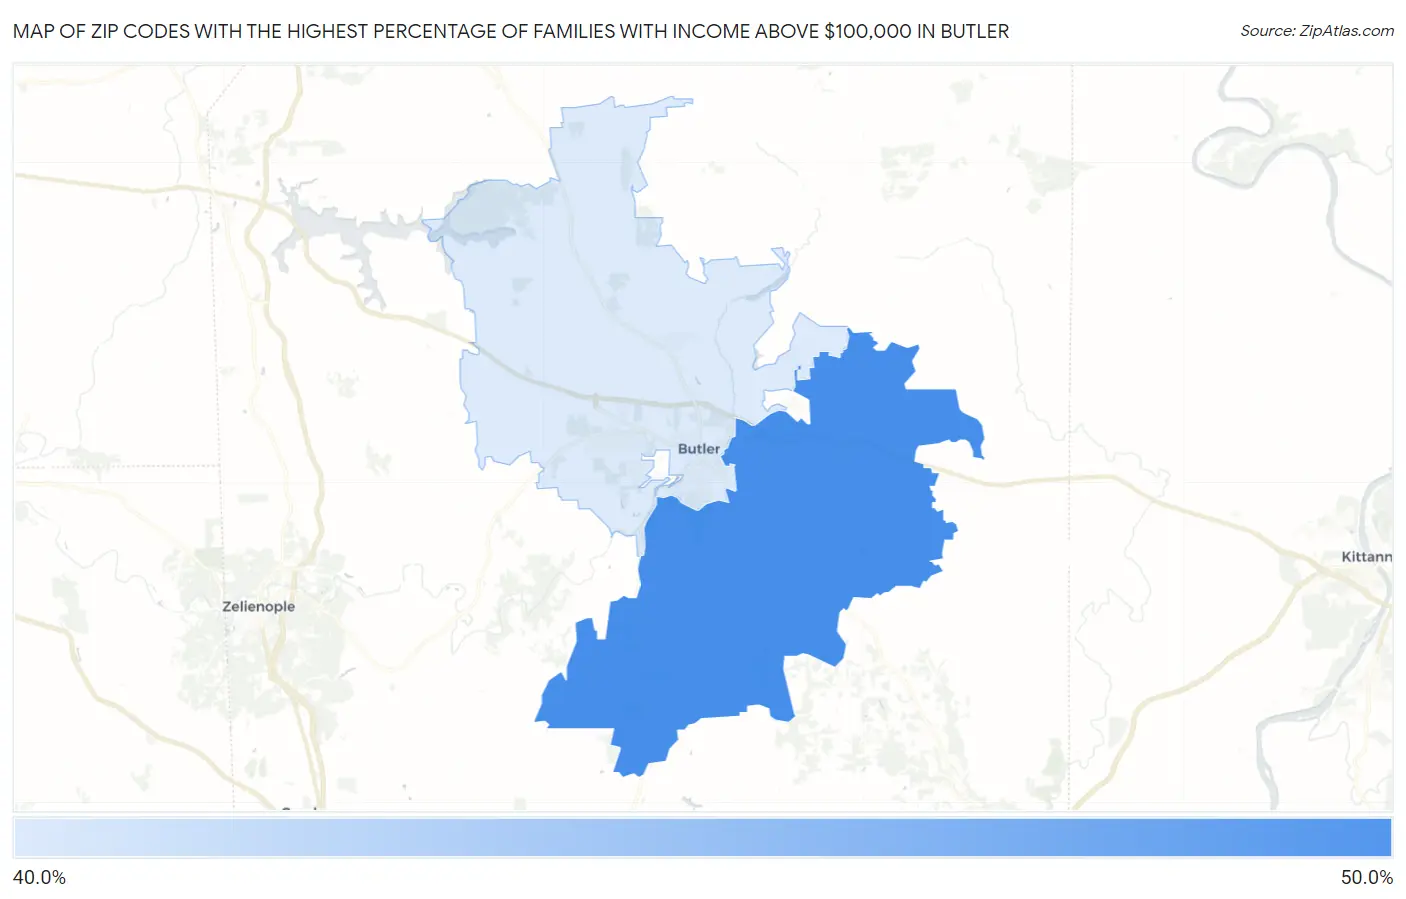
Map of Zip Codes with the Highest Percentage of Families with Income Above $100,000 in Butler
44.7%
44.9%
Zip Codes with the Highest Percentage of Families with Income Above $100,000 in Butler, PA
| Zip Code | Families with Income > $100k | vs State | vs National | |
| 1. | 16002 | 44.9% | 46.6%(-1.70)#621 | 46.1%(-1.20)#11,390 |
| 2. | 16001 | 44.7% | 46.6%(-1.90)#630 | 46.1%(-1.40)#11,502 |
1
Common Questions
What are the Top Zip Codes with the Highest Percentage of Families with Income Above $100,000 in Butler, PA?
Top Zip Codes with the Highest Percentage of Families with Income Above $100,000 in Butler, PA are:
What zip code has the Highest Percentage of Families with Income Above $100,000 in Butler, PA?
16002 has the Highest Percentage of Families with Income Above $100,000 in Butler, PA with 44.9%.
What is the Percentage of Families with Income Above $100,000 in Butler, PA?
Percentage of Families with Income Above $100,000 in Butler is 26.4%.
What is the Percentage of Families with Income Above $100,000 in Pennsylvania?
Percentage of Families with Income Above $100,000 in Pennsylvania is 46.6%.
What is the Percentage of Families with Income Above $100,000 in the United States?
Percentage of Families with Income Above $100,000 in the United States is 46.1%.