Zip Codes with the Highest Percentage of Families with Income Below $10,000 in Butler, PA
RELATED REPORTS & OPTIONS
Family Income | $0-10k
Butler
Compare Zip Codes
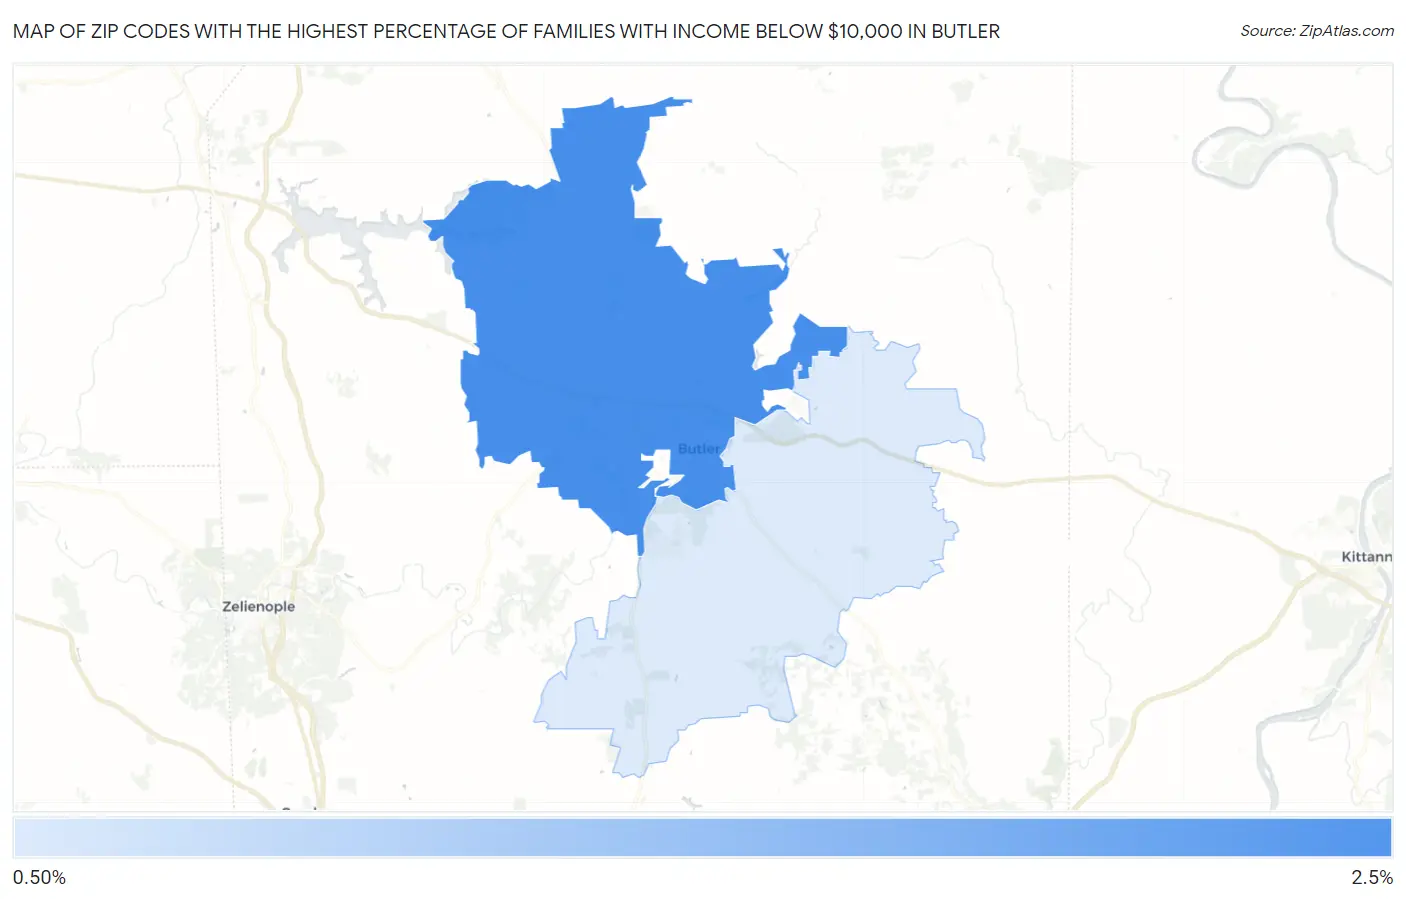
Map of Zip Codes with the Highest Percentage of Families with Income Below $10,000 in Butler
1.1%
2.2%
Zip Codes with the Highest Percentage of Families with Income Below $10,000 in Butler, PA
| Zip Code | Families with Income < $10k | vs State | vs National | |
| 1. | 16001 | 2.2% | 2.9%(-0.700)#652 | 3.1%(-0.900)#14,348 |
| 2. | 16002 | 1.1% | 2.9%(-1.80)#990 | 3.1%(-2.00)#19,841 |
1
Common Questions
What are the Top Zip Codes with the Highest Percentage of Families with Income Below $10,000 in Butler, PA?
Top Zip Codes with the Highest Percentage of Families with Income Below $10,000 in Butler, PA are:
What zip code has the Highest Percentage of Families with Income Below $10,000 in Butler, PA?
16001 has the Highest Percentage of Families with Income Below $10,000 in Butler, PA with 2.2%.
What is the Percentage of Families with Income Below $10,000 in Butler, PA?
Percentage of Families with Income Below $10,000 in Butler is 3.9%.
What is the Percentage of Families with Income Below $10,000 in Pennsylvania?
Percentage of Families with Income Below $10,000 in Pennsylvania is 2.9%.
What is the Percentage of Families with Income Below $10,000 in the United States?
Percentage of Families with Income Below $10,000 in the United States is 3.1%.