Zip Codes with the Highest Percentage of Population with a Degree in Business in Butler, PA
RELATED REPORTS & OPTIONS
Business
Butler
Compare Zip Codes
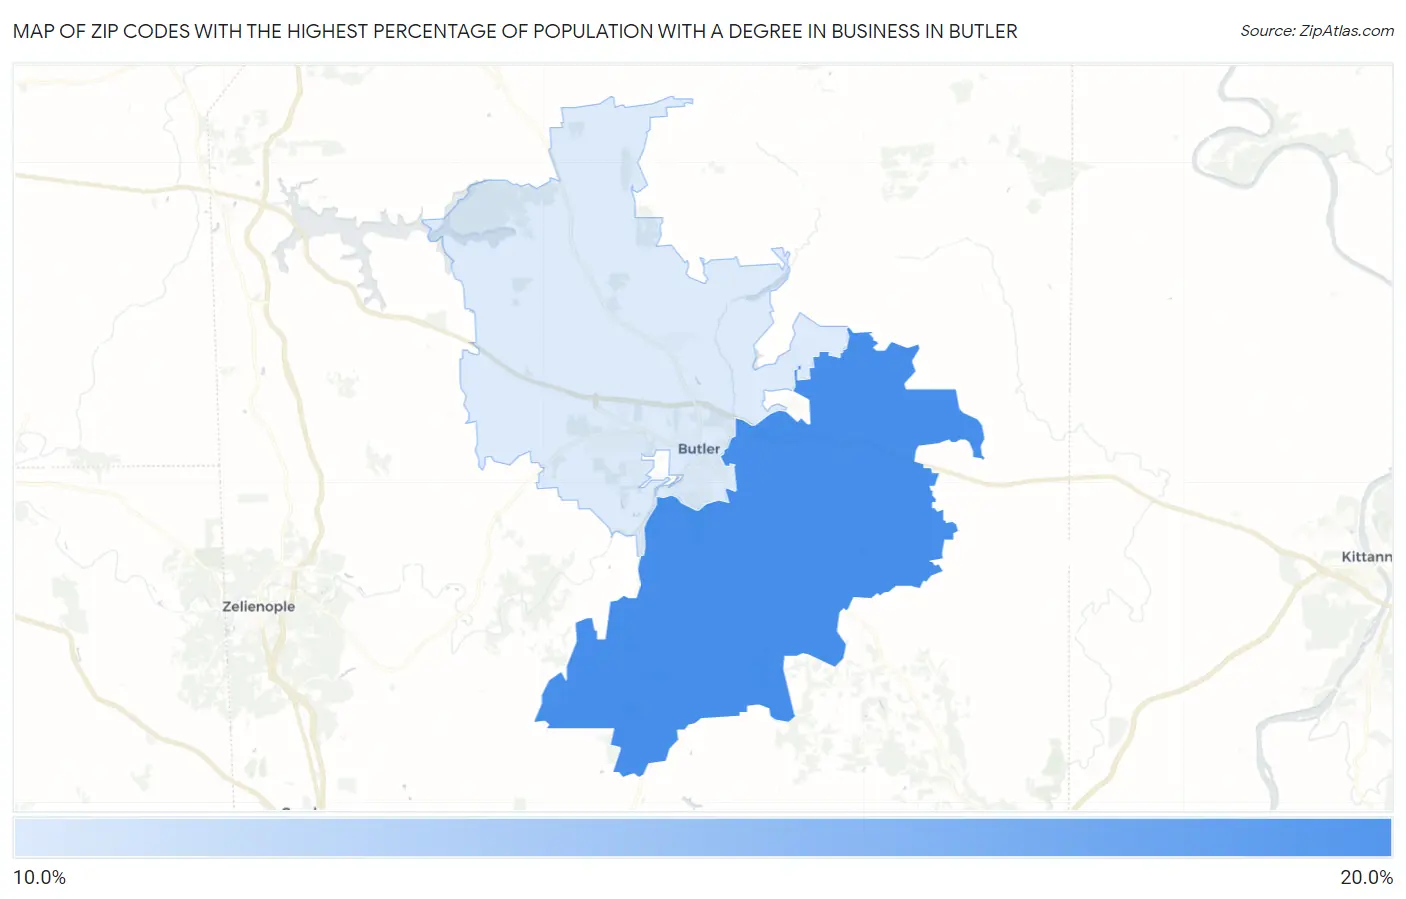
Map of Zip Codes with the Highest Percentage of Population with a Degree in Business in Butler
19.7%
19.8%
Zip Codes with the Highest Percentage of Population with a Degree in Business in Butler, PA
| Zip Code | % Graduates | vs State | vs National | |
| 1. | 16002 | 19.8% | 18.9%(+0.963)#565 | 19.5%(+0.344)#11,844 |
| 2. | 16001 | 19.7% | 18.9%(+0.858)#576 | 19.5%(+0.239)#12,014 |
1
Common Questions
What are the Top Zip Codes with the Highest Percentage of Population with a Degree in Business in Butler, PA?
Top Zip Codes with the Highest Percentage of Population with a Degree in Business in Butler, PA are:
What zip code has the Highest Percentage of Population with a Degree in Business in Butler, PA?
16002 has the Highest Percentage of Population with a Degree in Business in Butler, PA with 19.8%.
What is the Percentage of Population with a Degree in Business in Butler, PA?
Percentage of Population with a Degree in Business in Butler is 17.9%.
What is the Percentage of Population with a Degree in Business in Pennsylvania?
Percentage of Population with a Degree in Business in Pennsylvania is 18.9%.
What is the Percentage of Population with a Degree in Business in the United States?
Percentage of Population with a Degree in Business in the United States is 19.5%.