Zip Codes with the Highest Percentage of Population Employed in Professional & Scientific Services in Akron, OH
RELATED REPORTS & OPTIONS
Professional & Scientific Services
Akron
Compare Zip Codes
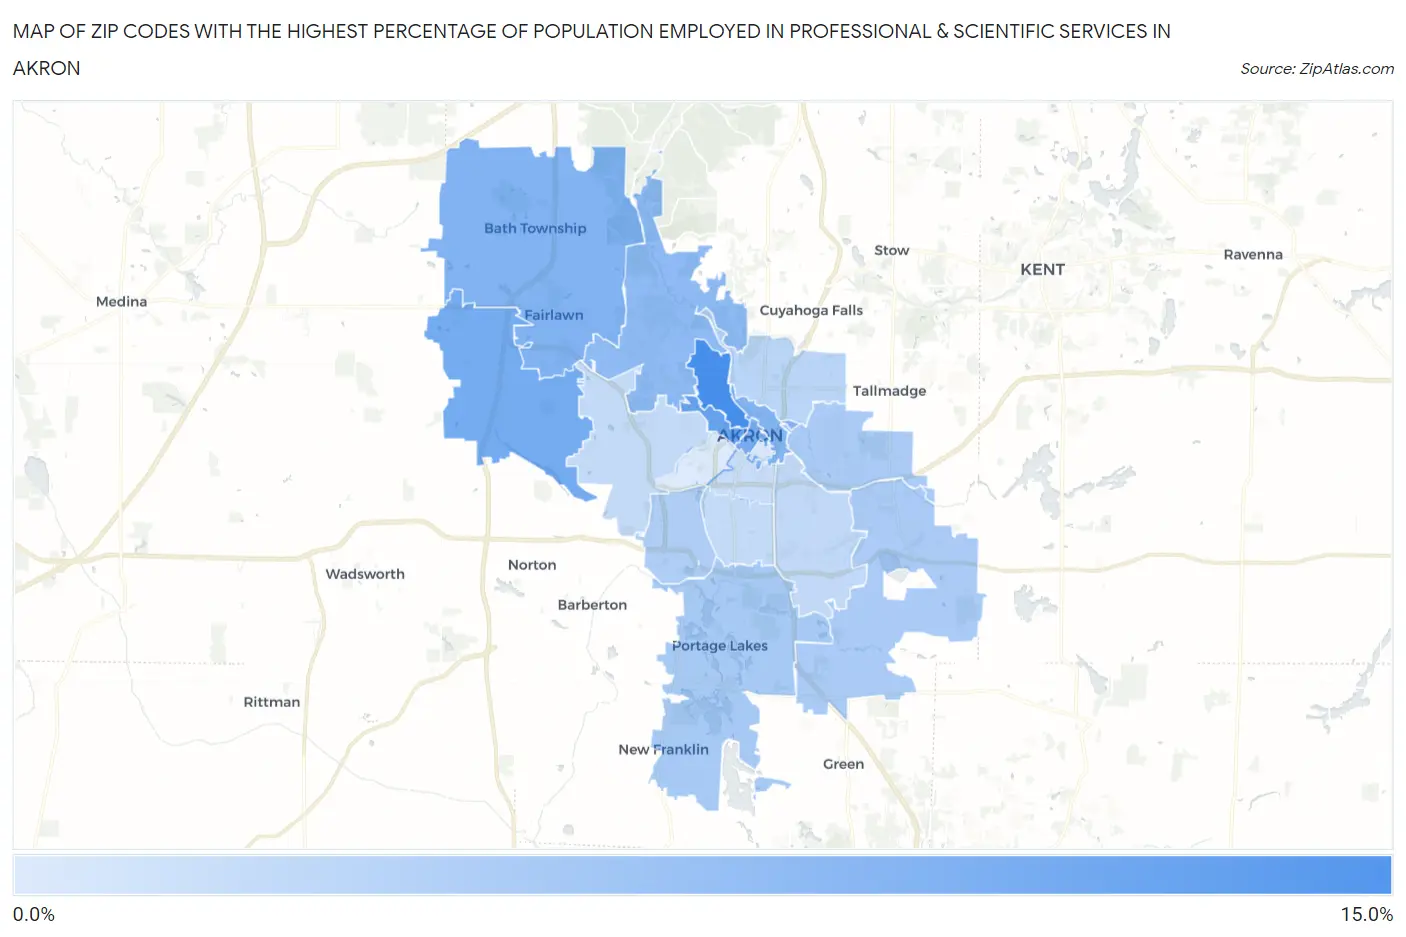
Map of Zip Codes with the Highest Percentage of Population Employed in Professional & Scientific Services in Akron
0.75%
13.3%
Zip Codes with the Highest Percentage of Population Employed in Professional & Scientific Services in Akron, OH
| Zip Code | % Employed | vs State | vs National | |
| 1. | 44303 | 13.3% | 6.1%(+7.23)#35 | 7.8%(+5.44)#2,589 |
| 2. | 44302 | 10.5% | 6.1%(+4.44)#93 | 7.8%(+2.65)#4,197 |
| 3. | 44321 | 9.3% | 6.1%(+3.25)#129 | 7.8%(+1.46)#5,178 |
| 4. | 44308 | 9.0% | 6.1%(+2.94)#139 | 7.8%(+1.15)#5,525 |
| 5. | 44333 | 8.4% | 6.1%(+2.33)#159 | 7.8%(+0.541)#6,152 |
| 6. | 44304 | 8.1% | 6.1%(+2.07)#169 | 7.8%(+0.282)#6,499 |
| 7. | 44313 | 7.2% | 6.1%(+1.15)#207 | 7.8%(-0.642)#7,796 |
| 8. | 44319 | 5.0% | 6.1%(-1.03)#378 | 7.8%(-2.83)#12,277 |
| 9. | 44312 | 4.9% | 6.1%(-1.15)#391 | 7.8%(-2.94)#12,553 |
| 10. | 44305 | 4.8% | 6.1%(-1.23)#402 | 7.8%(-3.02)#12,755 |
| 11. | 44314 | 4.5% | 6.1%(-1.53)#437 | 7.8%(-3.32)#13,579 |
| 12. | 44310 | 3.5% | 6.1%(-2.51)#556 | 7.8%(-4.30)#16,582 |
| 13. | 44306 | 3.0% | 6.1%(-3.02)#624 | 7.8%(-4.81)#18,323 |
| 14. | 44301 | 2.8% | 6.1%(-3.24)#662 | 7.8%(-5.03)#19,086 |
| 15. | 44320 | 2.7% | 6.1%(-3.34)#686 | 7.8%(-5.13)#19,450 |
| 16. | 44311 | 2.4% | 6.1%(-3.61)#734 | 7.8%(-5.40)#20,379 |
| 17. | 44325 | 1.3% | 6.1%(-4.72)#913 | 7.8%(-6.51)#24,077 |
| 18. | 44307 | 0.75% | 6.1%(-5.31)#963 | 7.8%(-7.10)#25,655 |
1
Common Questions
What are the Top 10 Zip Codes with the Highest Percentage of Population Employed in Professional & Scientific Services in Akron, OH?
Top 10 Zip Codes with the Highest Percentage of Population Employed in Professional & Scientific Services in Akron, OH are:
What zip code has the Highest Percentage of Population Employed in Professional & Scientific Services in Akron, OH?
44303 has the Highest Percentage of Population Employed in Professional & Scientific Services in Akron, OH with 13.3%.
What is the Percentage of Population Employed in Professional & Scientific Services in Akron, OH?
Percentage of Population Employed in Professional & Scientific Services in Akron is 5.0%.
What is the Percentage of Population Employed in Professional & Scientific Services in Ohio?
Percentage of Population Employed in Professional & Scientific Services in Ohio is 6.1%.
What is the Percentage of Population Employed in Professional & Scientific Services in the United States?
Percentage of Population Employed in Professional & Scientific Services in the United States is 7.8%.