Zip Codes with the Highest Percentage of Population Employed in Farming, Fishing & Forestry in Akron, OH

RELATED REPORTS & OPTIONS

Farming, Fishing & Forestry
Population
Families and Households
Female Fertility
Female Fertility (Unmarried)
Race (Community Size)
Race (Percentage)
Ancestry (Community Size)
AfghanAfricanAmericanApacheArabArmenianAustrianBangladeshiBelgianBelizeanBhutaneseBlackfeetBrazilianBritishBurmeseCajunCanadianCelticCentral AmericanCentral American IndianCherokeeChippewaChoctawColombianCreekCroatianCubanCzechCzechoslovakianDanishDelawareDominicanDutchEastern EuropeanEcuadorianEgyptianEnglishEuropeanFinnishFrenchFrench CanadianGermanGhanaianGreekGuamanian / ChamorroGuatemalanHaitianHonduranHungarianIndian (Asian)IndonesianIranianIrishIroquoisItalianJamaicanJapaneseJordanianKenyanKoreanLebaneseLiberianLithuanianMacedonianMalaysianMexicanMexican American IndianMoroccanNative HawaiianNavajoNicaraguanNigerianNorthern EuropeanNorwegianPakistaniPalestinianPanamanianPennsylvania GermanPeruvianPolishPortuguesePuerto RicanRomanianRussianSamoanScandinavianScotch-IrishScottishSerbianSiouxSlavicSlovakSloveneSouth AmericanSpaniardSpanishSri LankanSubsaharan AfricanSwedishSwissSyrianThaiTurkishUkrainianWelshWest IndianYugoslavian
Ancestry (Percentage)
AfghanAfricanAmericanApacheArabArmenianAustrianBangladeshiBelgianBelizeanBhutaneseBlackfeetBrazilianBritishBurmeseCajunCanadianCelticCentral AmericanCentral American IndianCherokeeChippewaChoctawColombianCreekCroatianCubanCzechCzechoslovakianDanishDelawareDominicanDutchEastern EuropeanEcuadorianEgyptianEnglishEuropeanFinnishFrenchFrench CanadianGermanGhanaianGreekGuamanian / ChamorroGuatemalanHaitianHonduranHungarianIndian (Asian)IndonesianIranianIrishIroquoisItalianJamaicanJapaneseJordanianKenyanKoreanLebaneseLiberianLithuanianMacedonianMalaysianMexicanMexican American IndianMoroccanNative HawaiianNavajoNicaraguanNigerianNorthern EuropeanNorwegianPakistaniPalestinianPanamanianPennsylvania GermanPeruvianPolishPortuguesePuerto RicanRomanianRussianSamoanScandinavianScotch-IrishScottishSerbianSiouxSlavicSlovakSloveneSouth AmericanSpaniardSpanishSri LankanSubsaharan AfricanSwedishSwissSyrianThaiTurkishUkrainianWelshWest IndianYugoslavian
Immigrant Origin (Total)
Immigrant Origin (Percentage)
Income
Income (Families)
Income (Households)
Poverty
Poverty (Families)
Unemployment
Employment Occupations
Employment Industries
Employer Class
Commute Time
Commute Means
School Enrollment
Education by Degree Field
Occupancy
Finances
Physical Characteristics
Akron
Compare Zip Codes
Comparison Subject

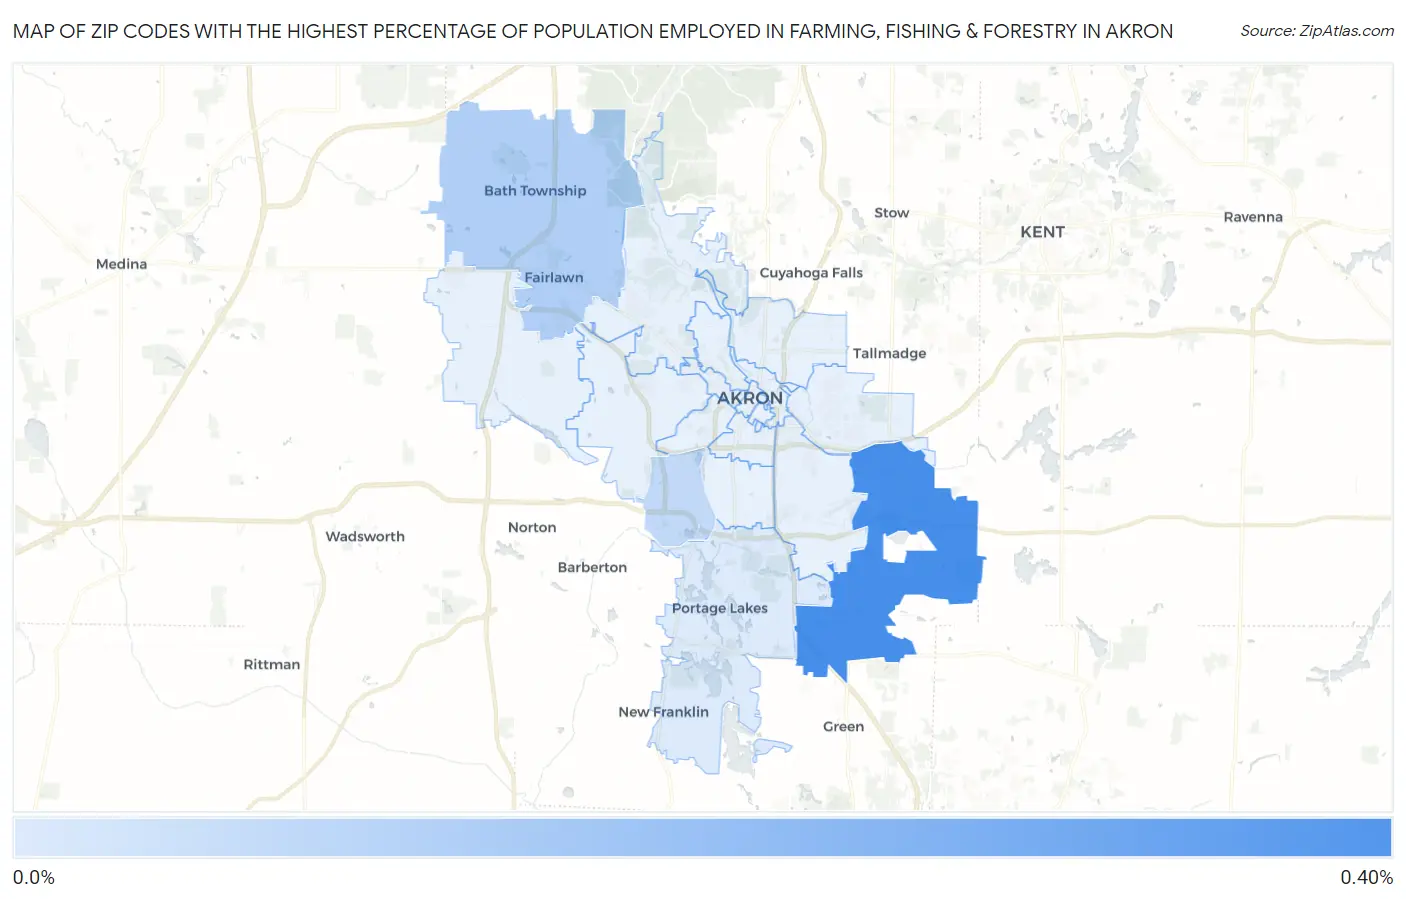
Map of Zip Codes with the Highest Percentage of Population Employed in Farming, Fishing & Forestry in Akron

0.0%
0.40%
Zip Codes with the Highest Percentage of Population Employed in Farming, Fishing & Forestry in Akron Map

Zip Codes with the Highest Percentage of Population Employed in Farming, Fishing & Forestry in Akron, OH

Zip Code % Employed vs State vs National
1.443120.39%0.29%(+0.100)#3300.61%(-0.217)#13,869
2.443330.14%0.29%(-0.151)#4680.61%(-0.468)#17,147
3.443140.10%0.29%(-0.187)#4930.61%(-0.504)#17,730
4.443190.034%0.29%(-0.255)#5610.61%(-0.572)#18,905

Common Questions

What are the Top 10 Zip Codes with the Highest Percentage of Population Employed in Farming, Fishing & Forestry in Akron, OH?
Top 10 Zip Codes with the Highest Percentage of Population Employed in Farming, Fishing & Forestry in Akron, OH are:
#1
0.39%
#2
0.14%
#3
0.10%
#4
0.034%
#5
0.0%
#6
0.0%
#7
0.0%
#8
0.0%
#9
0.0%
#10
0.0%
What zip code has the Highest Percentage of Population Employed in Farming, Fishing & Forestry in Akron, OH?
44312 has the Highest Percentage of Population Employed in Farming, Fishing & Forestry in Akron, OH with 0.39%.
What is the Percentage of Population Employed in Farming, Fishing & Forestry in Akron, OH?
Percentage of Population Employed in Farming, Fishing & Forestry in Akron is 0.032%.
What is the Percentage of Population Employed in Farming, Fishing & Forestry in Ohio?
Percentage of Population Employed in Farming, Fishing & Forestry in Ohio is 0.29%.
What is the Percentage of Population Employed in Farming, Fishing & Forestry in the United States?
Percentage of Population Employed in Farming, Fishing & Forestry in the United States is 0.61%.