Zip Codes with the Highest Percentage of Households with Income Below $10,000 in East Orange, NJ
RELATED REPORTS & OPTIONS
Household Income | $0-10k
East Orange
Compare Zip Codes
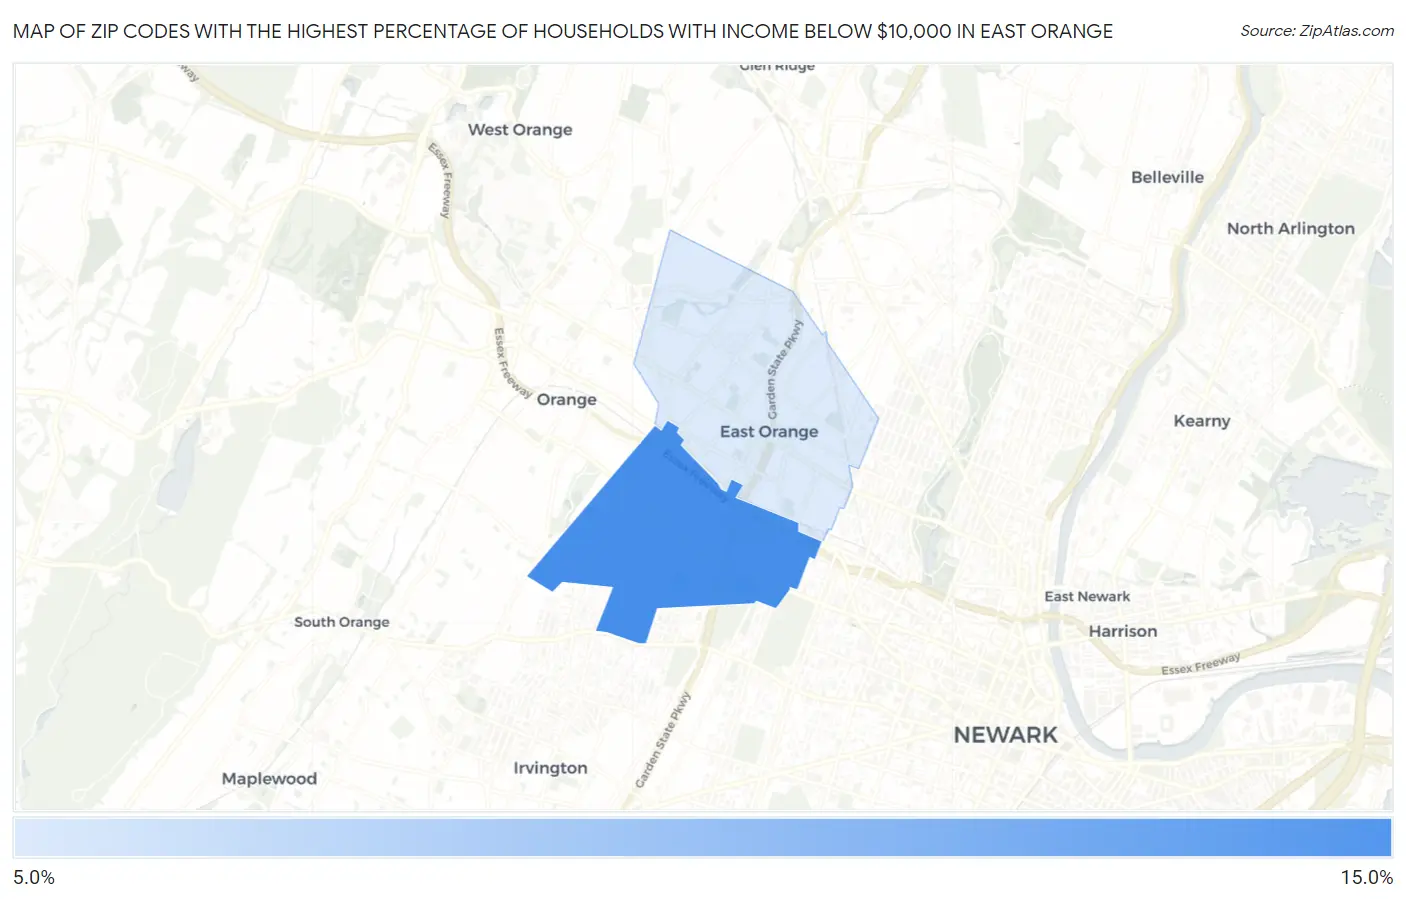
Map of Zip Codes with the Highest Percentage of Households with Income Below $10,000 in East Orange
6.8%
11.9%
Zip Codes with the Highest Percentage of Households with Income Below $10,000 in East Orange, NJ
| Zip Code | Households with Income < $10k | vs State | vs National | |
| 1. | 07018 | 11.9% | 4.1%(+7.80)#18 | 4.9%(+7.00)#2,502 |
| 2. | 07017 | 6.8% | 4.1%(+2.70)#54 | 4.9%(+1.90)#7,306 |
1
Common Questions
What are the Top Zip Codes with the Highest Percentage of Households with Income Below $10,000 in East Orange, NJ?
Top Zip Codes with the Highest Percentage of Households with Income Below $10,000 in East Orange, NJ are:
What zip code has the Highest Percentage of Households with Income Below $10,000 in East Orange, NJ?
07018 has the Highest Percentage of Households with Income Below $10,000 in East Orange, NJ with 11.9%.
What is the Percentage of Households with Income Below $10,000 in East Orange, NJ?
Percentage of Households with Income Below $10,000 in East Orange is 9.1%.
What is the Percentage of Households with Income Below $10,000 in New Jersey?
Percentage of Households with Income Below $10,000 in New Jersey is 4.1%.
What is the Percentage of Households with Income Below $10,000 in the United States?
Percentage of Households with Income Below $10,000 in the United States is 4.9%.