Zip Codes with the Highest Percentage of Population Employed in Food Preparation & Serving in East Orange, NJ
RELATED REPORTS & OPTIONS
Food Preparation & Serving
East Orange
Compare Zip Codes
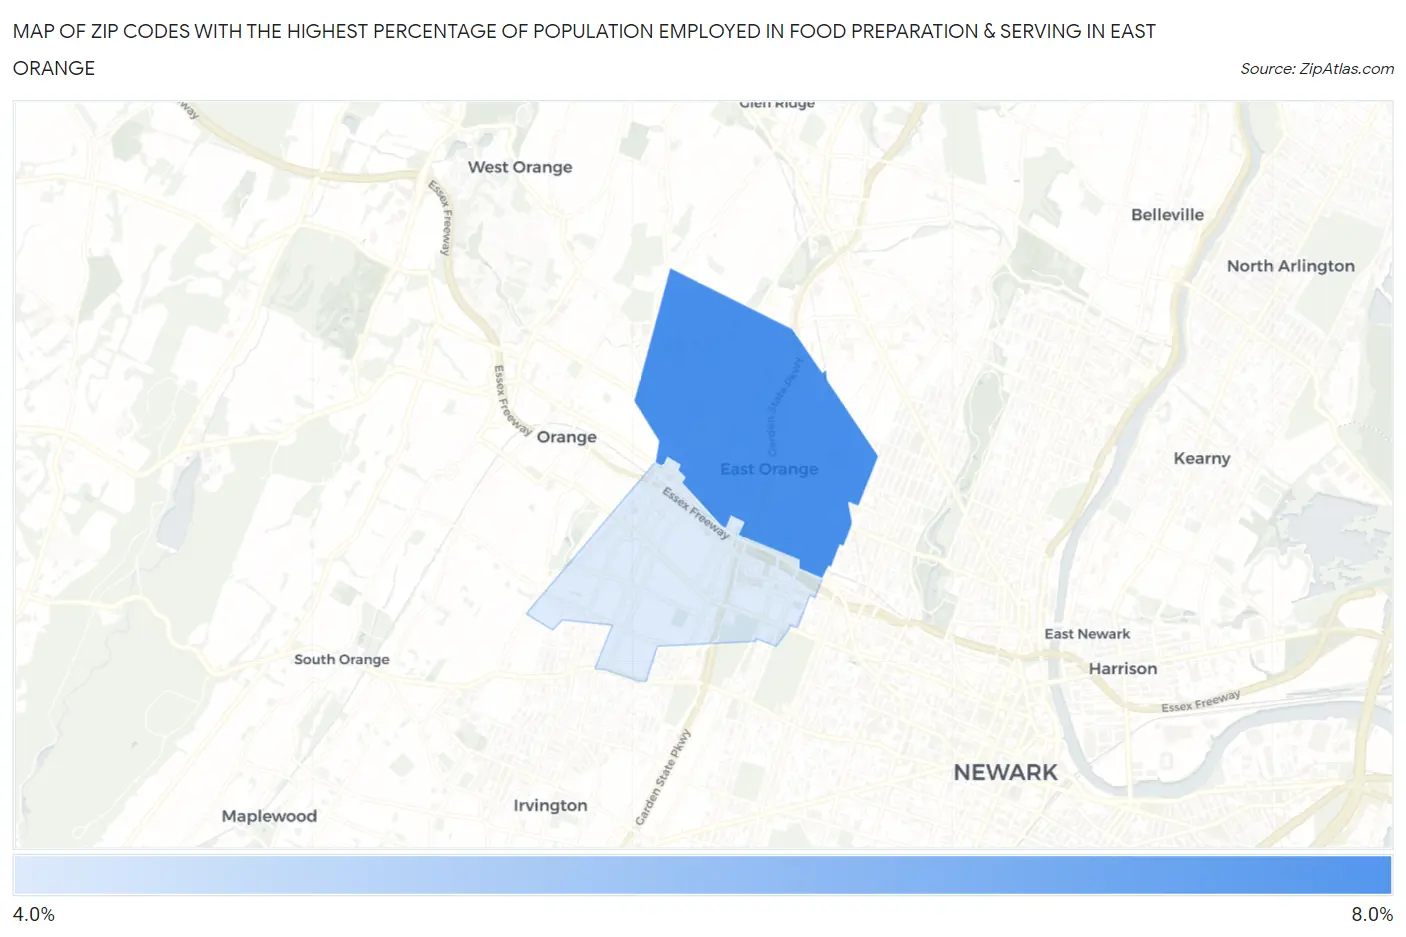
Map of Zip Codes with the Highest Percentage of Population Employed in Food Preparation & Serving in East Orange
4.9%
7.3%
Zip Codes with the Highest Percentage of Population Employed in Food Preparation & Serving in East Orange, NJ
| Zip Code | % Employed | vs State | vs National | |
| 1. | 07017 | 7.3% | 4.0%(+3.30)#51 | 5.3%(+1.97)#6,000 |
| 2. | 07018 | 4.9% | 4.0%(+0.889)#143 | 5.3%(-0.434)#13,553 |
1
Common Questions
What are the Top Zip Codes with the Highest Percentage of Population Employed in Food Preparation & Serving in East Orange, NJ?
Top Zip Codes with the Highest Percentage of Population Employed in Food Preparation & Serving in East Orange, NJ are:
What zip code has the Highest Percentage of Population Employed in Food Preparation & Serving in East Orange, NJ?
07017 has the Highest Percentage of Population Employed in Food Preparation & Serving in East Orange, NJ with 7.3%.
What is the Percentage of Population Employed in Food Preparation & Serving in East Orange, NJ?
Percentage of Population Employed in Food Preparation & Serving in East Orange is 6.2%.
What is the Percentage of Population Employed in Food Preparation & Serving in New Jersey?
Percentage of Population Employed in Food Preparation & Serving in New Jersey is 4.0%.
What is the Percentage of Population Employed in Food Preparation & Serving in the United States?
Percentage of Population Employed in Food Preparation & Serving in the United States is 5.3%.