Zip Codes with the Highest Percentage of Population Employed in Office & Administration in Blue Springs, MO
RELATED REPORTS & OPTIONS
Office & Administration
Blue Springs
Compare Zip Codes
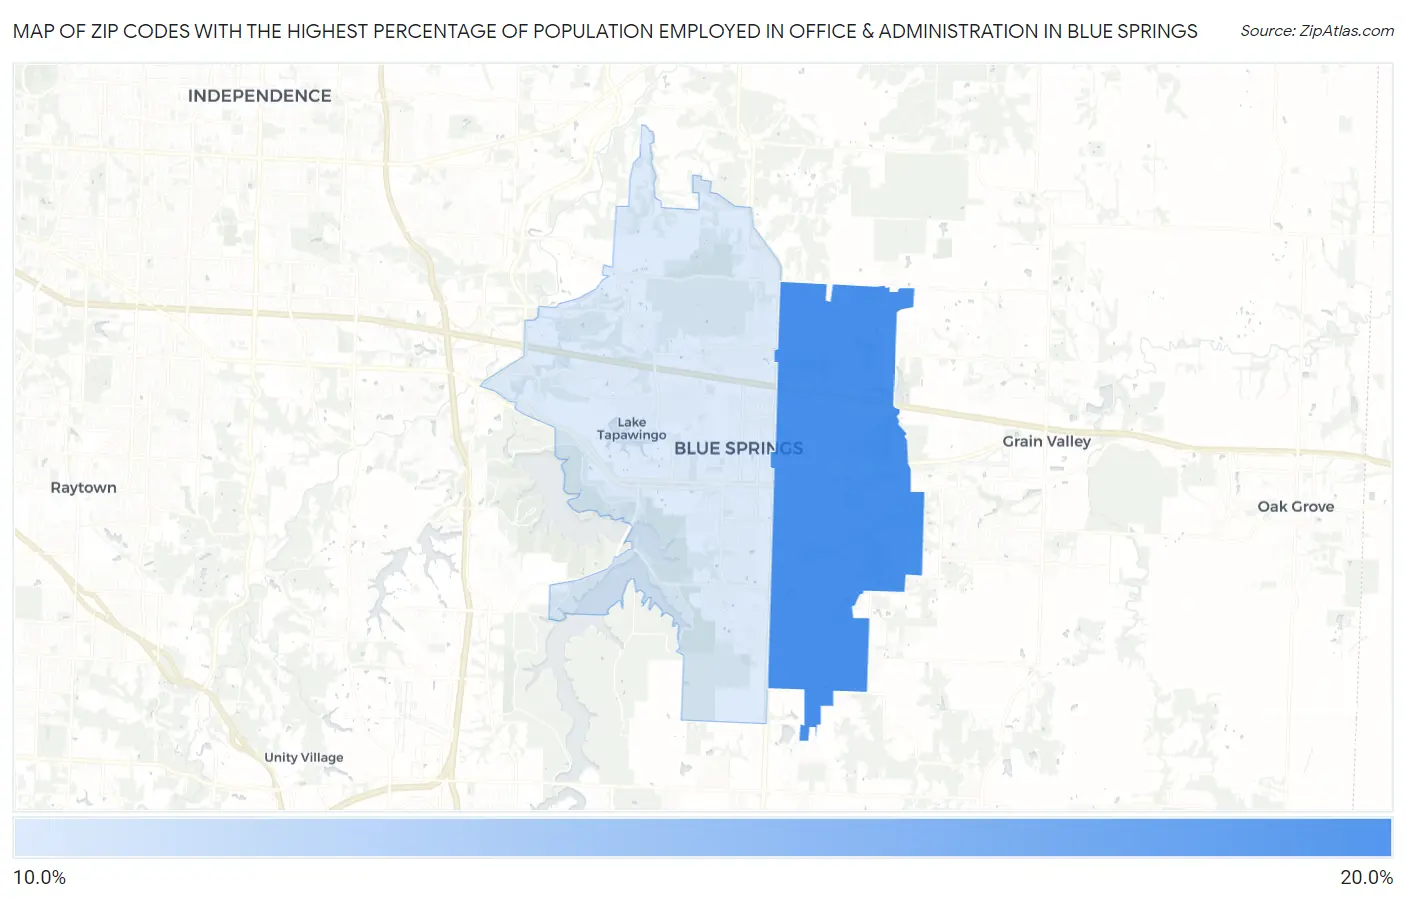
Map of Zip Codes with the Highest Percentage of Population Employed in Office & Administration in Blue Springs
11.3%
17.2%
Zip Codes with the Highest Percentage of Population Employed in Office & Administration in Blue Springs, MO
| Zip Code | % Employed | vs State | vs National | |
| 1. | 64014 | 17.2% | 11.3%(+5.84)#111 | 10.9%(+6.34)#2,750 |
| 2. | 64015 | 11.3% | 11.3%(-0.004)#425 | 10.9%(+0.488)#12,741 |
1
Common Questions
What are the Top Zip Codes with the Highest Percentage of Population Employed in Office & Administration in Blue Springs, MO?
Top Zip Codes with the Highest Percentage of Population Employed in Office & Administration in Blue Springs, MO are:
What zip code has the Highest Percentage of Population Employed in Office & Administration in Blue Springs, MO?
64014 has the Highest Percentage of Population Employed in Office & Administration in Blue Springs, MO with 17.2%.
What is the Percentage of Population Employed in Office & Administration in Blue Springs, MO?
Percentage of Population Employed in Office & Administration in Blue Springs is 14.2%.
What is the Percentage of Population Employed in Office & Administration in Missouri?
Percentage of Population Employed in Office & Administration in Missouri is 11.3%.
What is the Percentage of Population Employed in Office & Administration in the United States?
Percentage of Population Employed in Office & Administration in the United States is 10.9%.