Zip Codes with the Highest Percentage of Population Employed in Office & Administration in Independence, MO
RELATED REPORTS & OPTIONS
Office & Administration
Independence
Compare Zip Codes
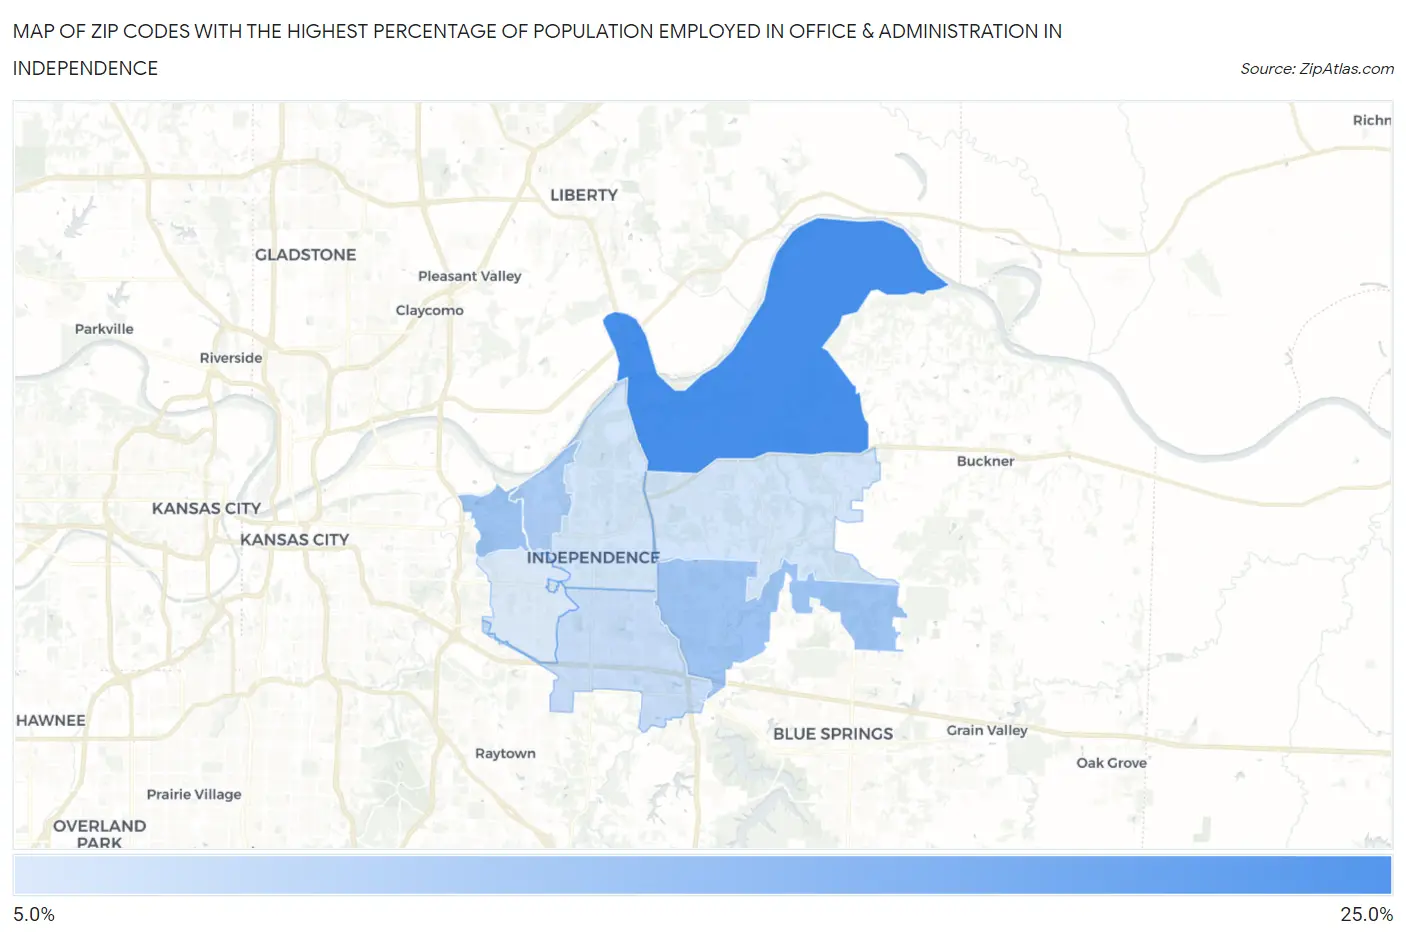
Map of Zip Codes with the Highest Percentage of Population Employed in Office & Administration in Independence
11.7%
23.3%
Zip Codes with the Highest Percentage of Population Employed in Office & Administration in Independence, MO
| Zip Code | % Employed | vs State | vs National | |
| 1. | 64058 | 23.3% | 11.3%(+12.0)#45 | 10.9%(+12.5)#1,115 |
| 2. | 64053 | 16.4% | 11.3%(+5.03)#127 | 10.9%(+5.52)#3,271 |
| 3. | 64057 | 16.3% | 11.3%(+4.96)#132 | 10.9%(+5.45)#3,322 |
| 4. | 64054 | 15.3% | 11.3%(+3.94)#168 | 10.9%(+4.43)#4,214 |
| 5. | 64055 | 13.3% | 11.3%(+1.94)#279 | 10.9%(+2.43)#7,396 |
| 6. | 64056 | 12.4% | 11.3%(+1.09)#340 | 10.9%(+1.59)#9,447 |
| 7. | 64050 | 12.4% | 11.3%(+1.00)#350 | 10.9%(+1.50)#9,708 |
| 8. | 64052 | 11.7% | 11.3%(+0.333)#398 | 10.9%(+0.825)#11,681 |
1
Common Questions
What are the Top 5 Zip Codes with the Highest Percentage of Population Employed in Office & Administration in Independence, MO?
Top 5 Zip Codes with the Highest Percentage of Population Employed in Office & Administration in Independence, MO are:
What zip code has the Highest Percentage of Population Employed in Office & Administration in Independence, MO?
64058 has the Highest Percentage of Population Employed in Office & Administration in Independence, MO with 23.3%.
What is the Percentage of Population Employed in Office & Administration in Independence, MO?
Percentage of Population Employed in Office & Administration in Independence is 13.4%.
What is the Percentage of Population Employed in Office & Administration in Missouri?
Percentage of Population Employed in Office & Administration in Missouri is 11.3%.
What is the Percentage of Population Employed in Office & Administration in the United States?
Percentage of Population Employed in Office & Administration in the United States is 10.9%.