Zip Codes with the Highest Percentage of Population Employed in Business & Financial in Utica, MI
RELATED REPORTS & OPTIONS
Business & Financial
Utica
Compare Zip Codes
Map of Zip Codes with the Highest Percentage of Population Employed in Business & Financial in Utica
6.5%
7.4%
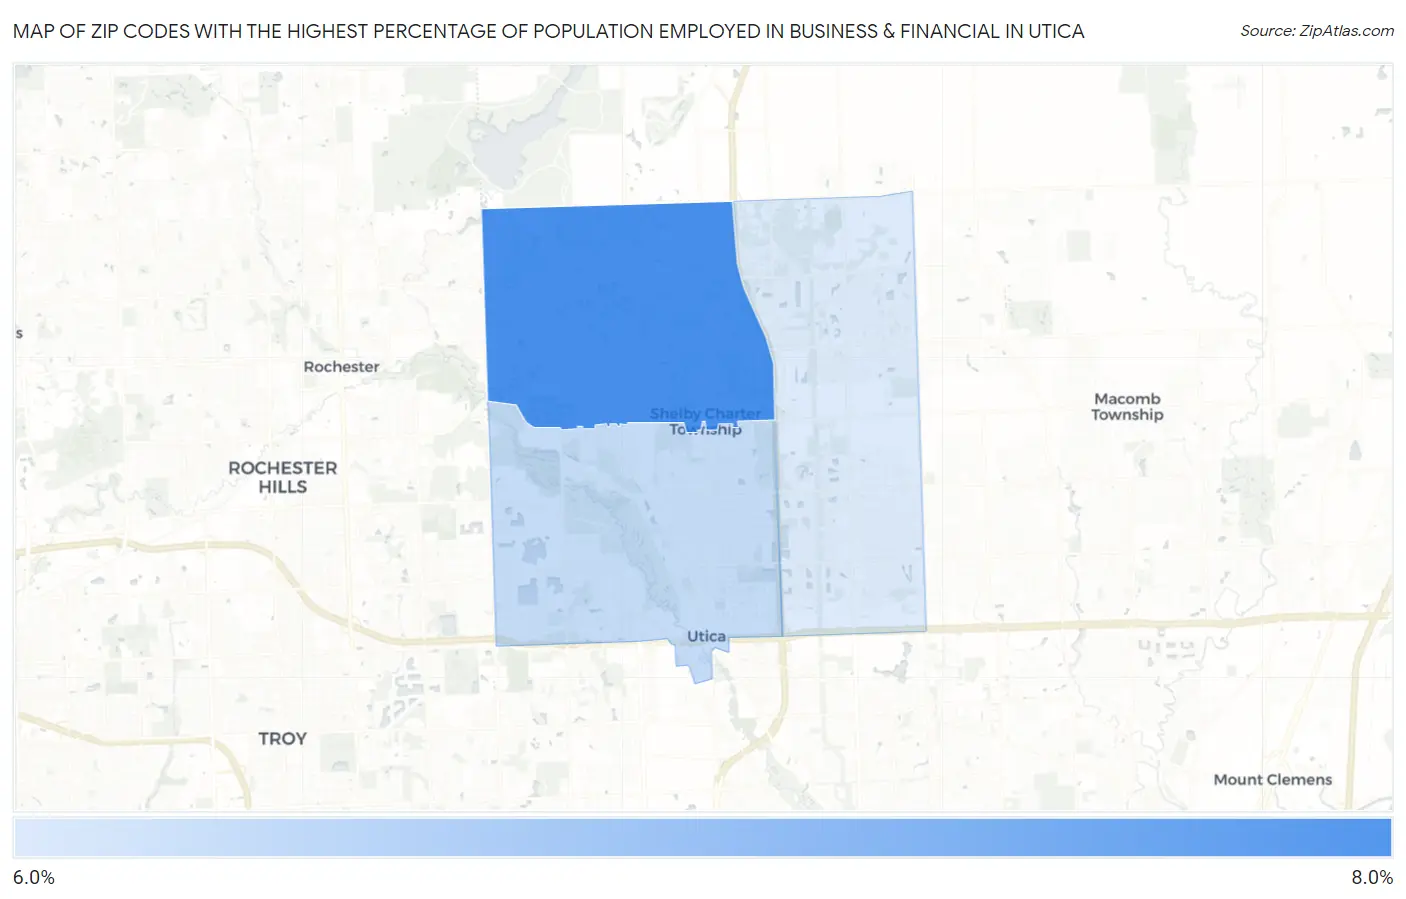
Zip Codes with the Highest Percentage of Population Employed in Business & Financial in Utica, MI
| Zip Code | % Employed | vs State | vs National | |
| 1. | 48316 | 7.4% | 5.3%(+2.09)#121 | 5.8%(+1.59)#5,221 |
| 2. | 48317 | 6.7% | 5.3%(+1.40)#168 | 5.8%(+0.902)#6,439 |
| 3. | 48315 | 6.5% | 5.3%(+1.28)#174 | 5.8%(+0.776)#6,691 |
1
Common Questions
What are the Top Zip Codes with the Highest Percentage of Population Employed in Business & Financial in Utica, MI?
Top Zip Codes with the Highest Percentage of Population Employed in Business & Financial in Utica, MI are:
What zip code has the Highest Percentage of Population Employed in Business & Financial in Utica, MI?
48316 has the Highest Percentage of Population Employed in Business & Financial in Utica, MI with 7.4%.
What is the Percentage of Population Employed in Business & Financial in Utica, MI?
Percentage of Population Employed in Business & Financial in Utica is 4.1%.
What is the Percentage of Population Employed in Business & Financial in Michigan?
Percentage of Population Employed in Business & Financial in Michigan is 5.3%.
What is the Percentage of Population Employed in Business & Financial in the United States?
Percentage of Population Employed in Business & Financial in the United States is 5.8%.