Zip Codes with the Highest Percentage of Population with a Degree in Liberal Arts and History in Utica, MI
RELATED REPORTS & OPTIONS
Liberal Arts and History
Utica
Compare Zip Codes
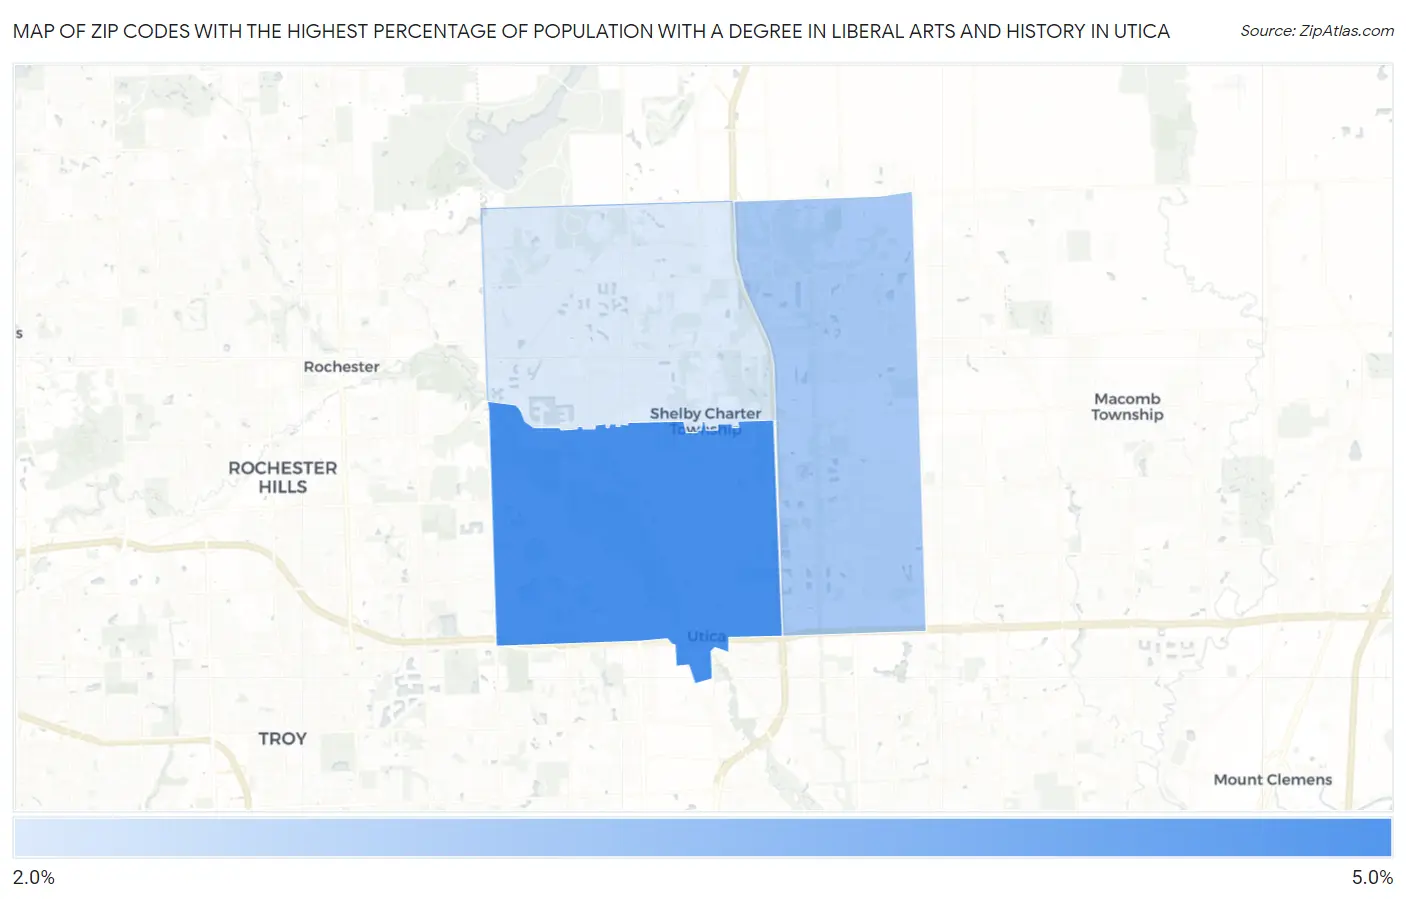
Map of Zip Codes with the Highest Percentage of Population with a Degree in Liberal Arts and History in Utica
2.1%
4.8%
Zip Codes with the Highest Percentage of Population with a Degree in Liberal Arts and History in Utica, MI
| Zip Code | % Graduates | vs State | vs National | |
| 1. | 48317 | 4.8% | 4.0%(+0.806)#307 | 4.9%(-0.084)#12,008 |
| 2. | 48315 | 3.1% | 4.0%(-0.904)#572 | 4.9%(-1.79)#18,068 |
| 3. | 48316 | 2.1% | 4.0%(-1.90)#725 | 4.9%(-2.79)#21,156 |
1
Common Questions
What are the Top Zip Codes with the Highest Percentage of Population with a Degree in Liberal Arts and History in Utica, MI?
Top Zip Codes with the Highest Percentage of Population with a Degree in Liberal Arts and History in Utica, MI are:
What zip code has the Highest Percentage of Population with a Degree in Liberal Arts and History in Utica, MI?
48317 has the Highest Percentage of Population with a Degree in Liberal Arts and History in Utica, MI with 4.8%.
What is the Percentage of Population with a Degree in Liberal Arts and History in Utica, MI?
Percentage of Population with a Degree in Liberal Arts and History in Utica is 7.1%.
What is the Percentage of Population with a Degree in Liberal Arts and History in Michigan?
Percentage of Population with a Degree in Liberal Arts and History in Michigan is 4.0%.
What is the Percentage of Population with a Degree in Liberal Arts and History in the United States?
Percentage of Population with a Degree in Liberal Arts and History in the United States is 4.9%.