Zip Codes with the Highest Percentage of Population Employed in Community & Social Service in Utica, MI
RELATED REPORTS & OPTIONS
Community & Social Service
Utica
Compare Zip Codes
Map of Zip Codes with the Highest Percentage of Population Employed in Community & Social Service in Utica
7.3%
11.9%
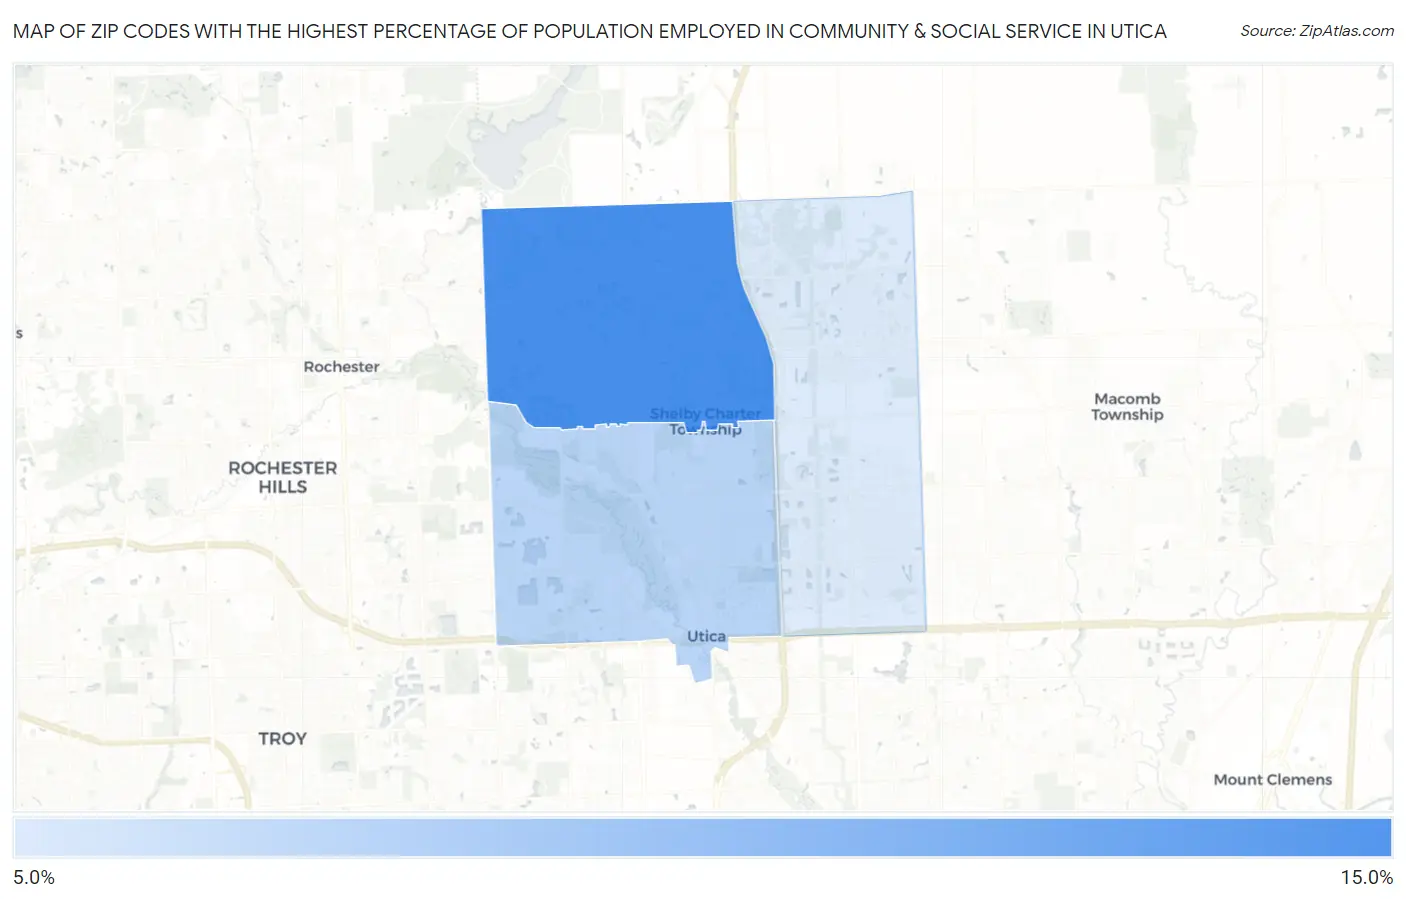
Zip Codes with the Highest Percentage of Population Employed in Community & Social Service in Utica, MI
| Zip Code | % Employed | vs State | vs National | |
| 1. | 48316 | 11.9% | 9.7%(+2.27)#154 | 11.2%(+0.729)#9,497 |
| 2. | 48317 | 8.3% | 9.7%(-1.36)#425 | 11.2%(-2.90)#18,717 |
| 3. | 48315 | 7.3% | 9.7%(-2.41)#554 | 11.2%(-3.94)#21,472 |
1
Common Questions
What are the Top Zip Codes with the Highest Percentage of Population Employed in Community & Social Service in Utica, MI?
Top Zip Codes with the Highest Percentage of Population Employed in Community & Social Service in Utica, MI are:
What zip code has the Highest Percentage of Population Employed in Community & Social Service in Utica, MI?
48316 has the Highest Percentage of Population Employed in Community & Social Service in Utica, MI with 11.9%.
What is the Percentage of Population Employed in Community & Social Service in Utica, MI?
Percentage of Population Employed in Community & Social Service in Utica is 7.4%.
What is the Percentage of Population Employed in Community & Social Service in Michigan?
Percentage of Population Employed in Community & Social Service in Michigan is 9.7%.
What is the Percentage of Population Employed in Community & Social Service in the United States?
Percentage of Population Employed in Community & Social Service in the United States is 11.2%.