Zip Codes with the Highest Percentage of Households with Income Above $100,000 in Lawrence, MA
RELATED REPORTS & OPTIONS
Household Income | $100k+
Lawrence
Compare Zip Codes
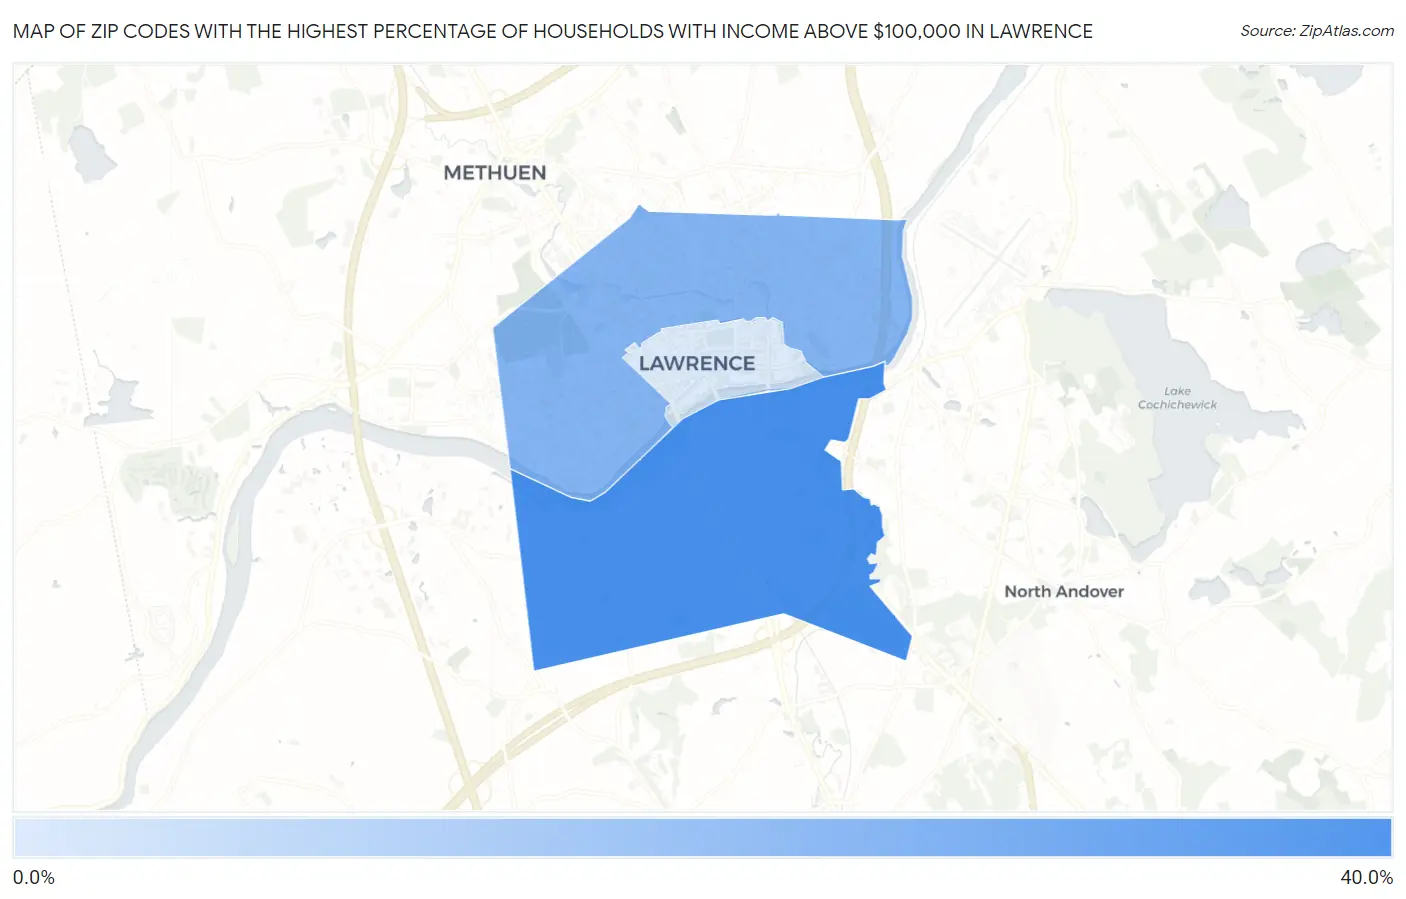
Map of Zip Codes with the Highest Percentage of Households with Income Above $100,000 in Lawrence
8.5%
31.7%
Zip Codes with the Highest Percentage of Households with Income Above $100,000 in Lawrence, MA
| Zip Code | Households with Income > $100k | vs State | vs National | |
| 1. | 01843 | 31.7% | 48.6%(-16.9)#452 | 37.3%(-5.60)#14,093 |
| 2. | 01841 | 21.7% | 48.6%(-26.9)#503 | 37.3%(-15.6)#22,646 |
| 3. | 01840 | 8.5% | 48.6%(-40.1)#524 | 37.3%(-28.8)#30,302 |
1
Common Questions
What are the Top Zip Codes with the Highest Percentage of Households with Income Above $100,000 in Lawrence, MA?
Top Zip Codes with the Highest Percentage of Households with Income Above $100,000 in Lawrence, MA are:
What zip code has the Highest Percentage of Households with Income Above $100,000 in Lawrence, MA?
01843 has the Highest Percentage of Households with Income Above $100,000 in Lawrence, MA with 31.7%.
What is the Percentage of Households with Income Above $100,000 in Lawrence, MA?
Percentage of Households with Income Above $100,000 in Lawrence is 23.7%.
What is the Percentage of Households with Income Above $100,000 in Massachusetts?
Percentage of Households with Income Above $100,000 in Massachusetts is 48.6%.
What is the Percentage of Households with Income Above $100,000 in the United States?
Percentage of Households with Income Above $100,000 in the United States is 37.3%.