Zip Codes with the Highest Percentage of Population Employed in Accommodation & Food Services in Lawrence, MA
RELATED REPORTS & OPTIONS
Accommodation & Food Services
Lawrence
Compare Zip Codes
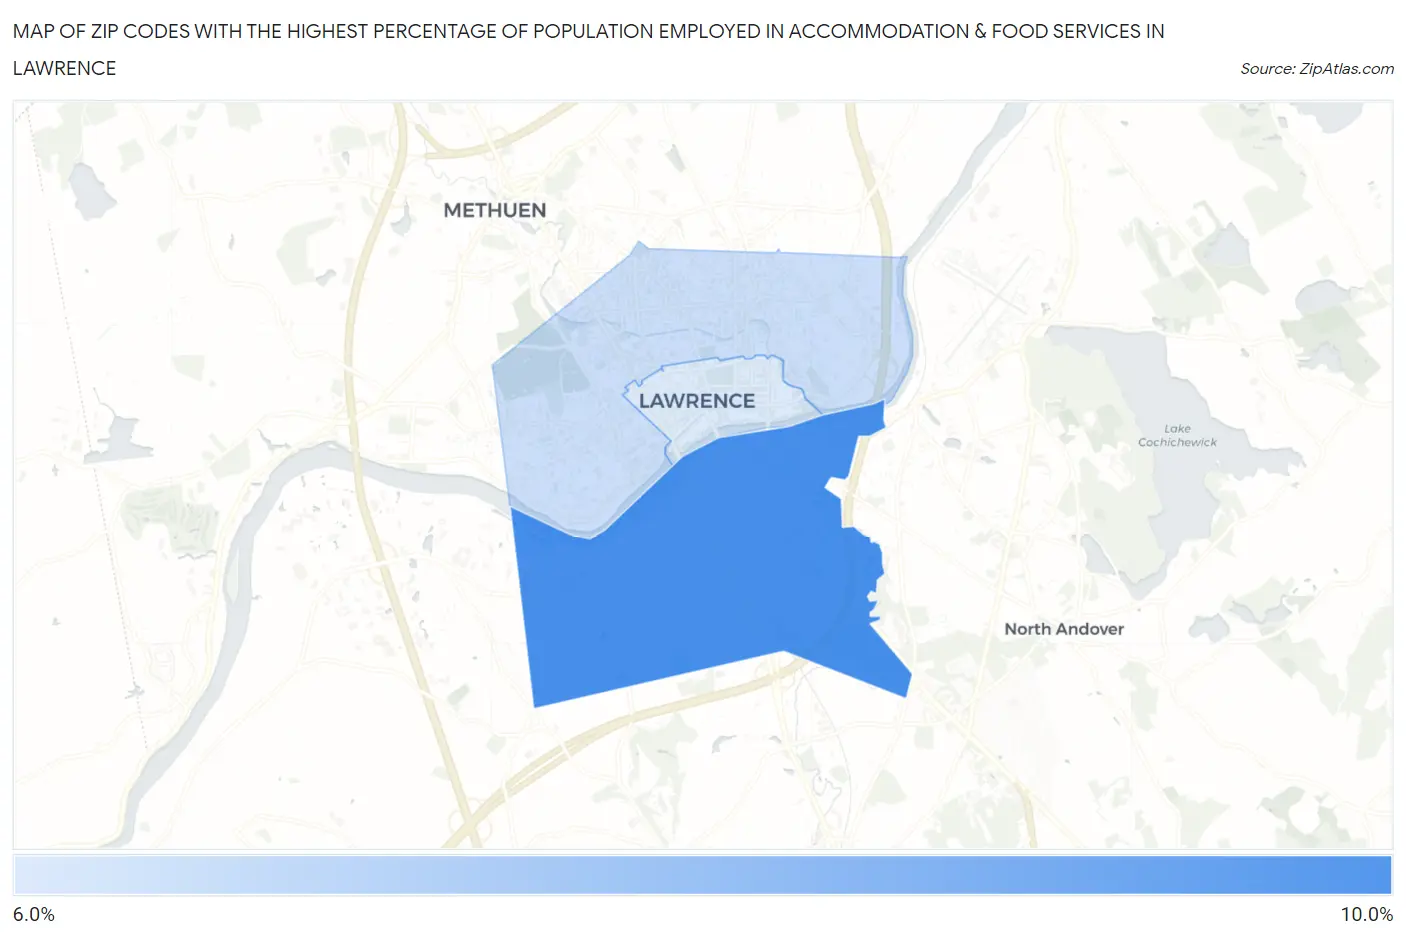
Map of Zip Codes with the Highest Percentage of Population Employed in Accommodation & Food Services in Lawrence
6.6%
9.7%
Zip Codes with the Highest Percentage of Population Employed in Accommodation & Food Services in Lawrence, MA
| Zip Code | % Employed | vs State | vs National | |
| 1. | 01843 | 9.7% | 5.8%(+3.89)#50 | 6.9%(+2.77)#4,993 |
| 2. | 01841 | 7.0% | 5.8%(+1.21)#140 | 6.9%(+0.089)#10,408 |
| 3. | 01840 | 6.6% | 5.8%(+0.846)#156 | 6.9%(-0.273)#11,499 |
1
Common Questions
What are the Top Zip Codes with the Highest Percentage of Population Employed in Accommodation & Food Services in Lawrence, MA?
Top Zip Codes with the Highest Percentage of Population Employed in Accommodation & Food Services in Lawrence, MA are:
What zip code has the Highest Percentage of Population Employed in Accommodation & Food Services in Lawrence, MA?
01843 has the Highest Percentage of Population Employed in Accommodation & Food Services in Lawrence, MA with 9.7%.
What is the Percentage of Population Employed in Accommodation & Food Services in Lawrence, MA?
Percentage of Population Employed in Accommodation & Food Services in Lawrence is 8.0%.
What is the Percentage of Population Employed in Accommodation & Food Services in Massachusetts?
Percentage of Population Employed in Accommodation & Food Services in Massachusetts is 5.8%.
What is the Percentage of Population Employed in Accommodation & Food Services in the United States?
Percentage of Population Employed in Accommodation & Food Services in the United States is 6.9%.