Zip Codes with the Highest Percentage of Population Employed in Office & Administration in Lawrence, MA
RELATED REPORTS & OPTIONS
Office & Administration
Lawrence
Compare Zip Codes
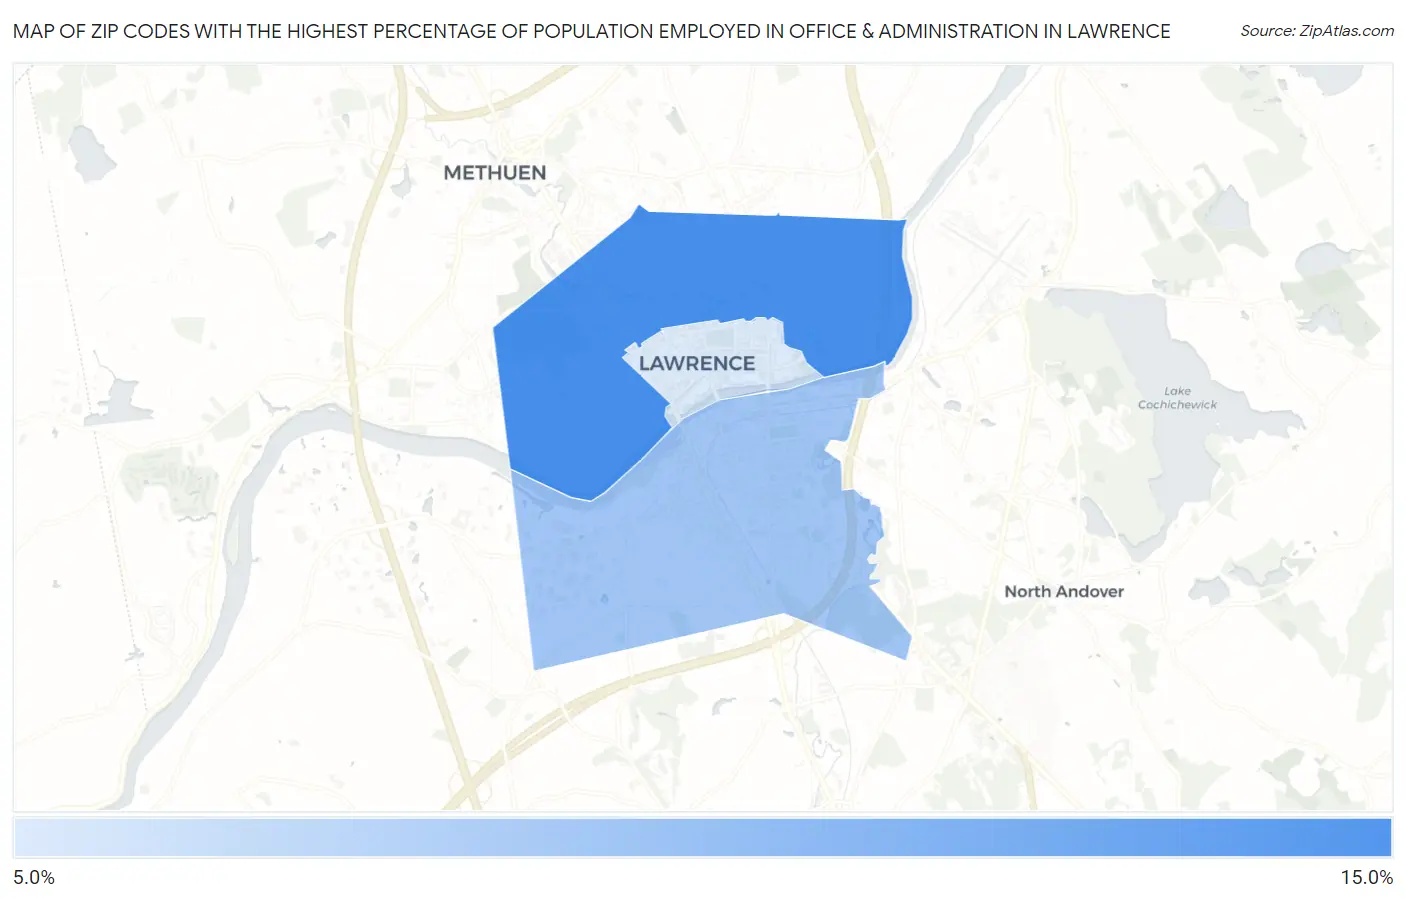
Map of Zip Codes with the Highest Percentage of Population Employed in Office & Administration in Lawrence
6.8%
12.4%
Zip Codes with the Highest Percentage of Population Employed in Office & Administration in Lawrence, MA
| Zip Code | % Employed | vs State | vs National | |
| 1. | 01841 | 12.4% | 9.6%(+2.76)#84 | 10.9%(+1.51)#9,669 |
| 2. | 01843 | 9.0% | 9.6%(-0.646)#286 | 10.9%(-1.89)#20,360 |
| 3. | 01840 | 6.8% | 9.6%(-2.85)#406 | 10.9%(-4.10)#25,659 |
1
Common Questions
What are the Top Zip Codes with the Highest Percentage of Population Employed in Office & Administration in Lawrence, MA?
Top Zip Codes with the Highest Percentage of Population Employed in Office & Administration in Lawrence, MA are:
What zip code has the Highest Percentage of Population Employed in Office & Administration in Lawrence, MA?
01841 has the Highest Percentage of Population Employed in Office & Administration in Lawrence, MA with 12.4%.
What is the Percentage of Population Employed in Office & Administration in Lawrence, MA?
Percentage of Population Employed in Office & Administration in Lawrence is 10.7%.
What is the Percentage of Population Employed in Office & Administration in Massachusetts?
Percentage of Population Employed in Office & Administration in Massachusetts is 9.6%.
What is the Percentage of Population Employed in Office & Administration in the United States?
Percentage of Population Employed in Office & Administration in the United States is 10.9%.