Zip Codes with the Highest Percentage of Population with a Degree in Liberal Arts and History in Lawrence, MA
RELATED REPORTS & OPTIONS
Liberal Arts and History
Lawrence
Compare Zip Codes
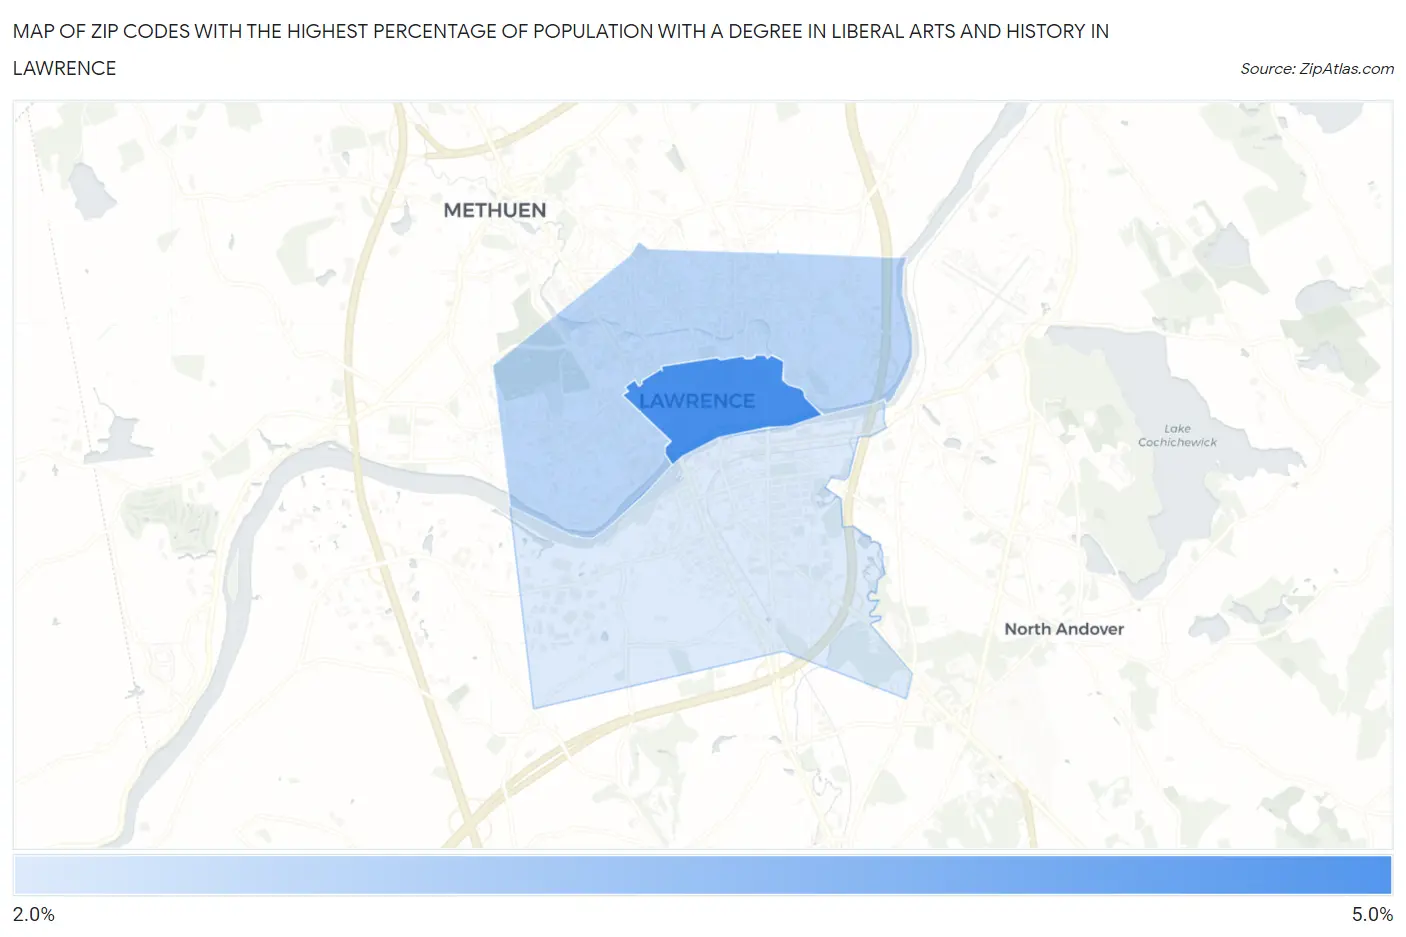
Map of Zip Codes with the Highest Percentage of Population with a Degree in Liberal Arts and History in Lawrence
2.1%
4.4%
Zip Codes with the Highest Percentage of Population with a Degree in Liberal Arts and History in Lawrence, MA
| Zip Code | % Graduates | vs State | vs National | |
| 1. | 01840 | 4.4% | 5.5%(-1.10)#323 | 4.9%(-0.495)#13,365 |
| 2. | 01841 | 2.6% | 5.5%(-2.85)#445 | 4.9%(-2.24)#19,541 |
| 3. | 01843 | 2.1% | 5.5%(-3.35)#466 | 4.9%(-2.74)#21,003 |
1
Common Questions
What are the Top Zip Codes with the Highest Percentage of Population with a Degree in Liberal Arts and History in Lawrence, MA?
Top Zip Codes with the Highest Percentage of Population with a Degree in Liberal Arts and History in Lawrence, MA are:
What zip code has the Highest Percentage of Population with a Degree in Liberal Arts and History in Lawrence, MA?
01840 has the Highest Percentage of Population with a Degree in Liberal Arts and History in Lawrence, MA with 4.4%.
What is the Percentage of Population with a Degree in Liberal Arts and History in Lawrence, MA?
Percentage of Population with a Degree in Liberal Arts and History in Lawrence is 2.6%.
What is the Percentage of Population with a Degree in Liberal Arts and History in Massachusetts?
Percentage of Population with a Degree in Liberal Arts and History in Massachusetts is 5.5%.
What is the Percentage of Population with a Degree in Liberal Arts and History in the United States?
Percentage of Population with a Degree in Liberal Arts and History in the United States is 4.9%.