Zip Codes with the Highest Percentage of Population Employed in Real Estate, Rental & Leasing in Lawrence, MA
RELATED REPORTS & OPTIONS
Real Estate, Rental & Leasing
Lawrence
Compare Zip Codes
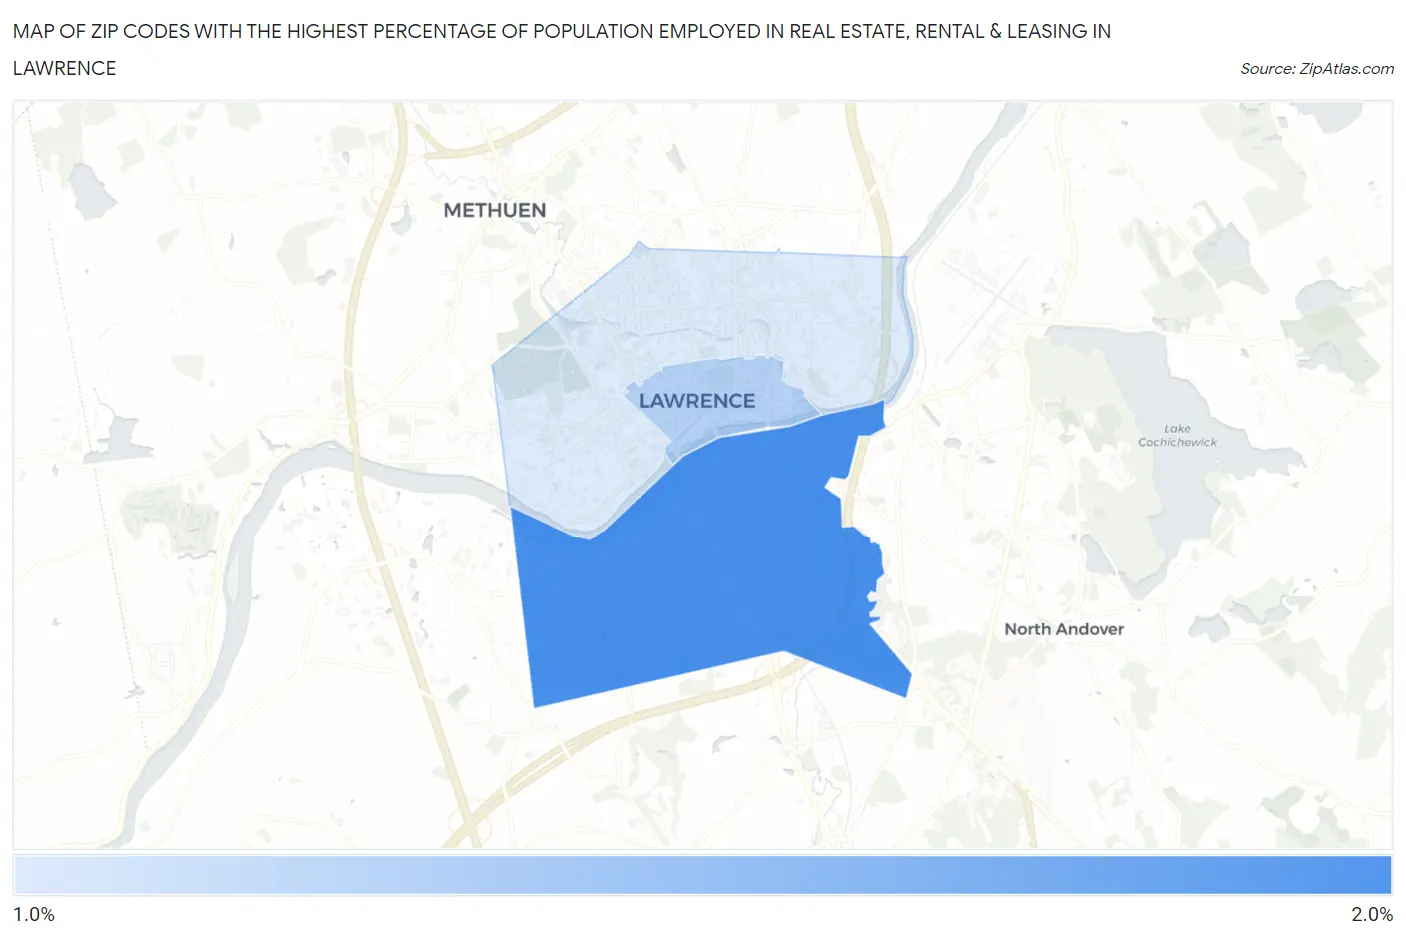
Map of Zip Codes with the Highest Percentage of Population Employed in Real Estate, Rental & Leasing in Lawrence
1.6%
1.9%
Zip Codes with the Highest Percentage of Population Employed in Real Estate, Rental & Leasing in Lawrence, MA
| Zip Code | % Employed | vs State | vs National | |
| 1. | 01843 | 1.9% | 1.7%(+0.237)#176 | 1.9%(+0.005)#8,491 |
| 2. | 01840 | 1.7% | 1.7%(-0.008)#215 | 1.9%(-0.240)#10,102 |
| 3. | 01841 | 1.6% | 1.7%(-0.098)#231 | 1.9%(-0.331)#10,716 |
1
Common Questions
What are the Top Zip Codes with the Highest Percentage of Population Employed in Real Estate, Rental & Leasing in Lawrence, MA?
Top Zip Codes with the Highest Percentage of Population Employed in Real Estate, Rental & Leasing in Lawrence, MA are:
What zip code has the Highest Percentage of Population Employed in Real Estate, Rental & Leasing in Lawrence, MA?
01843 has the Highest Percentage of Population Employed in Real Estate, Rental & Leasing in Lawrence, MA with 1.9%.
What is the Percentage of Population Employed in Real Estate, Rental & Leasing in Lawrence, MA?
Percentage of Population Employed in Real Estate, Rental & Leasing in Lawrence is 1.7%.
What is the Percentage of Population Employed in Real Estate, Rental & Leasing in Massachusetts?
Percentage of Population Employed in Real Estate, Rental & Leasing in Massachusetts is 1.7%.
What is the Percentage of Population Employed in Real Estate, Rental & Leasing in the United States?
Percentage of Population Employed in Real Estate, Rental & Leasing in the United States is 1.9%.