Zip Codes with the Highest Percentage of Households with Income Above $100,000 in Lynn, MA
RELATED REPORTS & OPTIONS
Household Income | $100k+
Lynn
Compare Zip Codes
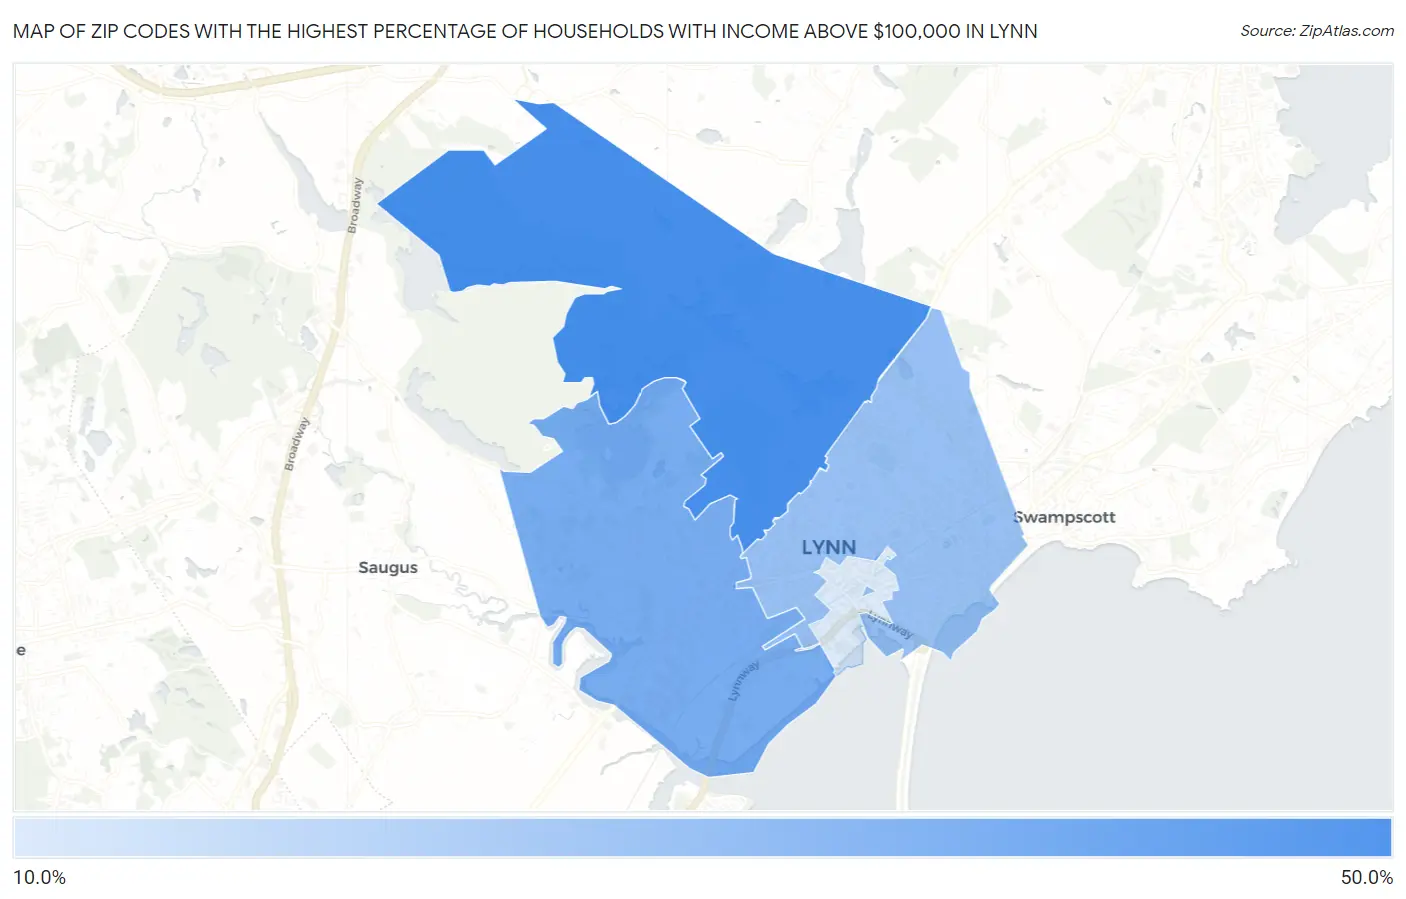
Map of Zip Codes with the Highest Percentage of Households with Income Above $100,000 in Lynn
11.2%
48.0%
Zip Codes with the Highest Percentage of Households with Income Above $100,000 in Lynn, MA
| Zip Code | Households with Income > $100k | vs State | vs National | |
| 1. | 01904 | 48.0% | 48.6%(-0.600)#291 | 37.3%(+10.7)#5,499 |
| 2. | 01905 | 35.0% | 48.6%(-13.6)#428 | 37.3%(-2.30)#11,763 |
| 3. | 01902 | 26.8% | 48.6%(-21.8)#475 | 37.3%(-10.5)#18,135 |
| 4. | 01901 | 11.2% | 48.6%(-37.4)#521 | 37.3%(-26.1)#29,369 |
1
Common Questions
What are the Top 3 Zip Codes with the Highest Percentage of Households with Income Above $100,000 in Lynn, MA?
Top 3 Zip Codes with the Highest Percentage of Households with Income Above $100,000 in Lynn, MA are:
What zip code has the Highest Percentage of Households with Income Above $100,000 in Lynn, MA?
01904 has the Highest Percentage of Households with Income Above $100,000 in Lynn, MA with 48.0%.
What is the Percentage of Households with Income Above $100,000 in Lynn, MA?
Percentage of Households with Income Above $100,000 in Lynn is 32.6%.
What is the Percentage of Households with Income Above $100,000 in Massachusetts?
Percentage of Households with Income Above $100,000 in Massachusetts is 48.6%.
What is the Percentage of Households with Income Above $100,000 in the United States?
Percentage of Households with Income Above $100,000 in the United States is 37.3%.