Zip Codes with the Highest Percentage of Population Employed in Installation, Maintenance & Repair in Lawrence, MA
RELATED REPORTS & OPTIONS
Installation, Maintenance & Repair
Lawrence
Compare Zip Codes
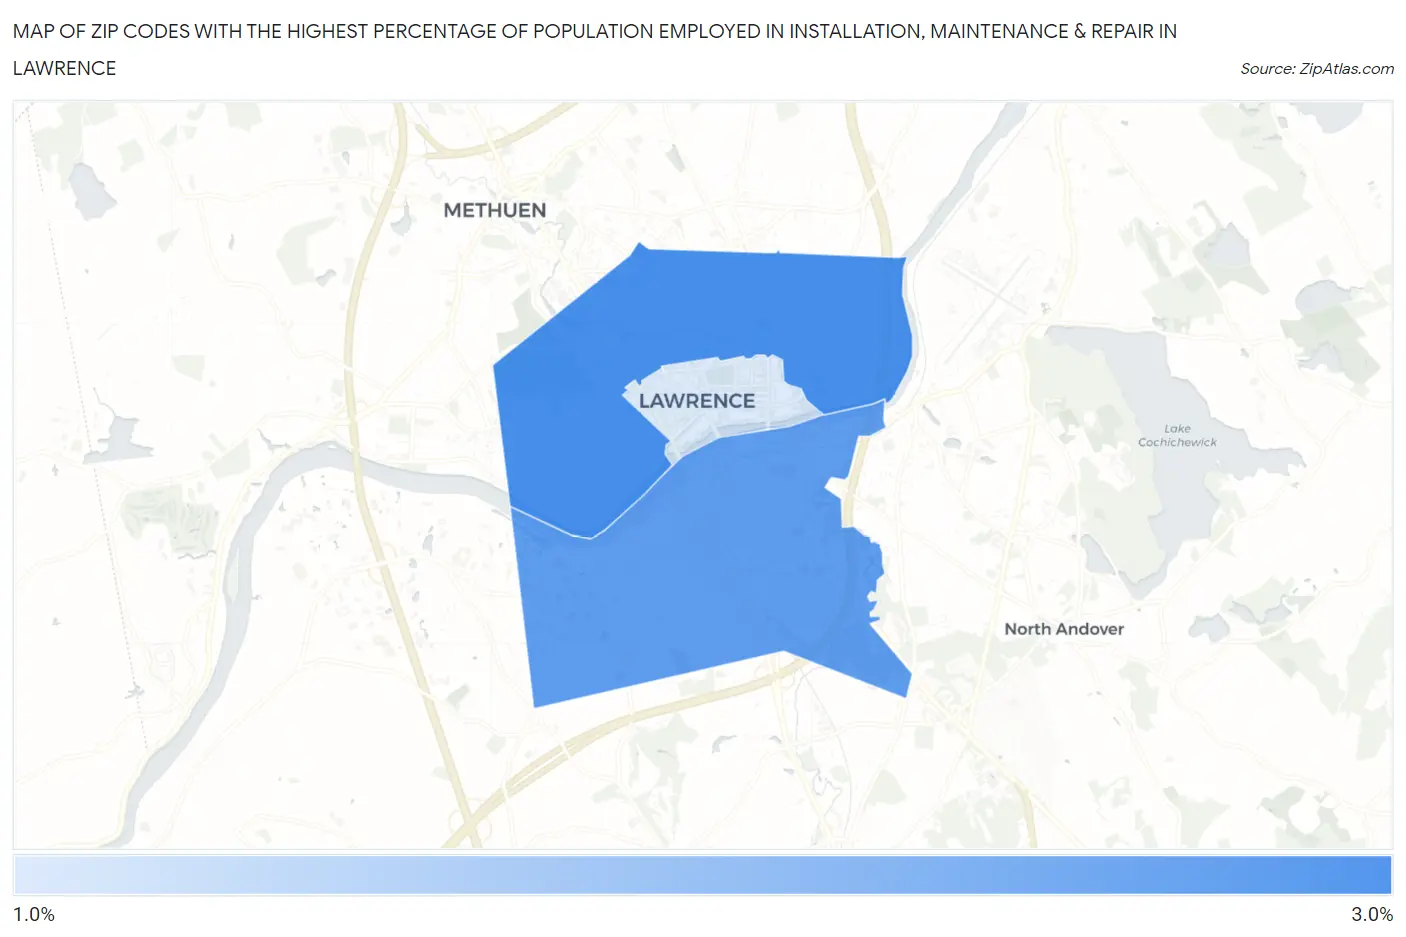
Map of Zip Codes with the Highest Percentage of Population Employed in Installation, Maintenance & Repair in Lawrence
1.6%
2.7%
Zip Codes with the Highest Percentage of Population Employed in Installation, Maintenance & Repair in Lawrence, MA
| Zip Code | % Employed | vs State | vs National | |
| 1. | 01841 | 2.7% | 2.2%(+0.458)#198 | 3.1%(-0.413)#18,796 |
| 2. | 01843 | 2.5% | 2.2%(+0.292)#216 | 3.1%(-0.579)#19,611 |
| 3. | 01840 | 1.6% | 2.2%(-0.617)#316 | 3.1%(-1.49)#23,861 |
1
Common Questions
What are the Top Zip Codes with the Highest Percentage of Population Employed in Installation, Maintenance & Repair in Lawrence, MA?
Top Zip Codes with the Highest Percentage of Population Employed in Installation, Maintenance & Repair in Lawrence, MA are:
What zip code has the Highest Percentage of Population Employed in Installation, Maintenance & Repair in Lawrence, MA?
01841 has the Highest Percentage of Population Employed in Installation, Maintenance & Repair in Lawrence, MA with 2.7%.
What is the Percentage of Population Employed in Installation, Maintenance & Repair in Lawrence, MA?
Percentage of Population Employed in Installation, Maintenance & Repair in Lawrence is 2.5%.
What is the Percentage of Population Employed in Installation, Maintenance & Repair in Massachusetts?
Percentage of Population Employed in Installation, Maintenance & Repair in Massachusetts is 2.2%.
What is the Percentage of Population Employed in Installation, Maintenance & Repair in the United States?
Percentage of Population Employed in Installation, Maintenance & Repair in the United States is 3.1%.