Zip Codes with the Highest Percentage of Population Taking Taxi / Cab to Work in Lawrence, MA
RELATED REPORTS & OPTIONS
Taxi / Cab
Lawrence
Compare Zip Codes
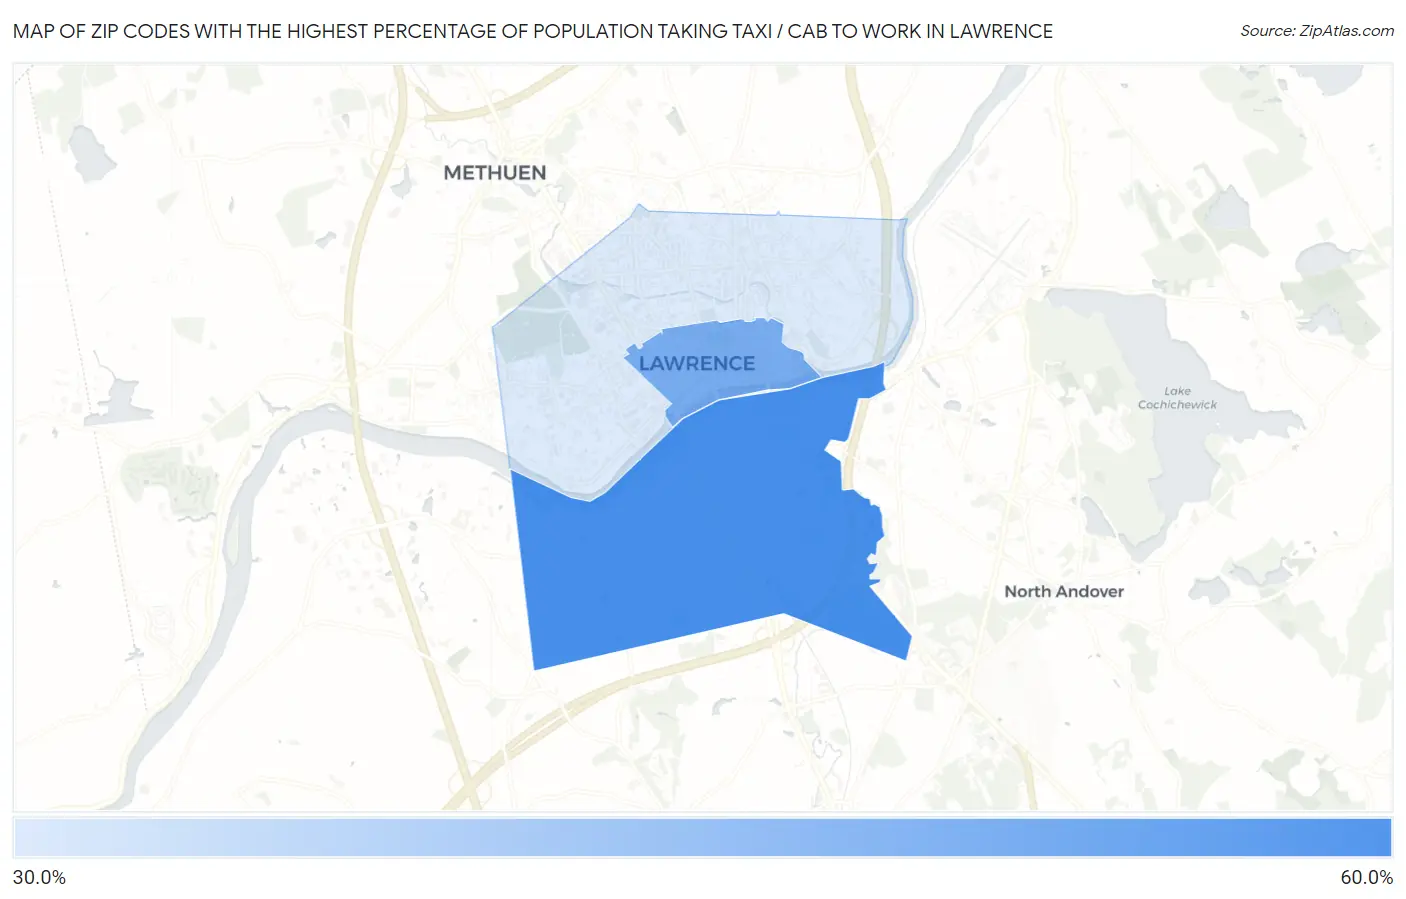
Map of Zip Codes with the Highest Percentage of Population Taking Taxi / Cab to Work in Lawrence
31.6%
54.9%
Zip Codes with the Highest Percentage of Population Taking Taxi / Cab to Work in Lawrence, MA
| Zip Code | % Take Taxi / Cab | vs State | vs National | |
| 1. | 01843 | 54.9% | 35.1%(+19.8)#33 | 38.2%(+16.7)#1,620 |
| 2. | 01840 | 46.8% | 35.1%(+11.7)#75 | 38.2%(+8.60)#4,021 |
| 3. | 01841 | 31.6% | 35.1%(-3.50)#201 | 38.2%(-6.60)#10,310 |
1
Common Questions
What are the Top Zip Codes with the Highest Percentage of Population Taking Taxi / Cab to Work in Lawrence, MA?
Top Zip Codes with the Highest Percentage of Population Taking Taxi / Cab to Work in Lawrence, MA are:
What zip code has the Highest Percentage of Population Taking Taxi / Cab to Work in Lawrence, MA?
01843 has the Highest Percentage of Population Taking Taxi / Cab to Work in Lawrence, MA with 54.9%.
What is the Percentage of Population Taking Taxi / Cab to Work in Lawrence, MA?
Percentage of Population Taking Taxi / Cab to Work in Lawrence is 37.5%.
What is the Percentage of Population Taking Taxi / Cab to Work in Massachusetts?
Percentage of Population Taking Taxi / Cab to Work in Massachusetts is 35.1%.
What is the Percentage of Population Taking Taxi / Cab to Work in the United States?
Percentage of Population Taking Taxi / Cab to Work in the United States is 38.2%.