Cities with the Highest Percentage of Self-Employed / Incorporated in Kentucky
RELATED REPORTS & OPTIONS
Self-Employed / Incorporated
Kentucky
Compare Cities
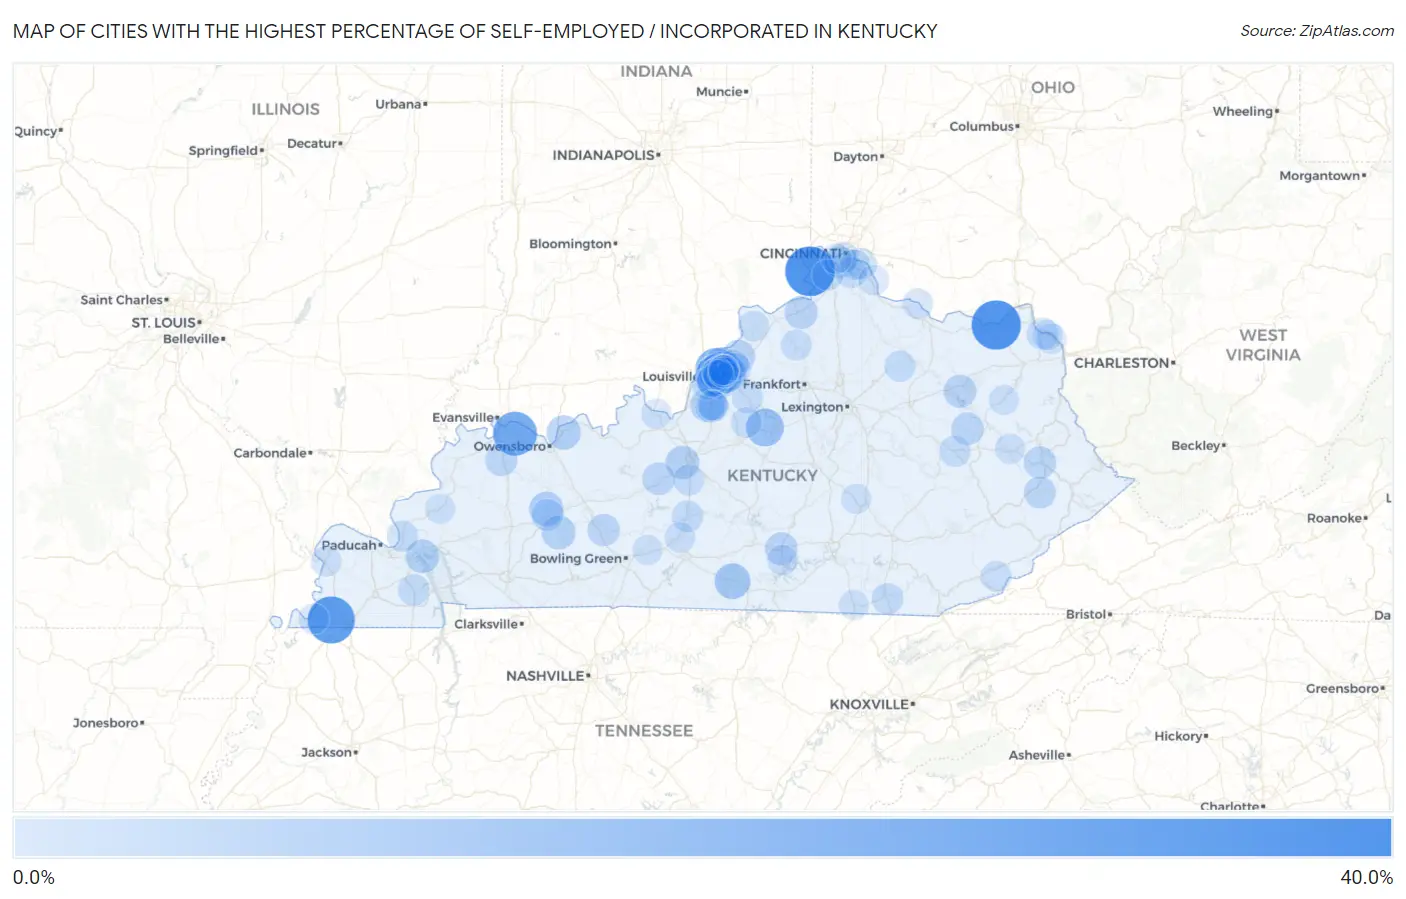
Map of Cities with the Highest Percentage of Self-Employed / Incorporated in Kentucky
0.0%
40.0%
Cities with the Highest Percentage of Self-Employed / Incorporated in Kentucky
| City | % Self-Employed / Incorporated | vs State | vs National | |
| 1. | Belleview | 37.5% | 3.0%(+34.5)#1 | 3.8%(+33.7)#176 |
| 2. | Garrison | 37.0% | 3.0%(+33.9)#2 | 3.8%(+33.2)#180 |
| 3. | Cayce | 33.3% | 3.0%(+30.3)#3 | 3.8%(+29.5)#207 |
| 4. | Spottsville | 27.8% | 3.0%(+24.8)#4 | 3.8%(+24.0)#300 |
| 5. | Glenview | 23.5% | 3.0%(+20.5)#5 | 3.8%(+19.7)#430 |
| 6. | Chaplin | 17.6% | 3.0%(+14.6)#6 | 3.8%(+13.8)#815 |
| 7. | Maryhill Estates | 17.2% | 3.0%(+14.2)#7 | 3.8%(+13.4)#839 |
| 8. | Ten Broeck | 16.7% | 3.0%(+13.6)#8 | 3.8%(+12.8)#890 |
| 9. | Meadow Vale | 16.3% | 3.0%(+13.3)#9 | 3.8%(+12.5)#918 |
| 10. | Druid Hills | 15.8% | 3.0%(+12.7)#10 | 3.8%(+11.9)#978 |
| 11. | Rolling Fields | 14.5% | 3.0%(+11.5)#11 | 3.8%(+10.7)#1,142 |
| 12. | Indian Hills | 14.5% | 3.0%(+11.4)#12 | 3.8%(+10.6)#1,153 |
| 13. | Hills And Dales | 14.3% | 3.0%(+11.3)#13 | 3.8%(+10.5)#1,174 |
| 14. | Marrowbone | 14.0% | 3.0%(+11.0)#14 | 3.8%(+10.2)#1,237 |
| 15. | Riverwood | 12.9% | 3.0%(+9.92)#15 | 3.8%(+9.12)#1,436 |
| 16. | Anchorage | 12.8% | 3.0%(+9.77)#16 | 3.8%(+8.98)#1,467 |
| 17. | South Carrollton | 11.8% | 3.0%(+8.74)#17 | 3.8%(+7.95)#1,721 |
| 18. | Maceo | 11.6% | 3.0%(+8.57)#18 | 3.8%(+7.78)#1,767 |
| 19. | Brooks | 11.3% | 3.0%(+8.26)#19 | 3.8%(+7.47)#1,854 |
| 20. | Beechmont | 10.9% | 3.0%(+7.92)#20 | 3.8%(+7.13)#1,954 |
| 21. | Grand Rivers | 10.9% | 3.0%(+7.89)#21 | 3.8%(+7.10)#1,960 |
| 22. | Cecilia | 10.6% | 3.0%(+7.54)#22 | 3.8%(+6.75)#2,079 |
| 23. | Norbourne Estates | 10.4% | 3.0%(+7.40)#23 | 3.8%(+6.61)#2,131 |
| 24. | Mockingbird Valley | 10.3% | 3.0%(+7.32)#24 | 3.8%(+6.53)#2,158 |
| 25. | Prospect | 9.7% | 3.0%(+6.64)#25 | 3.8%(+5.85)#2,419 |
| 26. | Sparta | 9.6% | 3.0%(+6.62)#26 | 3.8%(+5.83)#2,428 |
| 27. | Lakeview Heights | 9.6% | 3.0%(+6.60)#27 | 3.8%(+5.81)#2,436 |
| 28. | Bancroft | 9.5% | 3.0%(+6.50)#28 | 3.8%(+5.71)#2,472 |
| 29. | Glenview Hills | 9.3% | 3.0%(+6.32)#29 | 3.8%(+5.52)#2,544 |
| 30. | Russell Springs | 9.3% | 3.0%(+6.27)#30 | 3.8%(+5.47)#2,564 |
| 31. | Buckner | 9.2% | 3.0%(+6.22)#31 | 3.8%(+5.43)#2,582 |
| 32. | Big Clifty | 9.0% | 3.0%(+5.93)#32 | 3.8%(+5.14)#2,738 |
| 33. | Bellewood | 8.9% | 3.0%(+5.92)#33 | 3.8%(+5.13)#2,745 |
| 34. | Creekside | 8.9% | 3.0%(+5.88)#34 | 3.8%(+5.08)#2,768 |
| 35. | Ezel | 8.9% | 3.0%(+5.84)#35 | 3.8%(+5.04)#2,787 |
| 36. | Meadowview Estates | 8.8% | 3.0%(+5.75)#36 | 3.8%(+4.95)#2,838 |
| 37. | Houston Acres | 8.7% | 3.0%(+5.65)#37 | 3.8%(+4.85)#2,887 |
| 38. | Fox Chase | 8.6% | 3.0%(+5.61)#38 | 3.8%(+4.82)#2,906 |
| 39. | Prestonsburg | 8.6% | 3.0%(+5.58)#39 | 3.8%(+4.79)#2,921 |
| 40. | Woodbury | 8.6% | 3.0%(+5.55)#40 | 3.8%(+4.75)#2,944 |
| 41. | Richlawn | 8.2% | 3.0%(+5.19)#41 | 3.8%(+4.40)#3,191 |
| 42. | Robards | 8.1% | 3.0%(+5.11)#42 | 3.8%(+4.32)#3,244 |
| 43. | Wayland | 8.1% | 3.0%(+5.06)#43 | 3.8%(+4.26)#3,278 |
| 44. | Strathmoor Manor | 8.0% | 3.0%(+4.98)#44 | 3.8%(+4.18)#3,338 |
| 45. | Pewee Valley | 7.9% | 3.0%(+4.91)#45 | 3.8%(+4.11)#3,391 |
| 46. | Central City | 7.9% | 3.0%(+4.88)#46 | 3.8%(+4.08)#3,400 |
| 47. | Lakeside Park | 7.6% | 3.0%(+4.57)#47 | 3.8%(+3.78)#3,673 |
| 48. | Hardin | 7.5% | 3.0%(+4.45)#48 | 3.8%(+3.65)#3,757 |
| 49. | Wurtland | 7.3% | 3.0%(+4.31)#49 | 3.8%(+3.52)#3,869 |
| 50. | Audubon Park | 7.3% | 3.0%(+4.27)#50 | 3.8%(+3.48)#3,907 |
| 51. | Emlyn | 7.3% | 3.0%(+4.23)#51 | 3.8%(+3.44)#3,951 |
| 52. | Seneca Gardens | 7.2% | 3.0%(+4.14)#52 | 3.8%(+3.35)#4,029 |
| 53. | Munfordville | 7.1% | 3.0%(+4.11)#53 | 3.8%(+3.31)#4,062 |
| 54. | Strathmoor Village | 7.1% | 3.0%(+4.06)#54 | 3.8%(+3.27)#4,094 |
| 55. | Smithland | 7.0% | 3.0%(+3.93)#55 | 3.8%(+3.14)#4,211 |
| 56. | Campton | 6.9% | 3.0%(+3.92)#56 | 3.8%(+3.13)#4,218 |
| 57. | Carlisle | 6.9% | 3.0%(+3.83)#57 | 3.8%(+3.04)#4,327 |
| 58. | Goose Creek | 6.8% | 3.0%(+3.81)#58 | 3.8%(+3.02)#4,344 |
| 59. | Hurstbourne | 6.7% | 3.0%(+3.69)#59 | 3.8%(+2.90)#4,470 |
| 60. | Melbourne | 6.7% | 3.0%(+3.64)#60 | 3.8%(+2.85)#4,514 |
| 61. | Langdon Place | 6.6% | 3.0%(+3.57)#61 | 3.8%(+2.78)#4,583 |
| 62. | Ryland Heights | 6.6% | 3.0%(+3.57)#62 | 3.8%(+2.78)#4,590 |
| 63. | Beechwood Village | 6.5% | 3.0%(+3.52)#63 | 3.8%(+2.73)#4,650 |
| 64. | Union | 6.5% | 3.0%(+3.52)#64 | 3.8%(+2.72)#4,659 |
| 65. | Barbourmeade | 6.5% | 3.0%(+3.48)#65 | 3.8%(+2.68)#4,696 |
| 66. | Elk Creek | 6.5% | 3.0%(+3.48)#66 | 3.8%(+2.68)#4,698 |
| 67. | Sonora | 6.5% | 3.0%(+3.47)#67 | 3.8%(+2.68)#4,704 |
| 68. | Blue Ridge Manor | 6.5% | 3.0%(+3.43)#68 | 3.8%(+2.63)#4,734 |
| 69. | Bedford | 6.3% | 3.0%(+3.30)#69 | 3.8%(+2.51)#4,867 |
| 70. | Windy Hills | 6.3% | 3.0%(+3.26)#70 | 3.8%(+2.46)#4,921 |
| 71. | Gratz | 6.2% | 3.0%(+3.23)#71 | 3.8%(+2.43)#4,971 |
| 72. | Fairfield | 6.1% | 3.0%(+3.04)#72 | 3.8%(+2.24)#5,209 |
| 73. | Park Hills | 6.0% | 3.0%(+2.97)#73 | 3.8%(+2.18)#5,302 |
| 74. | Brownsboro Village | 6.0% | 3.0%(+2.93)#74 | 3.8%(+2.14)#5,362 |
| 75. | Evarts | 5.8% | 3.0%(+2.79)#75 | 3.8%(+2.00)#5,529 |
| 76. | Crestwood | 5.8% | 3.0%(+2.78)#76 | 3.8%(+1.99)#5,541 |
| 77. | Wickliffe | 5.7% | 3.0%(+2.69)#77 | 3.8%(+1.90)#5,677 |
| 78. | Jamestown | 5.7% | 3.0%(+2.66)#78 | 3.8%(+1.87)#5,714 |
| 79. | Dover | 5.7% | 3.0%(+2.64)#79 | 3.8%(+1.84)#5,748 |
| 80. | Hickman | 5.6% | 3.0%(+2.61)#80 | 3.8%(+1.82)#5,773 |
| 81. | Cave City | 5.5% | 3.0%(+2.50)#81 | 3.8%(+1.71)#5,947 |
| 82. | Broeck Pointe | 5.5% | 3.0%(+2.49)#82 | 3.8%(+1.69)#5,967 |
| 83. | Northfield | 5.5% | 3.0%(+2.46)#83 | 3.8%(+1.67)#5,995 |
| 84. | Woodlawn Park | 5.4% | 3.0%(+2.39)#84 | 3.8%(+1.60)#6,099 |
| 85. | Hebron Estates | 5.3% | 3.0%(+2.32)#85 | 3.8%(+1.53)#6,216 |
| 86. | Cold Spring | 5.3% | 3.0%(+2.30)#86 | 3.8%(+1.51)#6,249 |
| 87. | Salyersville | 5.3% | 3.0%(+2.30)#87 | 3.8%(+1.51)#6,250 |
| 88. | Russell | 5.3% | 3.0%(+2.30)#88 | 3.8%(+1.50)#6,255 |
| 89. | Villa Hills | 5.3% | 3.0%(+2.27)#89 | 3.8%(+1.47)#6,296 |
| 90. | California | 5.3% | 3.0%(+2.24)#90 | 3.8%(+1.45)#6,362 |
| 91. | Brodhead | 5.2% | 3.0%(+2.22)#91 | 3.8%(+1.42)#6,383 |
| 92. | Oakland | 5.2% | 3.0%(+2.18)#92 | 3.8%(+1.39)#6,426 |
| 93. | Manor Creek | 5.2% | 3.0%(+2.17)#93 | 3.8%(+1.38)#6,451 |
| 94. | Brandenburg | 5.2% | 3.0%(+2.17)#94 | 3.8%(+1.38)#6,457 |
| 95. | Pioneer Village | 5.2% | 3.0%(+2.13)#95 | 3.8%(+1.34)#6,521 |
| 96. | Pine Knot | 5.2% | 3.0%(+2.13)#96 | 3.8%(+1.33)#6,535 |
| 97. | Raceland | 5.1% | 3.0%(+2.12)#97 | 3.8%(+1.33)#6,540 |
| 98. | Westwood | 5.1% | 3.0%(+2.11)#98 | 3.8%(+1.32)#6,549 |
| 99. | Marion | 5.1% | 3.0%(+2.08)#99 | 3.8%(+1.29)#6,607 |
| 100. | Sandy Hook | 5.1% | 3.0%(+2.05)#100 | 3.8%(+1.26)#6,654 |
Common Questions
What are the Top 10 Cities with the Highest Percentage of Self-Employed / Incorporated in Kentucky?
Top 10 Cities with the Highest Percentage of Self-Employed / Incorporated in Kentucky are:
#1
37.5%
#2
37.0%
#3
33.3%
#4
27.8%
#5
23.5%
#6
17.6%
#7
17.2%
#8
16.7%
#9
16.3%
#10
15.8%
What city has the Highest Percentage of Self-Employed / Incorporated in Kentucky?
Belleview has the Highest Percentage of Self-Employed / Incorporated in Kentucky with 37.5%.
What is the Percentage of Self-Employed / Incorporated in the State of Kentucky?
Percentage of Self-Employed / Incorporated in Kentucky is 3.0%.
What is the Percentage of Self-Employed / Incorporated in the United States?
Percentage of Self-Employed / Incorporated in the United States is 3.8%.