Ezel, KY Map & Demographics
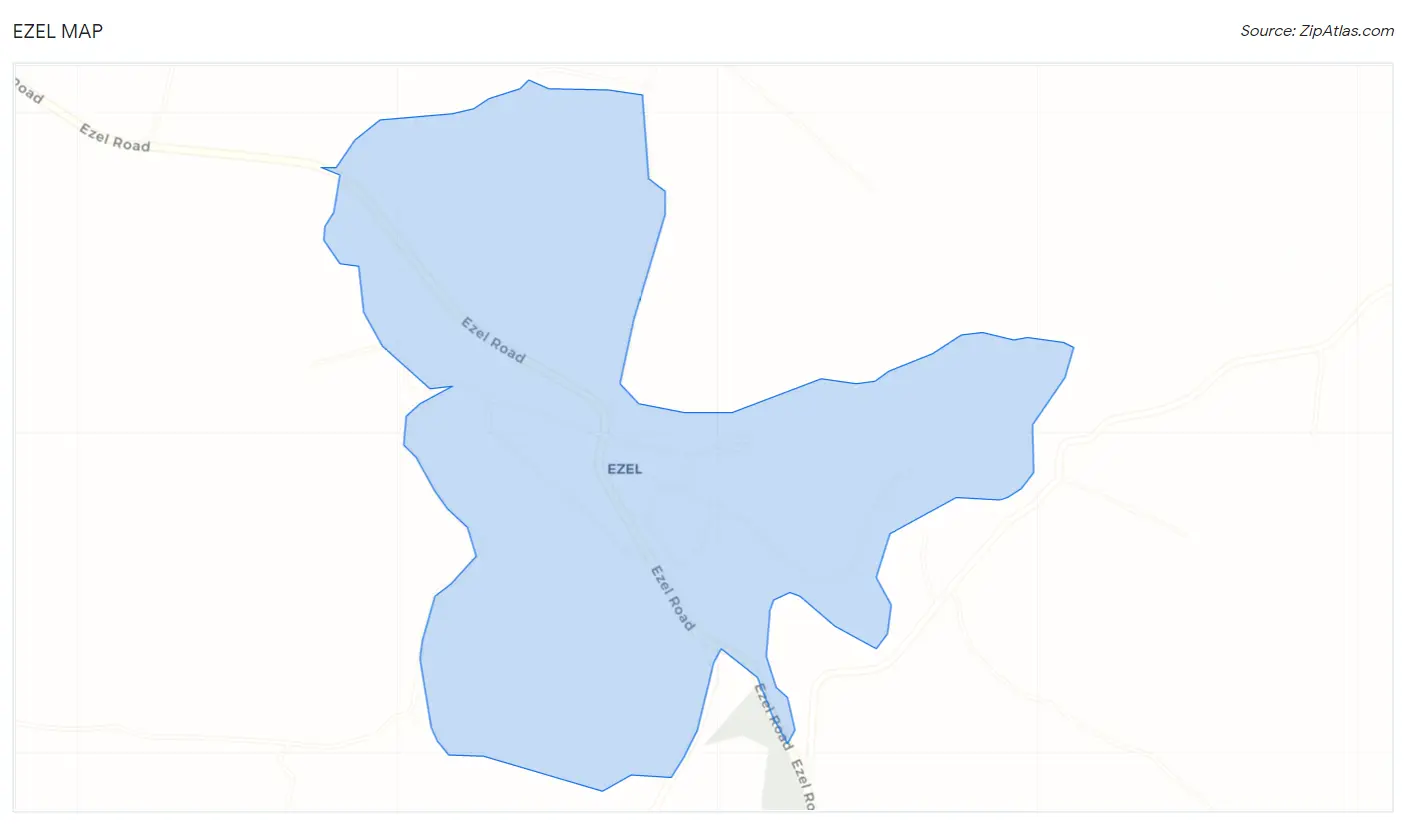
Ezel Map
Ezel Overview
$17,200
PER CAPITA INCOME
$38,500
AVG FAMILY INCOME
$37,850
AVG HOUSEHOLD INCOME
0.34
INEQUALITY / GINI INDEX
325
TOTAL POPULATION
154
MALE POPULATION
171
FEMALE POPULATION
90.06
MALES / 100 FEMALES
111.04
FEMALES / 100 MALES
53.7
MEDIAN AGE
3.1
AVG FAMILY SIZE
2.9
AVG HOUSEHOLD SIZE
79
LABOR FORCE [ PEOPLE ]
28.4%
PERCENT IN LABOR FORCE
Ezel Zip Codes
Ezel Area Codes
Income in Ezel
Income Overview in Ezel
Per Capita Income in Ezel is $17,200, while median incomes of families and households are $38,500 and $37,850 respectively.
| Characteristic | Number | Measure |
| Per Capita Income | 325 | $17,200 |
| Median Family Income | 100 | $38,500 |
| Mean Family Income | 100 | $46,443 |
| Median Household Income | 113 | $37,850 |
| Mean Household Income | 113 | $42,575 |
| Income Deficit | 100 | $0 |
| Wage / Income Gap (%) | 325 | 0.00% |
| Wage / Income Gap ($) | 325 | 100.00¢ per $1 |
| Gini / Inequality Index | 325 | 0.34 |
Earnings by Sex in Ezel
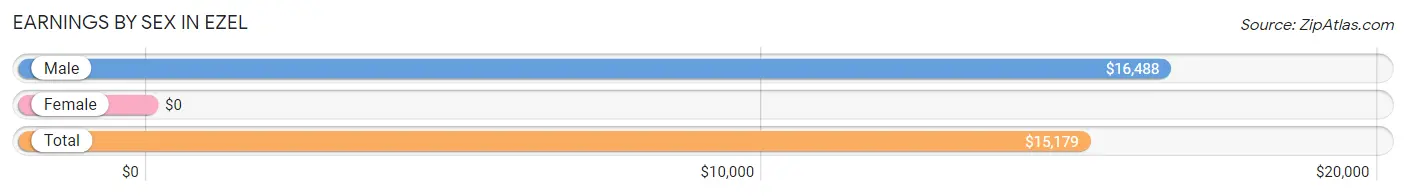
| Sex | Number | Average Earnings |
| Male | 75 (66.4%) | $16,488 |
| Female | 38 (33.6%) | $0 |
| Total | 113 (100.0%) | $15,179 |
Earnings by Sex by Income Bracket in Ezel
The most common earnings brackets in Ezel are $2,499 or less for men (25 | 33.3%) and $2,499 or less for women (16 | 42.1%).
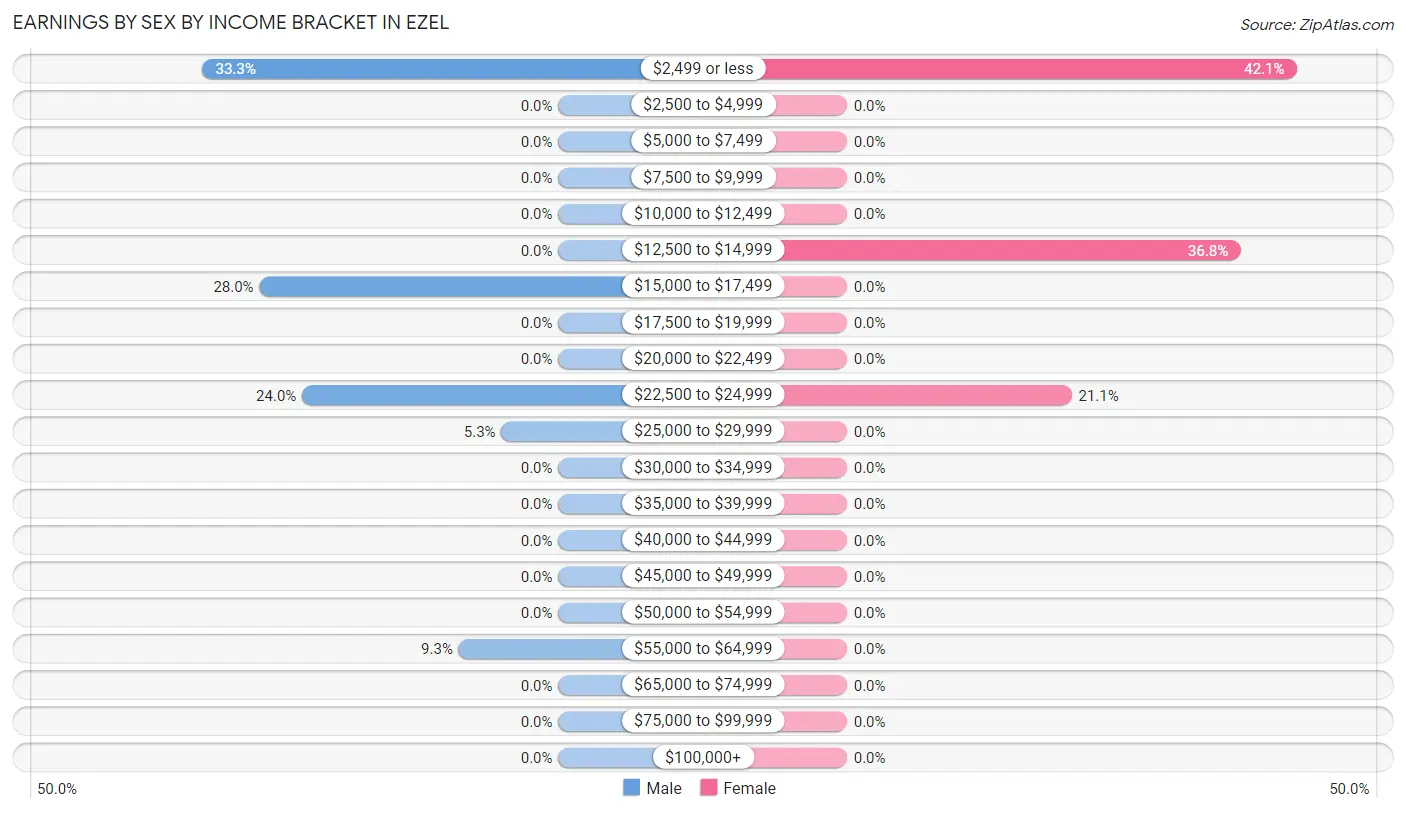
| Income | Male | Female |
| $2,499 or less | 25 (33.3%) | 16 (42.1%) |
| $2,500 to $4,999 | 0 (0.0%) | 0 (0.0%) |
| $5,000 to $7,499 | 0 (0.0%) | 0 (0.0%) |
| $7,500 to $9,999 | 0 (0.0%) | 0 (0.0%) |
| $10,000 to $12,499 | 0 (0.0%) | 0 (0.0%) |
| $12,500 to $14,999 | 0 (0.0%) | 14 (36.8%) |
| $15,000 to $17,499 | 21 (28.0%) | 0 (0.0%) |
| $17,500 to $19,999 | 0 (0.0%) | 0 (0.0%) |
| $20,000 to $22,499 | 0 (0.0%) | 0 (0.0%) |
| $22,500 to $24,999 | 18 (24.0%) | 8 (21.0%) |
| $25,000 to $29,999 | 4 (5.3%) | 0 (0.0%) |
| $30,000 to $34,999 | 0 (0.0%) | 0 (0.0%) |
| $35,000 to $39,999 | 0 (0.0%) | 0 (0.0%) |
| $40,000 to $44,999 | 0 (0.0%) | 0 (0.0%) |
| $45,000 to $49,999 | 0 (0.0%) | 0 (0.0%) |
| $50,000 to $54,999 | 0 (0.0%) | 0 (0.0%) |
| $55,000 to $64,999 | 7 (9.3%) | 0 (0.0%) |
| $65,000 to $74,999 | 0 (0.0%) | 0 (0.0%) |
| $75,000 to $99,999 | 0 (0.0%) | 0 (0.0%) |
| $100,000+ | 0 (0.0%) | 0 (0.0%) |
| Total | 75 (100.0%) | 38 (100.0%) |
Earnings by Sex by Educational Attainment in Ezel
| Educational Attainment | Male Income | Female Income |
| Less than High School | - | - |
| High School Diploma | - | - |
| College or Associate's Degree | - | - |
| Bachelor's Degree | - | - |
| Graduate Degree | - | - |
| Total | $16,905 | $0 |
Family Income in Ezel
Family Income Brackets in Ezel
According to the Ezel family income data, there are 29 families falling into the $35,000 to $49,999 income range, which is the most common income bracket and makes up 29.0% of all families.
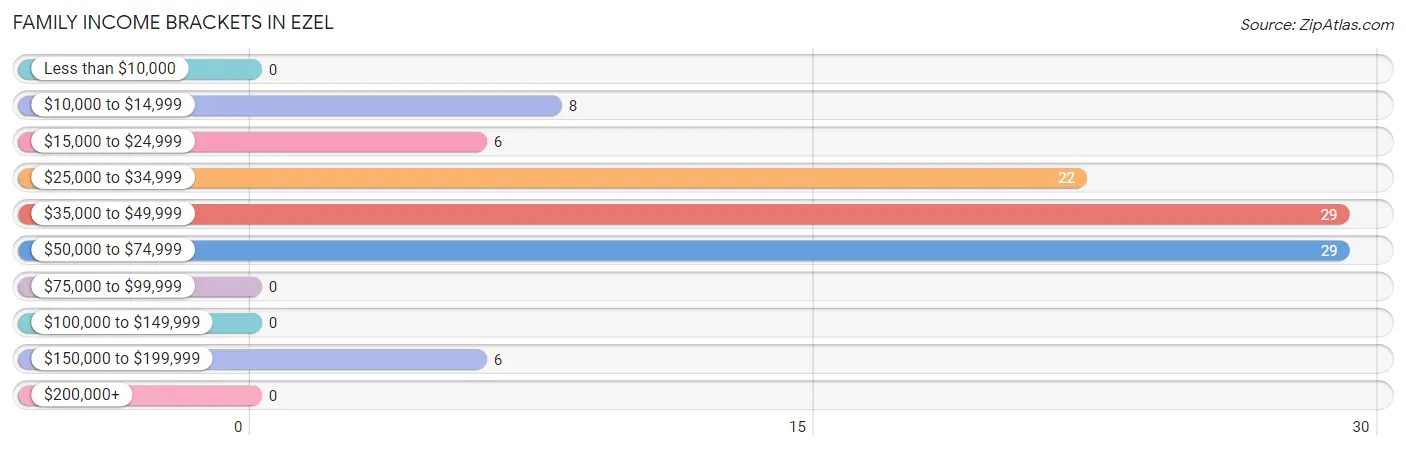
| Income Bracket | # Families | % Families |
| Less than $10,000 | 0 | 0.0% |
| $10,000 to $14,999 | 8 | 8.0% |
| $15,000 to $24,999 | 6 | 6.0% |
| $25,000 to $34,999 | 22 | 22.0% |
| $35,000 to $49,999 | 29 | 29.0% |
| $50,000 to $74,999 | 29 | 29.0% |
| $75,000 to $99,999 | 0 | 0.0% |
| $100,000 to $149,999 | 0 | 0.0% |
| $150,000 to $199,999 | 6 | 6.0% |
| $200,000+ | 0 | 0.0% |
Family Income by Famaliy Size in Ezel
2-person families (43 | 43.0%) account for the highest median family income in Ezel with $29,063 per family, while 2-person families (43 | 43.0%) have the highest median income of $14,532 per family member.
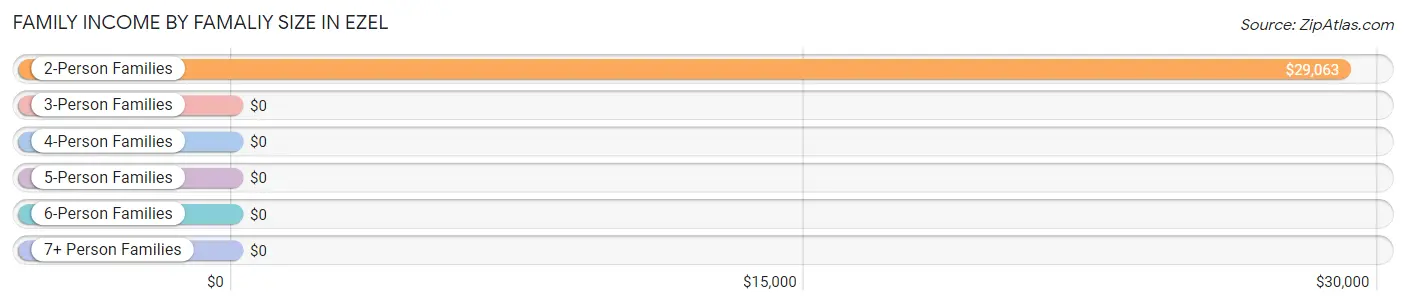
| Income Bracket | # Families | Median Income |
| 2-Person Families | 43 (43.0%) | $29,063 |
| 3-Person Families | 25 (25.0%) | $0 |
| 4-Person Families | 10 (10.0%) | $0 |
| 5-Person Families | 22 (22.0%) | $0 |
| 6-Person Families | 0 (0.0%) | $0 |
| 7+ Person Families | 0 (0.0%) | $0 |
| Total | 100 (100.0%) | $38,500 |
Family Income by Number of Earners in Ezel
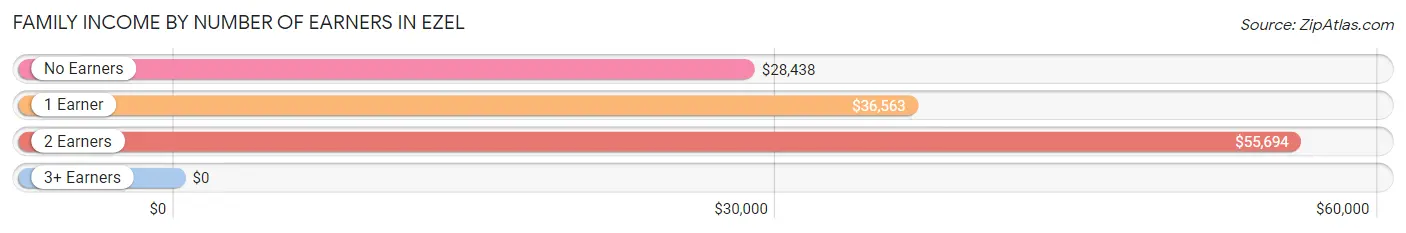
| Number of Earners | # Families | Median Income |
| No Earners | 37 (37.0%) | $28,438 |
| 1 Earner | 25 (25.0%) | $36,563 |
| 2 Earners | 38 (38.0%) | $55,694 |
| 3+ Earners | 0 (0.0%) | $0 |
| Total | 100 (100.0%) | $38,500 |
Household Income in Ezel
Household Income Brackets in Ezel
With 29 households falling in the category, the $35,000 to $49,999 income range is the most frequent in Ezel, accounting for 25.7% of all households.
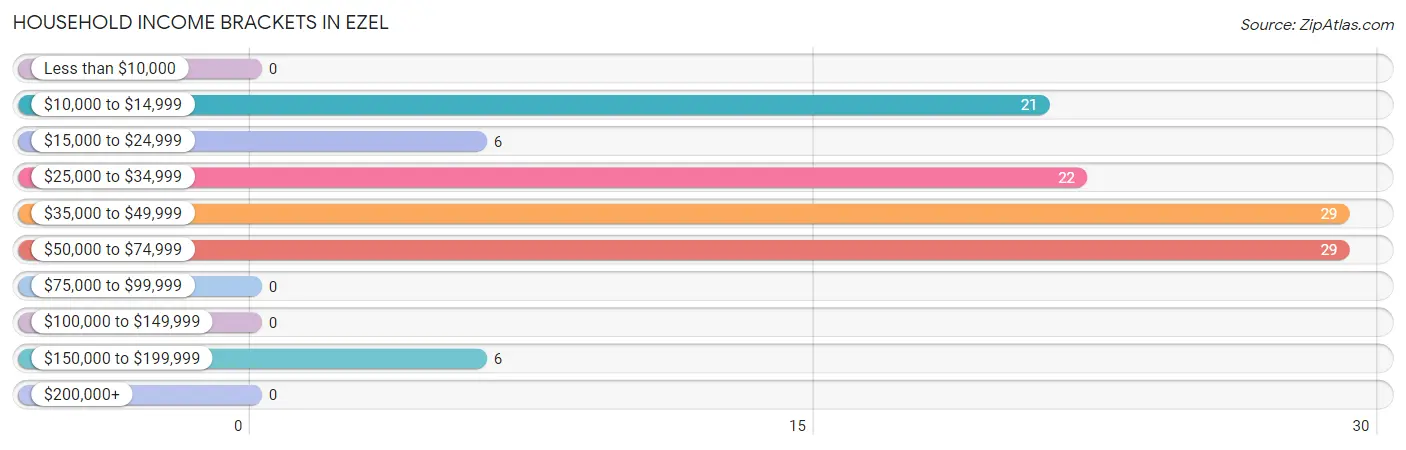
| Income Bracket | # Households | % Households |
| Less than $10,000 | 0 | 0.0% |
| $10,000 to $14,999 | 21 | 18.6% |
| $15,000 to $24,999 | 6 | 5.3% |
| $25,000 to $34,999 | 22 | 19.5% |
| $35,000 to $49,999 | 29 | 25.7% |
| $50,000 to $74,999 | 29 | 25.7% |
| $75,000 to $99,999 | 0 | 0.0% |
| $100,000 to $149,999 | 0 | 0.0% |
| $150,000 to $199,999 | 6 | 5.3% |
| $200,000+ | 0 | 0.0% |
Household Income by Householder Age in Ezel
The median household income in Ezel is $37,850, with the highest median household income of $38,036 found in the 25 to 44 years age bracket for the primary householder. A total of 22 households (19.5%) fall into this category.
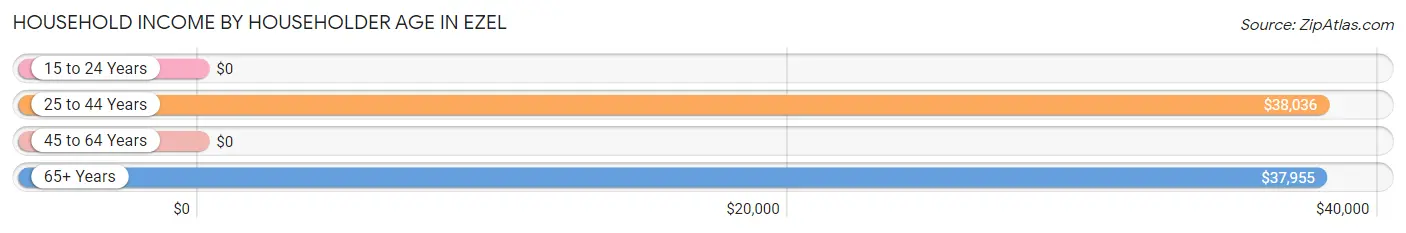
| Income Bracket | # Households | Median Income |
| 15 to 24 Years | 0 (0.0%) | $0 |
| 25 to 44 Years | 22 (19.5%) | $38,036 |
| 45 to 64 Years | 51 (45.1%) | $0 |
| 65+ Years | 40 (35.4%) | $37,955 |
| Total | 113 (100.0%) | $37,850 |
Poverty in Ezel
Income Below Poverty by Sex and Age in Ezel
With 7.8% poverty level for males and 14.6% for females among the residents of Ezel, 55 to 64 year old males and under 5 year old females are the most vulnerable to poverty, with 8 males (20.5%) and 4 females (80.0%) in their respective age groups living below the poverty level.
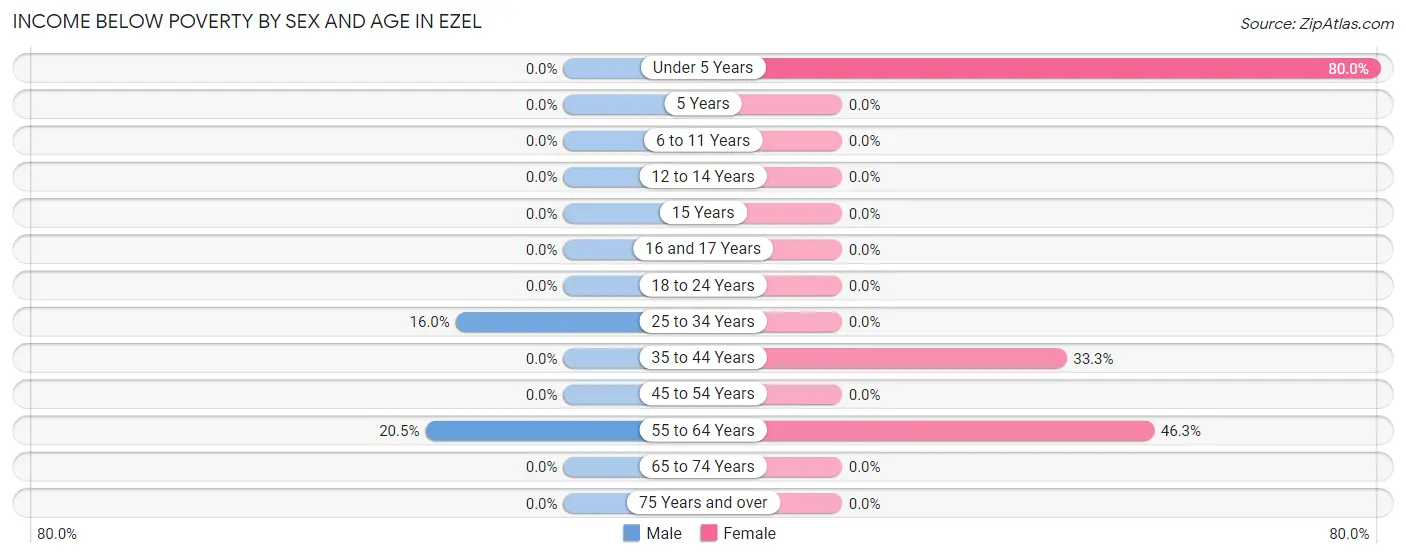
| Age Bracket | Male | Female |
| Under 5 Years | 0 (0.0%) | 4 (80.0%) |
| 5 Years | 0 (0.0%) | 0 (0.0%) |
| 6 to 11 Years | 0 (0.0%) | 0 (0.0%) |
| 12 to 14 Years | 0 (0.0%) | 0 (0.0%) |
| 15 Years | 0 (0.0%) | 0 (0.0%) |
| 16 and 17 Years | 0 (0.0%) | 0 (0.0%) |
| 18 to 24 Years | 0 (0.0%) | 0 (0.0%) |
| 25 to 34 Years | 4 (16.0%) | 0 (0.0%) |
| 35 to 44 Years | 0 (0.0%) | 2 (33.3%) |
| 45 to 54 Years | 0 (0.0%) | 0 (0.0%) |
| 55 to 64 Years | 8 (20.5%) | 19 (46.3%) |
| 65 to 74 Years | 0 (0.0%) | 0 (0.0%) |
| 75 Years and over | 0 (0.0%) | 0 (0.0%) |
| Total | 12 (7.8%) | 25 (14.6%) |
Income Above Poverty by Sex and Age in Ezel
According to the poverty statistics in Ezel, males aged 12 to 14 years and females aged 12 to 14 years are the age groups that are most secure financially, with 100.0% of males and 100.0% of females in these age groups living above the poverty line.
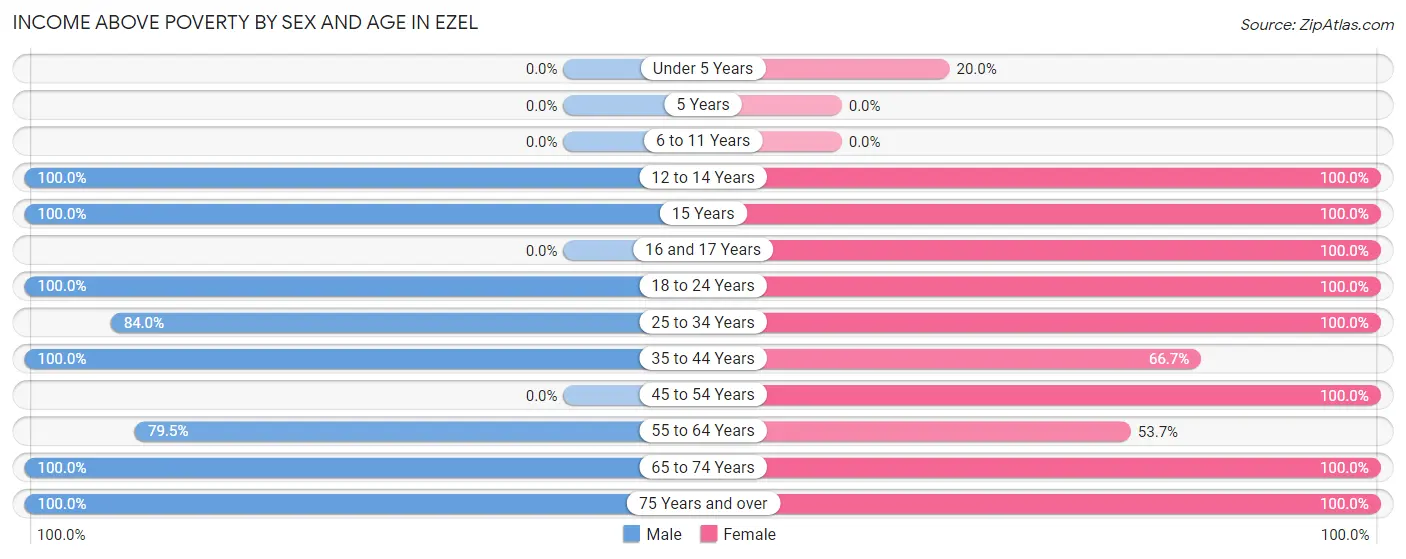
| Age Bracket | Male | Female |
| Under 5 Years | 0 (0.0%) | 1 (20.0%) |
| 5 Years | 0 (0.0%) | 0 (0.0%) |
| 6 to 11 Years | 0 (0.0%) | 0 (0.0%) |
| 12 to 14 Years | 21 (100.0%) | 5 (100.0%) |
| 15 Years | 2 (100.0%) | 14 (100.0%) |
| 16 and 17 Years | 0 (0.0%) | 21 (100.0%) |
| 18 to 24 Years | 7 (100.0%) | 5 (100.0%) |
| 25 to 34 Years | 21 (84.0%) | 28 (100.0%) |
| 35 to 44 Years | 18 (100.0%) | 4 (66.7%) |
| 45 to 54 Years | 0 (0.0%) | 8 (100.0%) |
| 55 to 64 Years | 31 (79.5%) | 22 (53.7%) |
| 65 to 74 Years | 23 (100.0%) | 21 (100.0%) |
| 75 Years and over | 19 (100.0%) | 17 (100.0%) |
| Total | 142 (92.2%) | 146 (85.4%) |
Income Below Poverty Among Married-Couple Families in Ezel
The poverty statistics for married-couple families in Ezel show that 12.0% or 12 of the total 100 families live below the poverty line. Families with 1 or 2 children have the highest poverty rate of 18.2%, comprising of 4 families. On the other hand, families with 3 or 4 children have the lowest poverty rate of 0.0%, which includes 0 families.
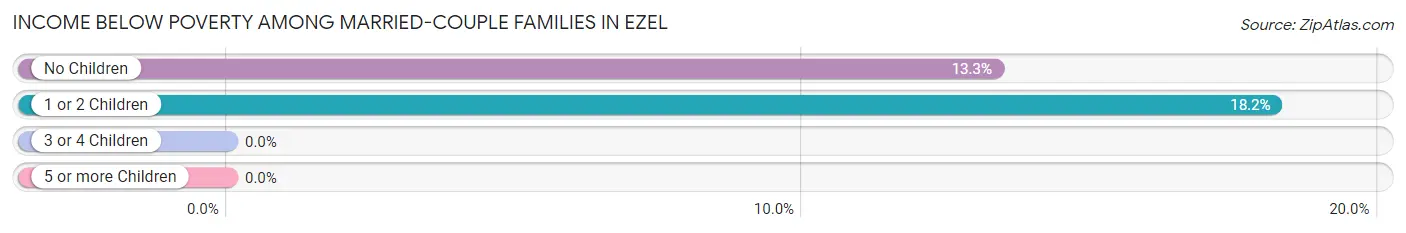
| Children | Above Poverty | Below Poverty |
| No Children | 52 (86.7%) | 8 (13.3%) |
| 1 or 2 Children | 18 (81.8%) | 4 (18.2%) |
| 3 or 4 Children | 18 (100.0%) | 0 (0.0%) |
| 5 or more Children | 0 (0.0%) | 0 (0.0%) |
| Total | 88 (88.0%) | 12 (12.0%) |
Income Below Poverty Among Single-Parent Households in Ezel
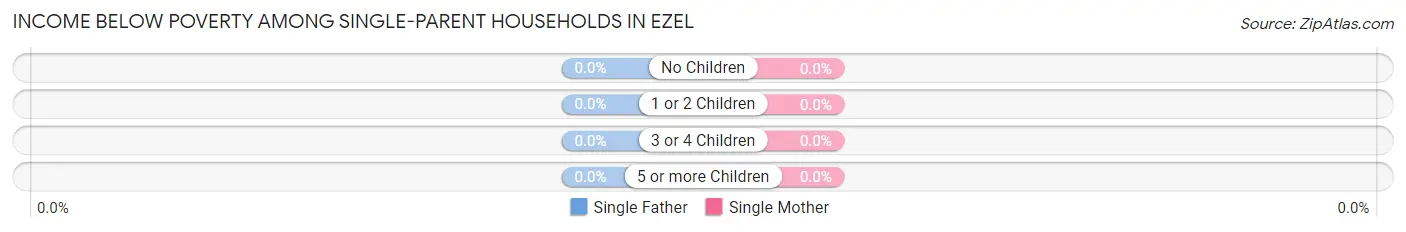
| Children | Single Father | Single Mother |
| No Children | 0 (0.0%) | 0 (0.0%) |
| 1 or 2 Children | 0 (0.0%) | 0 (0.0%) |
| 3 or 4 Children | 0 (0.0%) | 0 (0.0%) |
| 5 or more Children | 0 (0.0%) | 0 (0.0%) |
| Total | 0 (0.0%) | 0 (0.0%) |
Income Below Poverty Among Married-Couple vs Single-Parent Households in Ezel
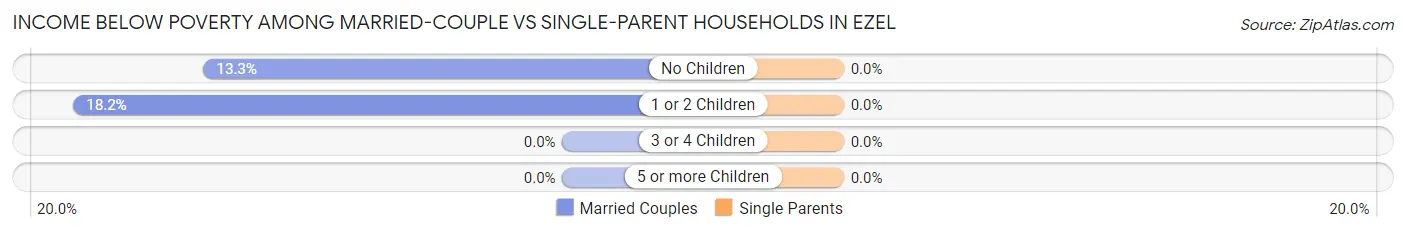
| Children | Married-Couple Families | Single-Parent Households |
| No Children | 8 (13.3%) | 0 (0.0%) |
| 1 or 2 Children | 4 (18.2%) | 0 (0.0%) |
| 3 or 4 Children | 0 (0.0%) | 0 (0.0%) |
| 5 or more Children | 0 (0.0%) | 0 (0.0%) |
| Total | 12 (12.0%) | 0 (0.0%) |
Race in Ezel
The most populous races in Ezel are White / Caucasian (283 | 87.1%), Hispanic or Latino (42 | 12.9%), and Some other Race (42 | 12.9%).
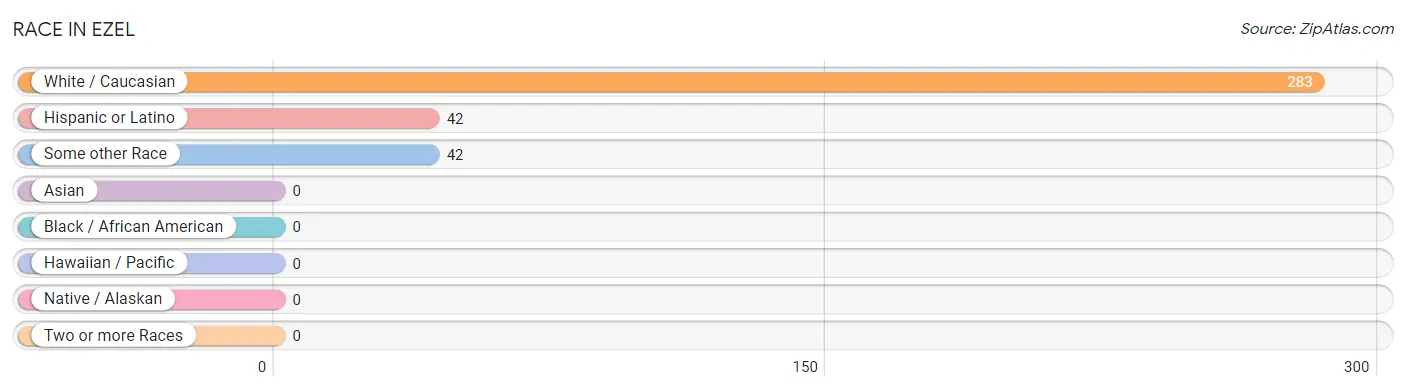
| Race | # Population | % Population |
| Asian | 0 | 0.0% |
| Black / African American | 0 | 0.0% |
| Hawaiian / Pacific | 0 | 0.0% |
| Hispanic or Latino | 42 | 12.9% |
| Native / Alaskan | 0 | 0.0% |
| White / Caucasian | 283 | 87.1% |
| Two or more Races | 0 | 0.0% |
| Some other Race | 42 | 12.9% |
| Total | 325 | 100.0% |
Ancestry in Ezel
The most populous ancestries reported in Ezel are American (87 | 26.8%), Mexican (42 | 12.9%), Irish (26 | 8.0%), German (17 | 5.2%), and Norwegian (16 | 4.9%), together accounting for 57.8% of all Ezel residents.
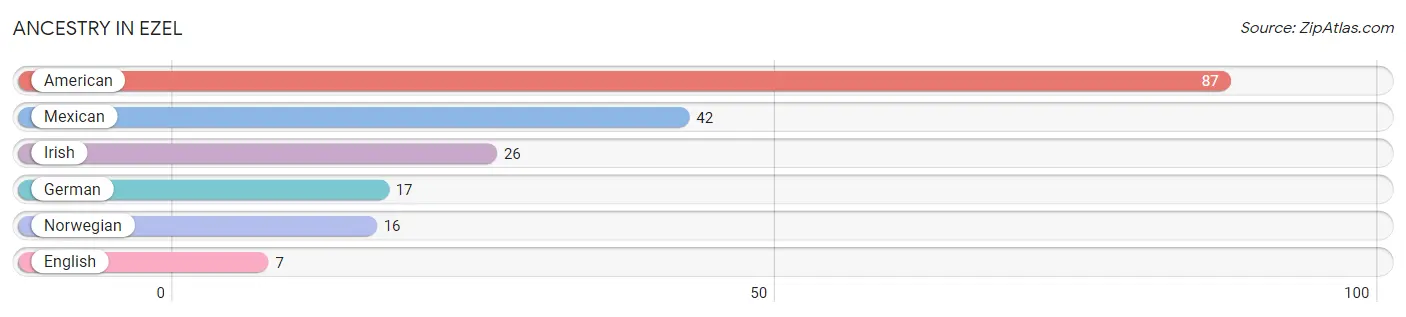
| Ancestry | # Population | % Population |
| American | 87 | 26.8% |
| English | 7 | 2.1% |
| German | 17 | 5.2% |
| Irish | 26 | 8.0% |
| Mexican | 42 | 12.9% |
| Norwegian | 16 | 4.9% | View All 6 Rows |
Immigrants in Ezel

| Immigration Origin | # Population | % Population | View All 0 Rows |
Sex and Age in Ezel
Sex and Age in Ezel
The most populous age groups in Ezel are 60 to 64 Years (31 | 20.1%) for men and 15 to 19 Years (40 | 23.4%) for women.
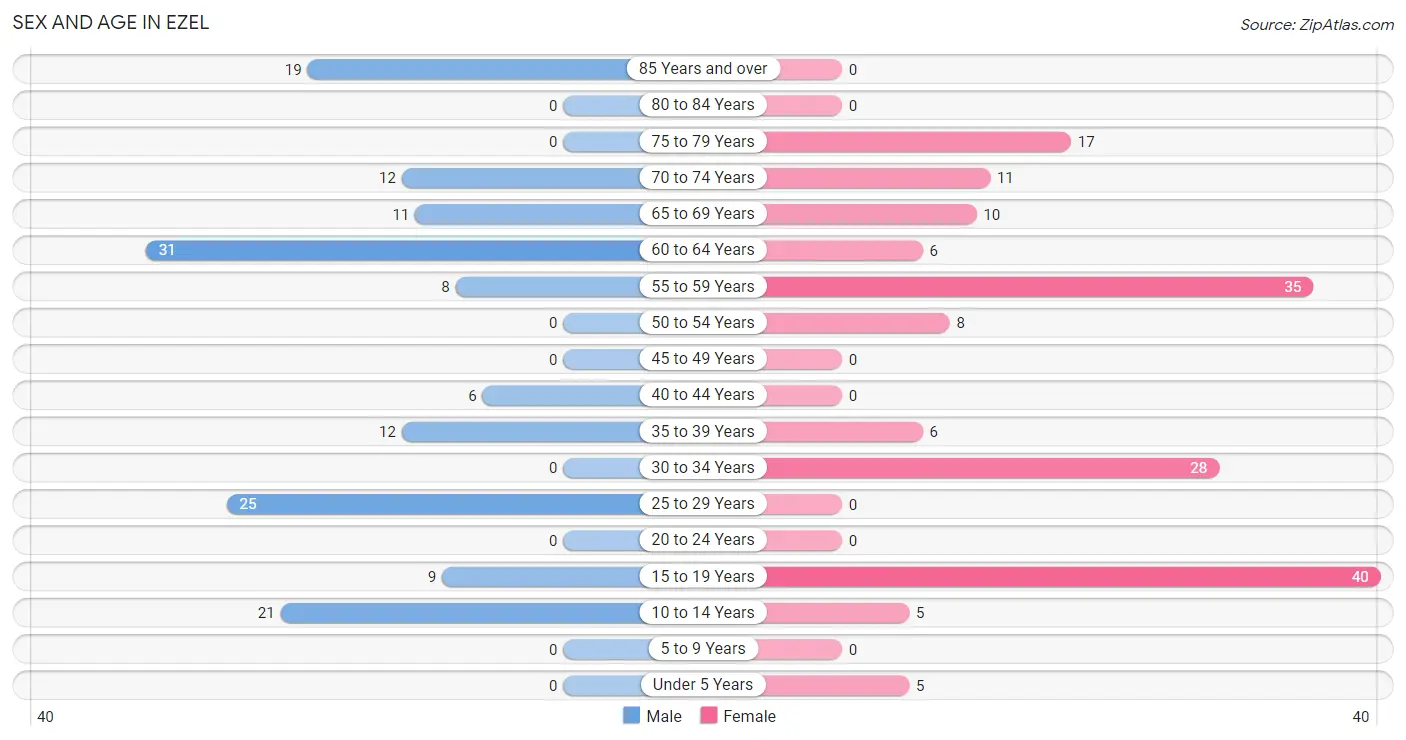
| Age Bracket | Male | Female |
| Under 5 Years | 0 (0.0%) | 5 (2.9%) |
| 5 to 9 Years | 0 (0.0%) | 0 (0.0%) |
| 10 to 14 Years | 21 (13.6%) | 5 (2.9%) |
| 15 to 19 Years | 9 (5.8%) | 40 (23.4%) |
| 20 to 24 Years | 0 (0.0%) | 0 (0.0%) |
| 25 to 29 Years | 25 (16.2%) | 0 (0.0%) |
| 30 to 34 Years | 0 (0.0%) | 28 (16.4%) |
| 35 to 39 Years | 12 (7.8%) | 6 (3.5%) |
| 40 to 44 Years | 6 (3.9%) | 0 (0.0%) |
| 45 to 49 Years | 0 (0.0%) | 0 (0.0%) |
| 50 to 54 Years | 0 (0.0%) | 8 (4.7%) |
| 55 to 59 Years | 8 (5.2%) | 35 (20.5%) |
| 60 to 64 Years | 31 (20.1%) | 6 (3.5%) |
| 65 to 69 Years | 11 (7.1%) | 10 (5.9%) |
| 70 to 74 Years | 12 (7.8%) | 11 (6.4%) |
| 75 to 79 Years | 0 (0.0%) | 17 (9.9%) |
| 80 to 84 Years | 0 (0.0%) | 0 (0.0%) |
| 85 Years and over | 19 (12.3%) | 0 (0.0%) |
| Total | 154 (100.0%) | 171 (100.0%) |
Families and Households in Ezel
Median Family Size in Ezel
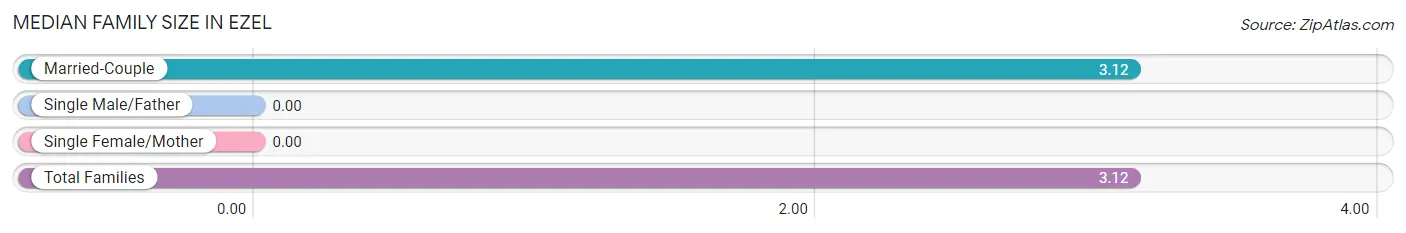
| Family Type | # Families | Family Size |
| Married-Couple | 100 (100.0%) | 3.12 |
| Single Male/Father | 0 (0.0%) | - |
| Single Female/Mother | 0 (0.0%) | - |
| Total Families | 100 (100.0%) | 3.12 |
Median Household Size in Ezel
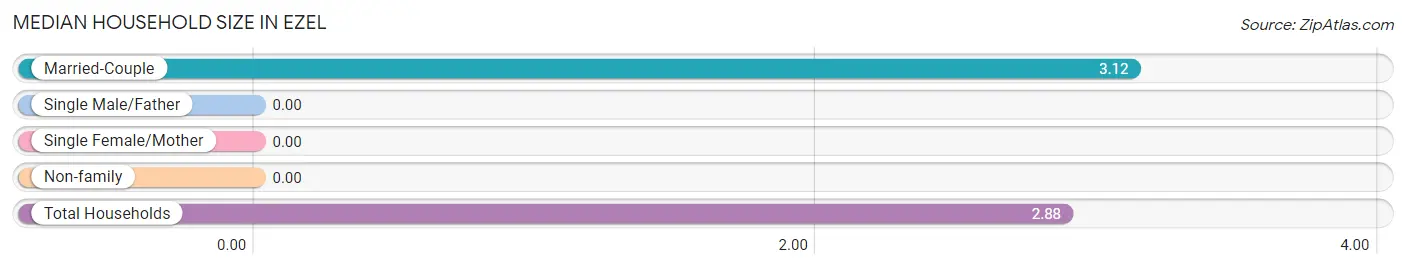
| Household Type | # Households | Household Size |
| Married-Couple | 100 (88.5%) | 3.12 |
| Single Male/Father | 0 (0.0%) | - |
| Single Female/Mother | 0 (0.0%) | - |
| Non-family | 13 (11.5%) | - |
| Total Households | 113 (100.0%) | 2.88 |
Household Size by Marriage Status in Ezel
Out of a total of 113 households in Ezel, 100 (88.5%) are family households, while 13 (11.5%) are nonfamily households. The most numerous type of family households are 2-person households, comprising 43, and the most common type of nonfamily households are 1-person households, comprising 13.
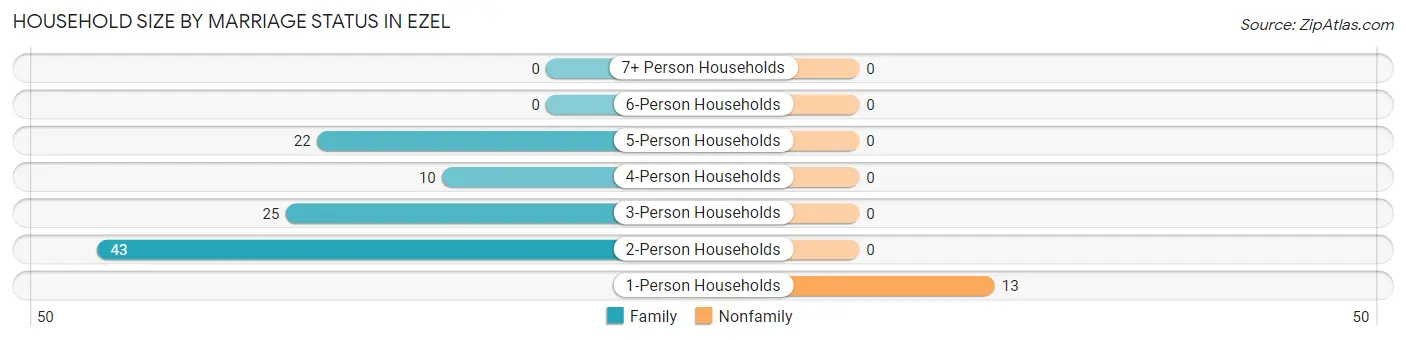
| Household Size | Family Households | Nonfamily Households |
| 1-Person Households | - | 13 (11.5%) |
| 2-Person Households | 43 (38.1%) | 0 (0.0%) |
| 3-Person Households | 25 (22.1%) | 0 (0.0%) |
| 4-Person Households | 10 (8.8%) | 0 (0.0%) |
| 5-Person Households | 22 (19.5%) | 0 (0.0%) |
| 6-Person Households | 0 (0.0%) | 0 (0.0%) |
| 7+ Person Households | 0 (0.0%) | 0 (0.0%) |
| Total | 100 (88.5%) | 13 (11.5%) |
Female Fertility in Ezel
Fertility by Age in Ezel
Average fertility rate in Ezel is 27.0 births per 1,000 women. Women in the age bracket of 35 to 50 years have the highest fertility rate with 333.0 births per 1,000 women. Women in the age bracket of 35 to 50 years acount for 100.0% of all women with births.
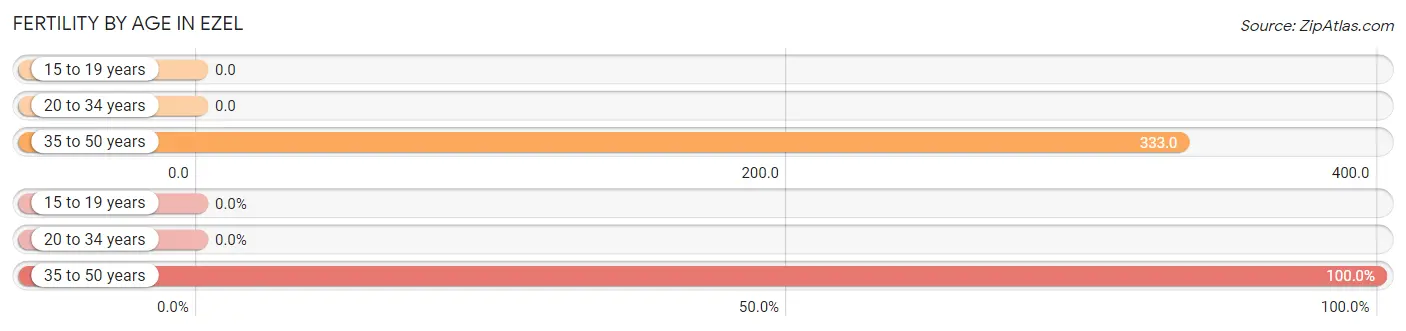
| Age Bracket | Women with Births | Births / 1,000 Women |
| 15 to 19 years | 0 (0.0%) | 0.0 |
| 20 to 34 years | 0 (0.0%) | 0.0 |
| 35 to 50 years | 2 (100.0%) | 333.0 |
| Total | 2 (100.0%) | 27.0 |
Fertility by Age by Marriage Status in Ezel
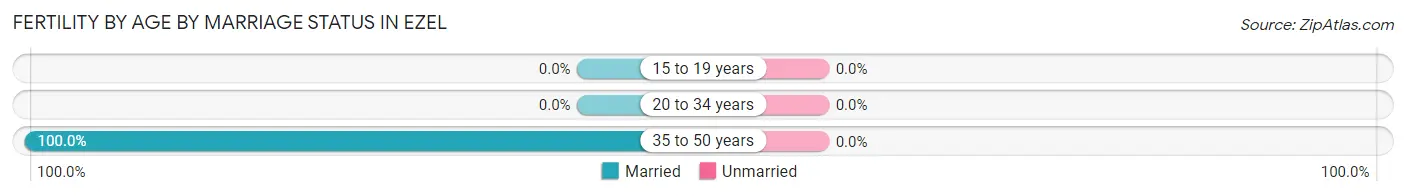
| Age Bracket | Married | Unmarried |
| 15 to 19 years | 0 (0.0%) | 0 (0.0%) |
| 20 to 34 years | 0 (0.0%) | 0 (0.0%) |
| 35 to 50 years | 2 (100.0%) | 0 (0.0%) |
| Total | 2 (100.0%) | 0 (0.0%) |
Fertility by Education in Ezel
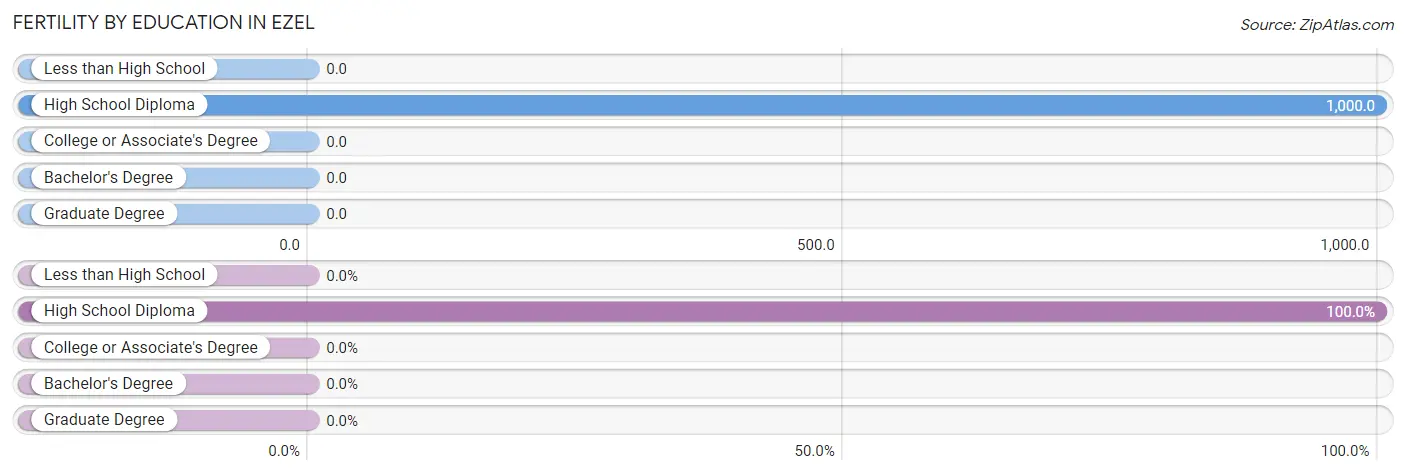
| Educational Attainment | Women with Births | Births / 1,000 Women |
| Less than High School | 0 (0.0%) | 0.0 |
| High School Diploma | 2 (100.0%) | 1,000.0 |
| College or Associate's Degree | 0 (0.0%) | 0.0 |
| Bachelor's Degree | 0 (0.0%) | 0.0 |
| Graduate Degree | 0 (0.0%) | 0.0 |
| Total | 2 (100.0%) | 27.0 |
Fertility by Education by Marriage Status in Ezel
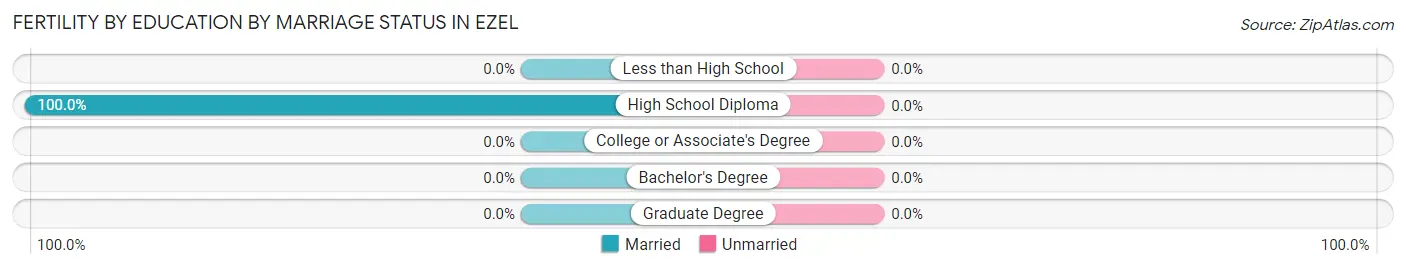
| Educational Attainment | Married | Unmarried |
| Less than High School | 0 (0.0%) | 0 (0.0%) |
| High School Diploma | 2 (100.0%) | 0 (0.0%) |
| College or Associate's Degree | 0 (0.0%) | 0 (0.0%) |
| Bachelor's Degree | 0 (0.0%) | 0 (0.0%) |
| Graduate Degree | 0 (0.0%) | 0 (0.0%) |
| Total | 2 (100.0%) | 0 (0.0%) |
Employment Characteristics in Ezel
Employment by Class of Employer in Ezel
Among the 79 employed individuals in Ezel, private company employees (46 | 58.2%), local government employees (26 | 32.9%), and self-employed (incorporated) (7 | 8.9%) make up the most common classes of employment.
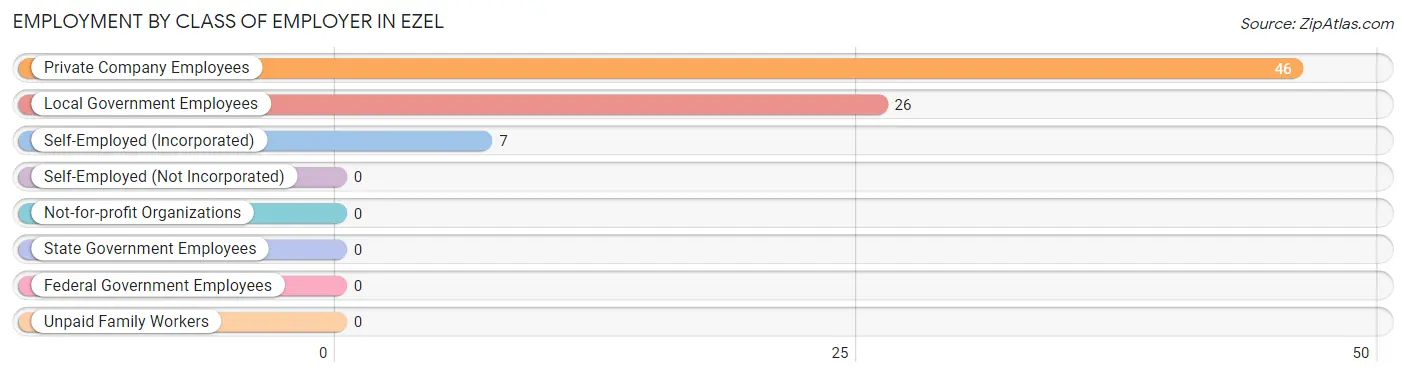
| Employer Class | # Employees | % Employees |
| Private Company Employees | 46 | 58.2% |
| Self-Employed (Incorporated) | 7 | 8.9% |
| Self-Employed (Not Incorporated) | 0 | 0.0% |
| Not-for-profit Organizations | 0 | 0.0% |
| Local Government Employees | 26 | 32.9% |
| State Government Employees | 0 | 0.0% |
| Federal Government Employees | 0 | 0.0% |
| Unpaid Family Workers | 0 | 0.0% |
| Total | 79 | 100.0% |
Employment Status by Age in Ezel
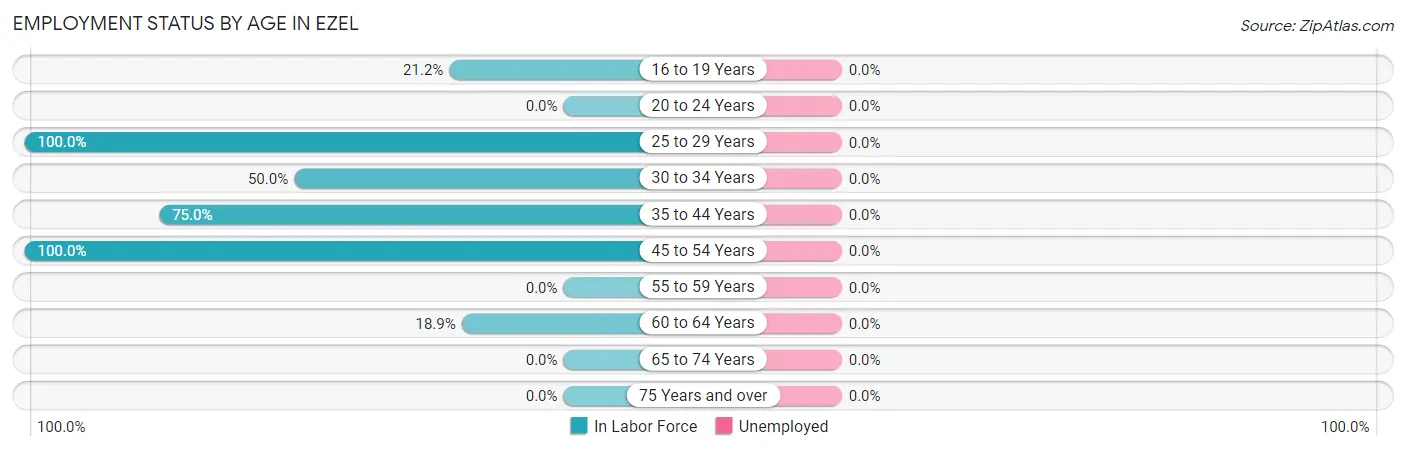
| Age Bracket | In Labor Force | Unemployed |
| 16 to 19 Years | 7 (21.2%) | 0 (0.0%) |
| 20 to 24 Years | 0 (0.0%) | 0 (0.0%) |
| 25 to 29 Years | 25 (100.0%) | 0 (0.0%) |
| 30 to 34 Years | 14 (50.0%) | 0 (0.0%) |
| 35 to 44 Years | 18 (75.0%) | 0 (0.0%) |
| 45 to 54 Years | 8 (100.0%) | 0 (0.0%) |
| 55 to 59 Years | 0 (0.0%) | 0 (0.0%) |
| 60 to 64 Years | 7 (18.9%) | 0 (0.0%) |
| 65 to 74 Years | 0 (0.0%) | 0 (0.0%) |
| 75 Years and over | 0 (0.0%) | 0 (0.0%) |
| Total | 79 (28.4%) | 0 (0.0%) |
Employment Status by Educational Attainment in Ezel
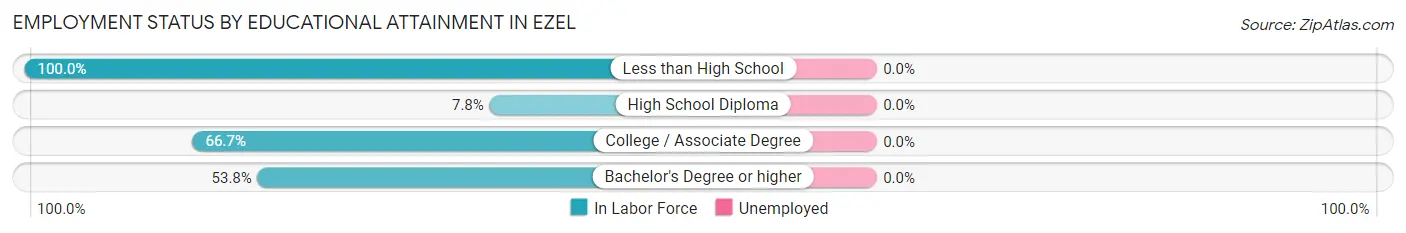
| Educational Attainment | In Labor Force | Unemployed |
| Less than High School | 6 (100.0%) | 0 (0.0%) |
| High School Diploma | 4 (7.8%) | 0 (0.0%) |
| College / Associate Degree | 20 (66.7%) | 0 (0.0%) |
| Bachelor's Degree or higher | 42 (53.8%) | 0 (0.0%) |
| Total | 72 (43.6%) | 0 (0.0%) |
Employment Occupations by Sex in Ezel
Management, Business, Science and Arts Occupations
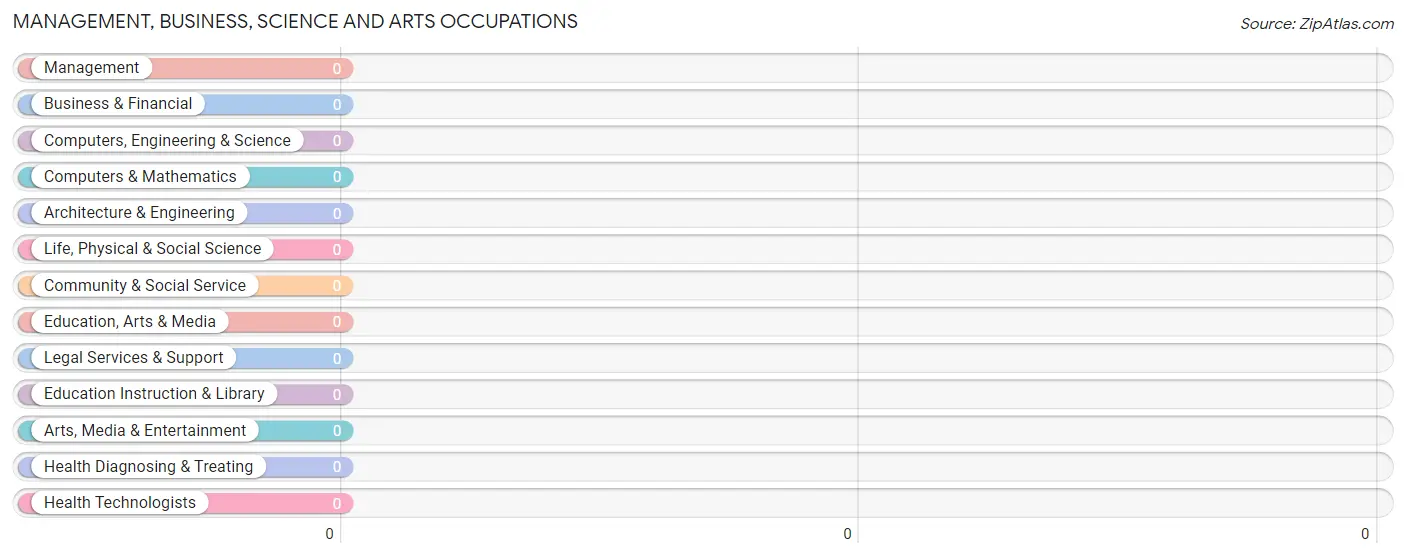
Management, Business, Science and Arts Occupations by Sex
| Occupation | Male | Female |
| Management | 0 (0.0%) | 0 (0.0%) |
| Business & Financial | 0 (0.0%) | 0 (0.0%) |
| Computers, Engineering & Science | 0 (0.0%) | 0 (0.0%) |
| Computers & Mathematics | 0 (0.0%) | 0 (0.0%) |
| Architecture & Engineering | 0 (0.0%) | 0 (0.0%) |
| Life, Physical & Social Science | 0 (0.0%) | 0 (0.0%) |
| Community & Social Service | 0 (0.0%) | 0 (0.0%) |
| Education, Arts & Media | 0 (0.0%) | 0 (0.0%) |
| Legal Services & Support | 0 (0.0%) | 0 (0.0%) |
| Education Instruction & Library | 0 (0.0%) | 0 (0.0%) |
| Arts, Media & Entertainment | 0 (0.0%) | 0 (0.0%) |
| Health Diagnosing & Treating | 0 (0.0%) | 0 (0.0%) |
| Health Technologists | 0 (0.0%) | 0 (0.0%) |
| Total (Category) | 0 (0.0%) | 0 (0.0%) |
| Total (Overall) | 57 (72.2%) | 22 (27.9%) |
Services Occupations
The most common Services occupations in Ezel are Personal Care & Service (21 | 26.6%), Food Preparation & Serving (14 | 17.7%), and Cleaning & Maintenance (12 | 15.2%).
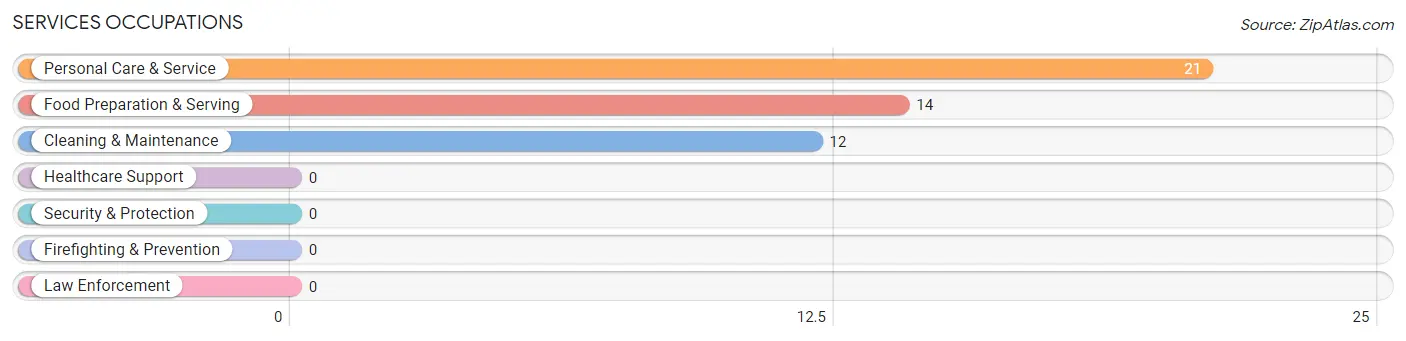
Services Occupations by Sex

| Occupation | Male | Female |
| Healthcare Support | 0 (0.0%) | 0 (0.0%) |
| Security & Protection | 0 (0.0%) | 0 (0.0%) |
| Firefighting & Prevention | 0 (0.0%) | 0 (0.0%) |
| Law Enforcement | 0 (0.0%) | 0 (0.0%) |
| Food Preparation & Serving | 0 (0.0%) | 14 (100.0%) |
| Cleaning & Maintenance | 12 (100.0%) | 0 (0.0%) |
| Personal Care & Service | 21 (100.0%) | 0 (0.0%) |
| Total (Category) | 33 (70.2%) | 14 (29.8%) |
| Total (Overall) | 57 (72.2%) | 22 (27.9%) |
Sales and Office Occupations
Sales and Office Occupations by Sex
| Occupation | Male | Female |
| Sales & Related | 0 (0.0%) | 0 (0.0%) |
| Office & Administration | 0 (0.0%) | 0 (0.0%) |
| Total (Category) | 0 (0.0%) | 0 (0.0%) |
| Total (Overall) | 57 (72.2%) | 22 (27.9%) |
Natural Resources, Construction and Maintenance Occupations
The most common Natural Resources, Construction and Maintenance occupations in Ezel are Installation, Maintenance & Repair (7 | 8.9%), and Construction & Extraction (6 | 7.6%).
Natural Resources, Construction and Maintenance Occupations by Sex
| Occupation | Male | Female |
| Farming, Fishing & Forestry | 0 (0.0%) | 0 (0.0%) |
| Construction & Extraction | 6 (100.0%) | 0 (0.0%) |
| Installation, Maintenance & Repair | 7 (100.0%) | 0 (0.0%) |
| Total (Category) | 13 (100.0%) | 0 (0.0%) |
| Total (Overall) | 57 (72.2%) | 22 (27.9%) |
Production, Transportation and Moving Occupations
The most common Production, Transportation and Moving occupations in Ezel are , and Production (19 | 24.0%).
Production, Transportation and Moving Occupations by Sex
| Occupation | Male | Female |
| Production | 11 (57.9%) | 8 (42.1%) |
| Transportation | 0 (0.0%) | 0 (0.0%) |
| Material Moving | 0 (0.0%) | 0 (0.0%) |
| Total (Category) | 11 (57.9%) | 8 (42.1%) |
| Total (Overall) | 57 (72.2%) | 22 (27.9%) |
Employment Industries by Sex in Ezel
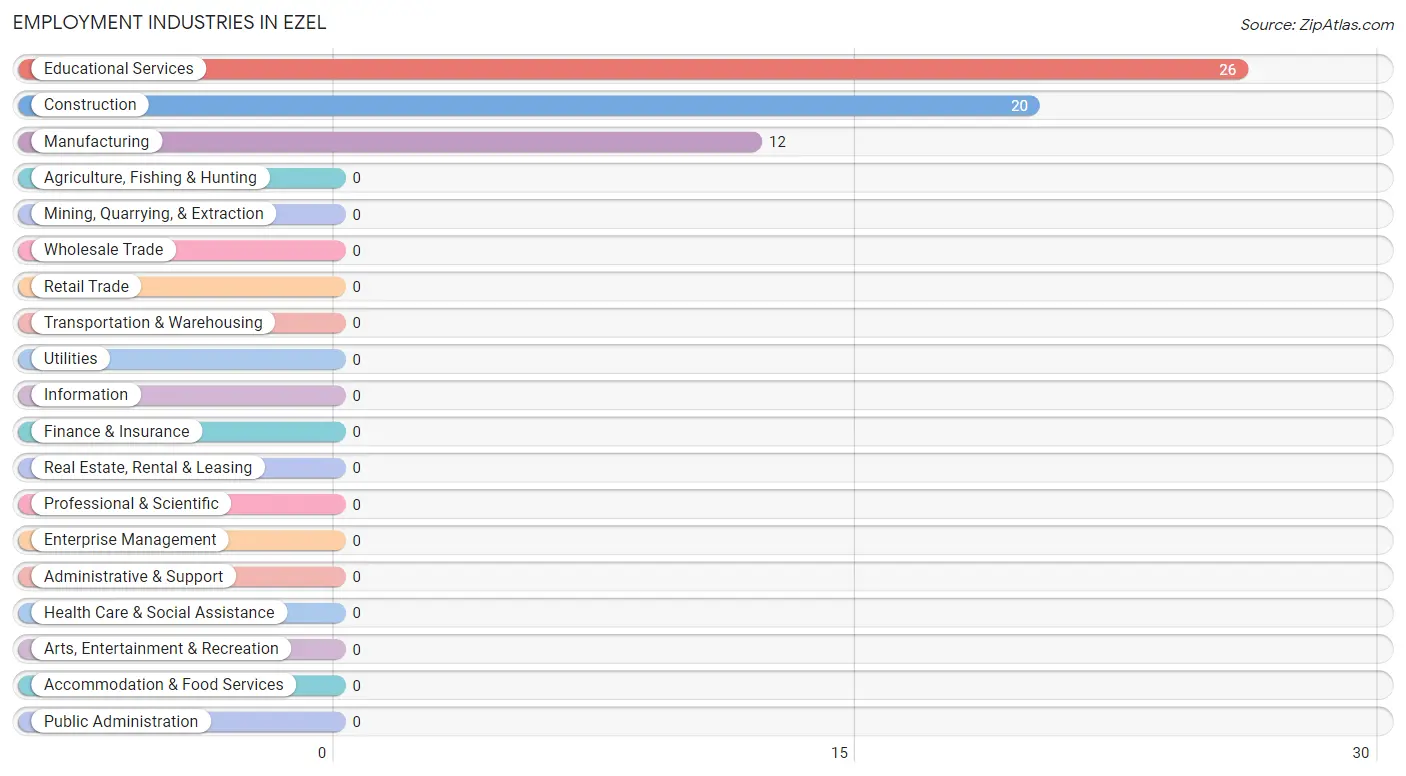
Employment Industries in Ezel
The major employment industries in Ezel include Educational Services (26 | 32.9%), Construction (20 | 25.3%), and Manufacturing (12 | 15.2%).
Employment Industries by Sex in Ezel
The Ezel industries that see more men than women are Construction (100.0%), Educational Services (46.2%), and Manufacturing (33.3%), whereas the industries that tend to have a higher number of women are Manufacturing (66.7%), and Educational Services (53.8%).
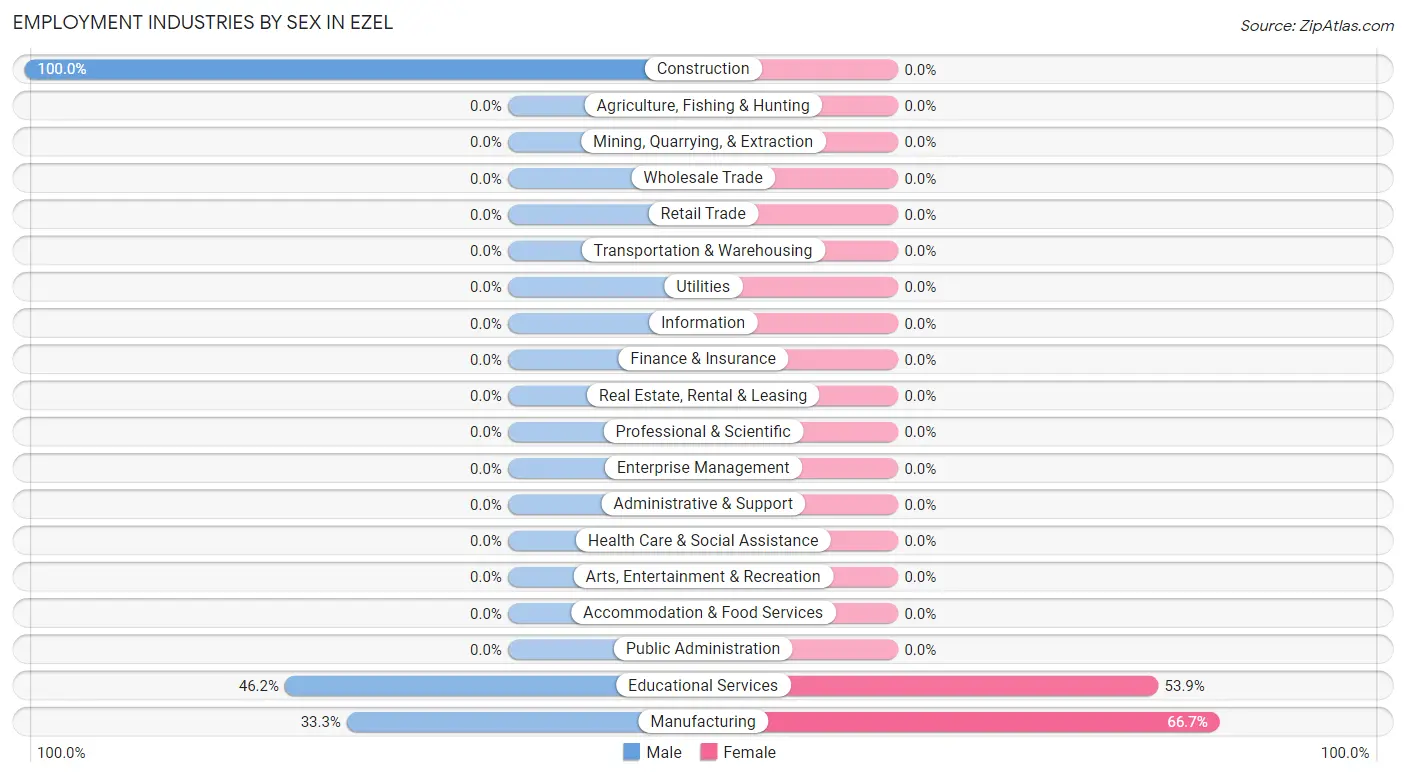
| Industry | Male | Female |
| Agriculture, Fishing & Hunting | 0 (0.0%) | 0 (0.0%) |
| Mining, Quarrying, & Extraction | 0 (0.0%) | 0 (0.0%) |
| Construction | 20 (100.0%) | 0 (0.0%) |
| Manufacturing | 4 (33.3%) | 8 (66.7%) |
| Wholesale Trade | 0 (0.0%) | 0 (0.0%) |
| Retail Trade | 0 (0.0%) | 0 (0.0%) |
| Transportation & Warehousing | 0 (0.0%) | 0 (0.0%) |
| Utilities | 0 (0.0%) | 0 (0.0%) |
| Information | 0 (0.0%) | 0 (0.0%) |
| Finance & Insurance | 0 (0.0%) | 0 (0.0%) |
| Real Estate, Rental & Leasing | 0 (0.0%) | 0 (0.0%) |
| Professional & Scientific | 0 (0.0%) | 0 (0.0%) |
| Enterprise Management | 0 (0.0%) | 0 (0.0%) |
| Administrative & Support | 0 (0.0%) | 0 (0.0%) |
| Educational Services | 12 (46.2%) | 14 (53.8%) |
| Health Care & Social Assistance | 0 (0.0%) | 0 (0.0%) |
| Arts, Entertainment & Recreation | 0 (0.0%) | 0 (0.0%) |
| Accommodation & Food Services | 0 (0.0%) | 0 (0.0%) |
| Public Administration | 0 (0.0%) | 0 (0.0%) |
| Total | 57 (72.2%) | 22 (27.9%) |
Education in Ezel
School Enrollment in Ezel
The most common levels of schooling among the 110 students in Ezel are middle school (47 | 42.7%), graduate / professional (35 | 31.8%), and high school (21 | 19.1%).
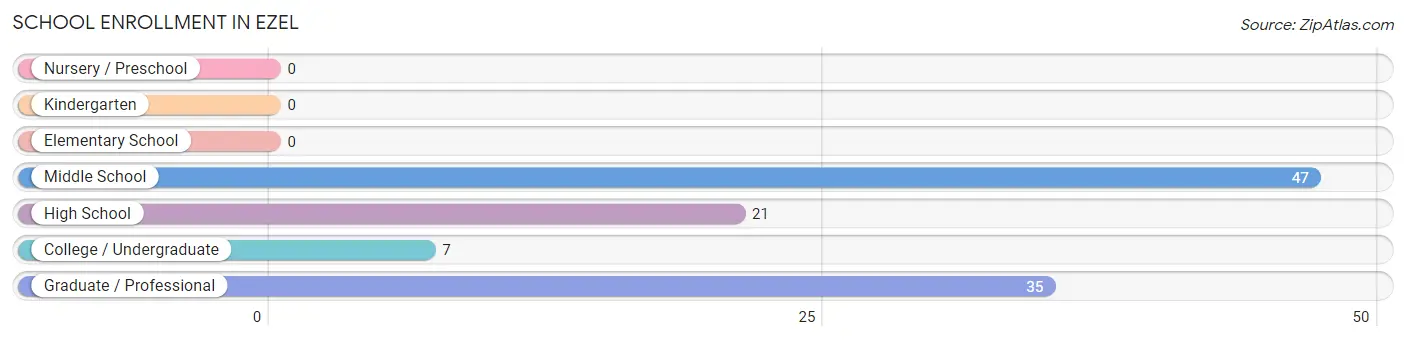
| School Level | # Students | % Students |
| Nursery / Preschool | 0 | 0.0% |
| Kindergarten | 0 | 0.0% |
| Elementary School | 0 | 0.0% |
| Middle School | 47 | 42.7% |
| High School | 21 | 19.1% |
| College / Undergraduate | 7 | 6.4% |
| Graduate / Professional | 35 | 31.8% |
| Total | 110 | 100.0% |
School Enrollment by Age by Funding Source in Ezel
Out of a total of 110 students who are enrolled in schools in Ezel, 35 (31.8%) attend a private institution, while the remaining 75 (68.2%) are enrolled in public schools. The age group of 25 to 34 year olds has the highest likelihood of being enrolled in private schools, with 35 (100.0% in the age bracket) enrolled. Conversely, the age group of 10 to 14 year olds has the lowest likelihood of being enrolled in a private school, with 26 (100.0% in the age bracket) attending a public institution.
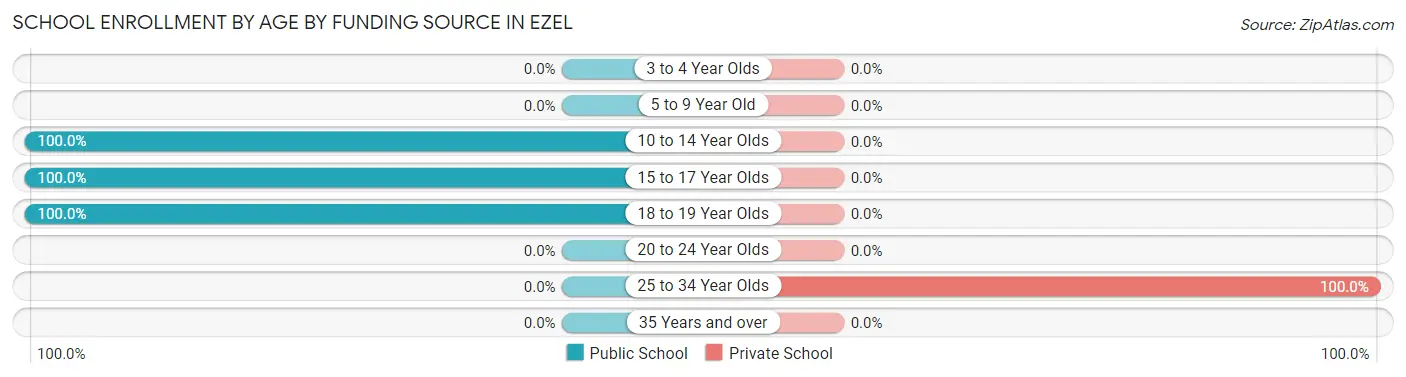
| Age Bracket | Public School | Private School |
| 3 to 4 Year Olds | 0 (0.0%) | 0 (0.0%) |
| 5 to 9 Year Old | 0 (0.0%) | 0 (0.0%) |
| 10 to 14 Year Olds | 26 (100.0%) | 0 (0.0%) |
| 15 to 17 Year Olds | 37 (100.0%) | 0 (0.0%) |
| 18 to 19 Year Olds | 12 (100.0%) | 0 (0.0%) |
| 20 to 24 Year Olds | 0 (0.0%) | 0 (0.0%) |
| 25 to 34 Year Olds | 0 (0.0%) | 35 (100.0%) |
| 35 Years and over | 0 (0.0%) | 0 (0.0%) |
| Total | 75 (68.2%) | 35 (31.8%) |
Educational Attainment by Field of Study in Ezel
Education (43 | 55.1%), bio, nature & agricultural (14 | 17.9%), literature & languages (14 | 17.9%), and science & technology (7 | 9.0%) are the most common fields of study among 78 individuals in Ezel who have obtained a bachelor's degree or higher.
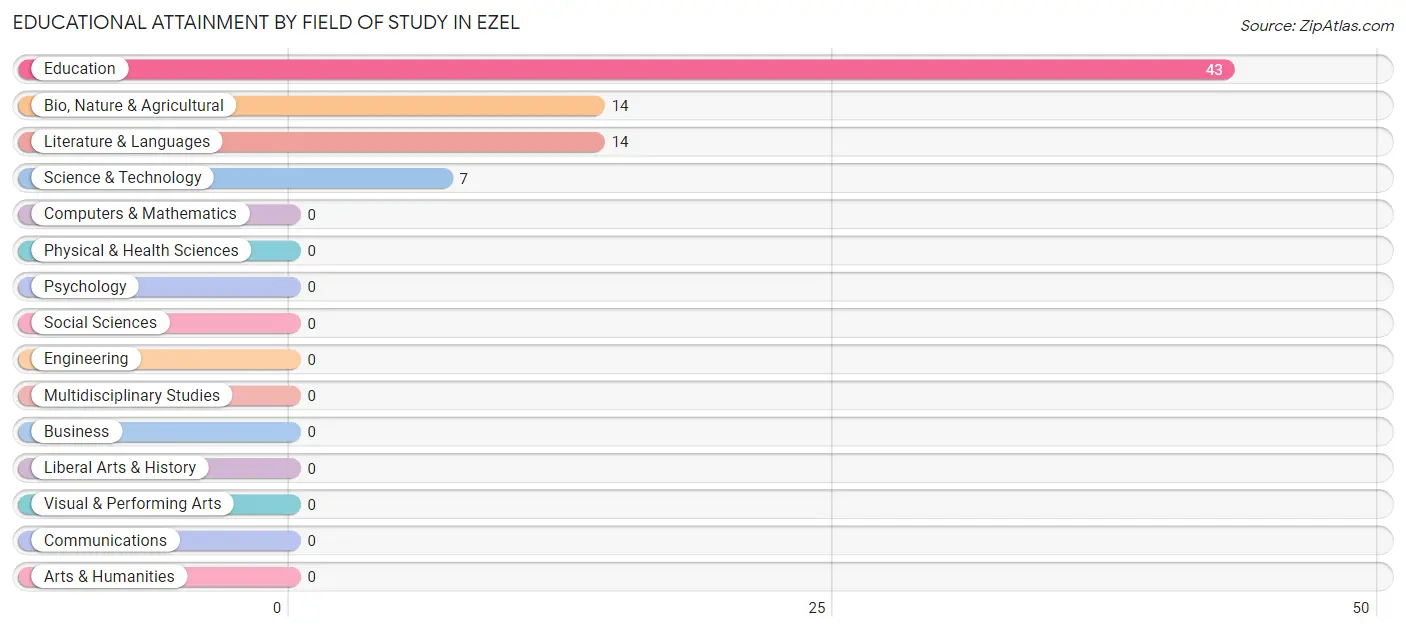
| Field of Study | # Graduates | % Graduates |
| Computers & Mathematics | 0 | 0.0% |
| Bio, Nature & Agricultural | 14 | 17.9% |
| Physical & Health Sciences | 0 | 0.0% |
| Psychology | 0 | 0.0% |
| Social Sciences | 0 | 0.0% |
| Engineering | 0 | 0.0% |
| Multidisciplinary Studies | 0 | 0.0% |
| Science & Technology | 7 | 9.0% |
| Business | 0 | 0.0% |
| Education | 43 | 55.1% |
| Literature & Languages | 14 | 17.9% |
| Liberal Arts & History | 0 | 0.0% |
| Visual & Performing Arts | 0 | 0.0% |
| Communications | 0 | 0.0% |
| Arts & Humanities | 0 | 0.0% |
| Total | 78 | 100.0% |
Transportation & Commute in Ezel
Vehicle Availability by Sex in Ezel
The most prevalent vehicle ownership categories in Ezel are males with 5 or more vehicles (28, accounting for 49.1%) and females with 5 or more vehicles (0, making up 127.3%).
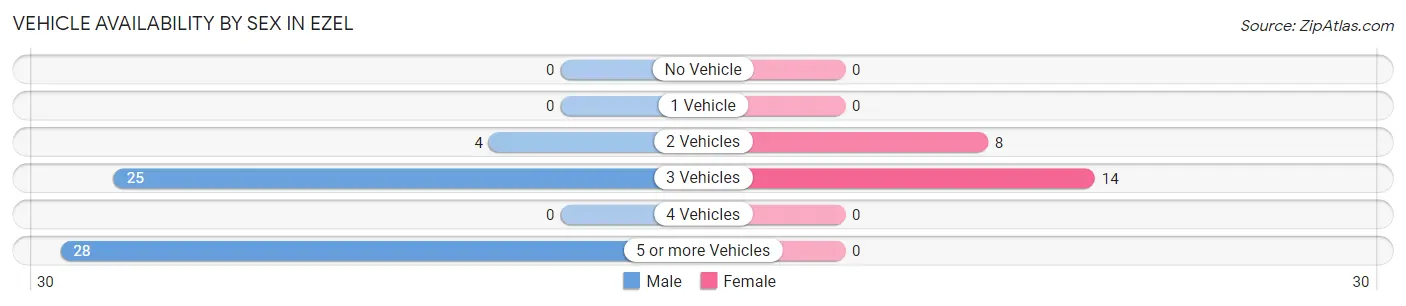
| Vehicles Available | Male | Female |
| No Vehicle | 0 (0.0%) | 0 (0.0%) |
| 1 Vehicle | 0 (0.0%) | 0 (0.0%) |
| 2 Vehicles | 4 (7.0%) | 8 (36.4%) |
| 3 Vehicles | 25 (43.9%) | 14 (63.6%) |
| 4 Vehicles | 0 (0.0%) | 0 (0.0%) |
| 5 or more Vehicles | 28 (49.1%) | 0 (0.0%) |
| Total | 57 (100.0%) | 22 (100.0%) |
Commute Time in Ezel
The most frequently occuring commute durations in Ezel are 15 to 19 minutes (28 commuters, 35.4%), 90 or more minutes (27 commuters, 34.2%), and less than 5 minutes (12 commuters, 15.2%).
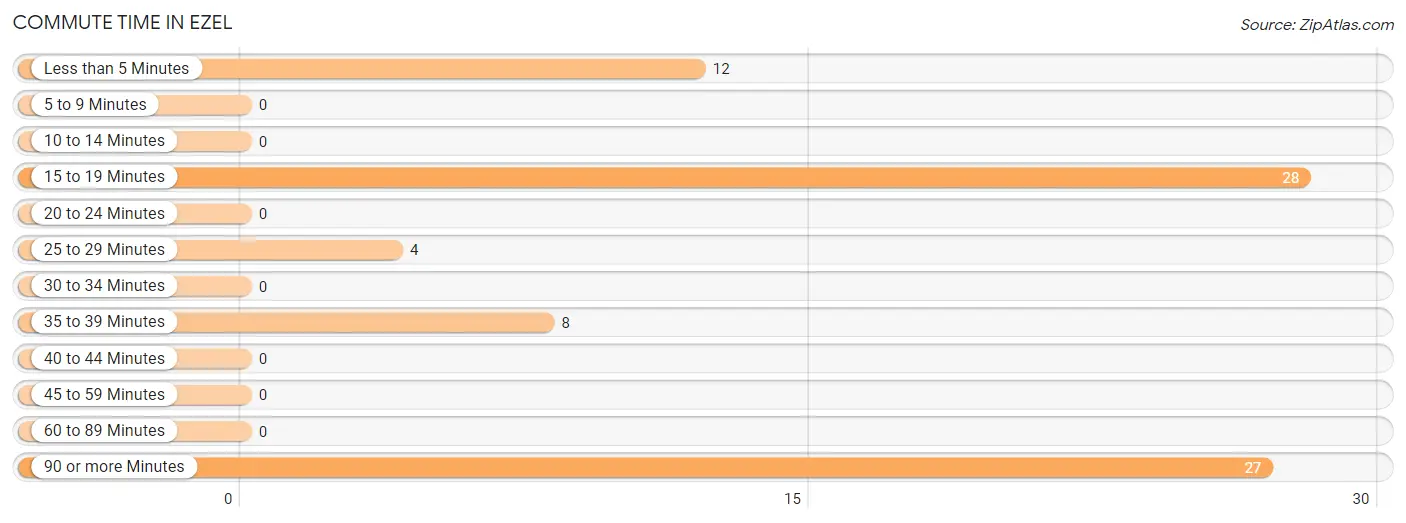
| Commute Time | # Commuters | % Commuters |
| Less than 5 Minutes | 12 | 15.2% |
| 5 to 9 Minutes | 0 | 0.0% |
| 10 to 14 Minutes | 0 | 0.0% |
| 15 to 19 Minutes | 28 | 35.4% |
| 20 to 24 Minutes | 0 | 0.0% |
| 25 to 29 Minutes | 4 | 5.1% |
| 30 to 34 Minutes | 0 | 0.0% |
| 35 to 39 Minutes | 8 | 10.1% |
| 40 to 44 Minutes | 0 | 0.0% |
| 45 to 59 Minutes | 0 | 0.0% |
| 60 to 89 Minutes | 0 | 0.0% |
| 90 or more Minutes | 27 | 34.2% |
Commute Time by Sex in Ezel
The most common commute times in Ezel are 90 or more minutes (27 commuters, 47.4%) for males and 15 to 19 minutes (14 commuters, 63.6%) for females.
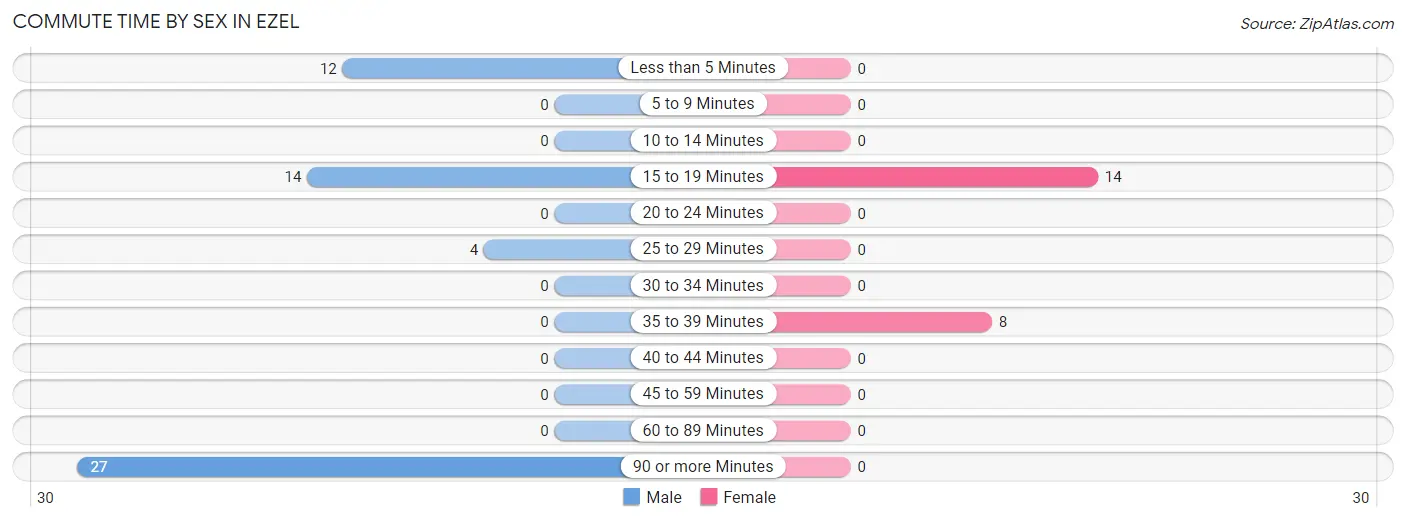
| Commute Time | Male | Female |
| Less than 5 Minutes | 12 (21.0%) | 0 (0.0%) |
| 5 to 9 Minutes | 0 (0.0%) | 0 (0.0%) |
| 10 to 14 Minutes | 0 (0.0%) | 0 (0.0%) |
| 15 to 19 Minutes | 14 (24.6%) | 14 (63.6%) |
| 20 to 24 Minutes | 0 (0.0%) | 0 (0.0%) |
| 25 to 29 Minutes | 4 (7.0%) | 0 (0.0%) |
| 30 to 34 Minutes | 0 (0.0%) | 0 (0.0%) |
| 35 to 39 Minutes | 0 (0.0%) | 8 (36.4%) |
| 40 to 44 Minutes | 0 (0.0%) | 0 (0.0%) |
| 45 to 59 Minutes | 0 (0.0%) | 0 (0.0%) |
| 60 to 89 Minutes | 0 (0.0%) | 0 (0.0%) |
| 90 or more Minutes | 27 (47.4%) | 0 (0.0%) |
Time of Departure to Work by Sex in Ezel
The most frequent times of departure to work in Ezel are 7:00 AM to 7:29 AM (28, 49.1%) for males and 8:00 AM to 8:29 AM (14, 63.6%) for females.
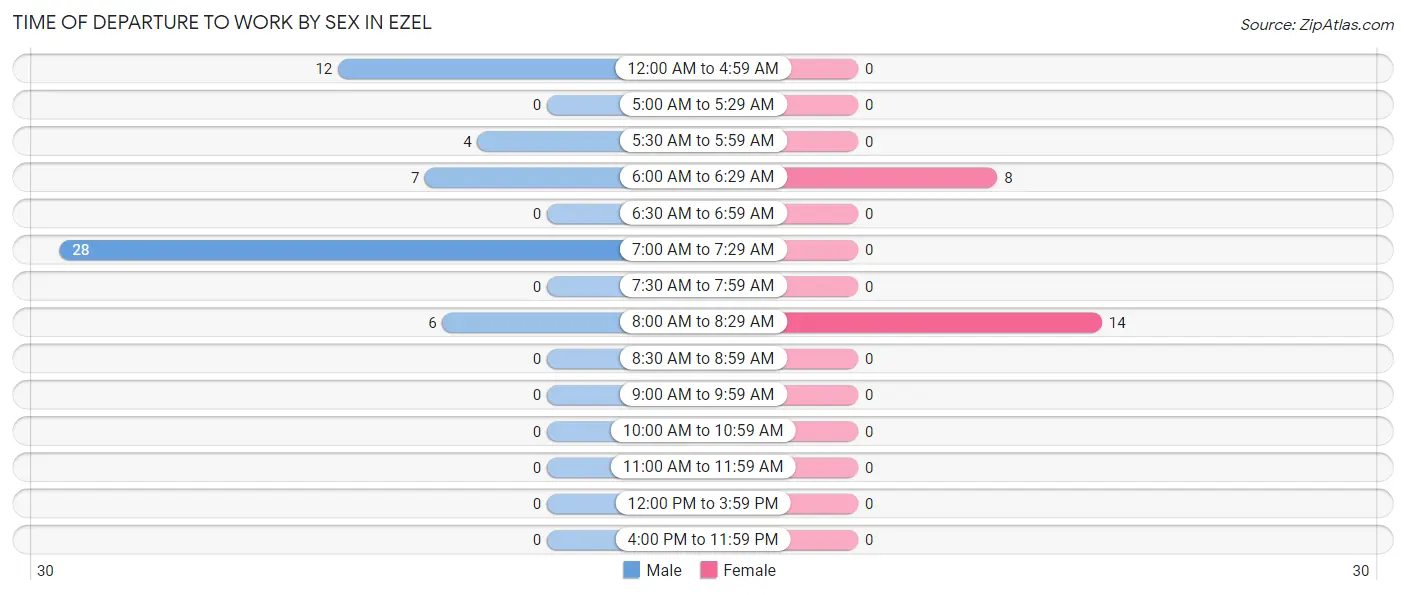
| Time of Departure | Male | Female |
| 12:00 AM to 4:59 AM | 12 (21.0%) | 0 (0.0%) |
| 5:00 AM to 5:29 AM | 0 (0.0%) | 0 (0.0%) |
| 5:30 AM to 5:59 AM | 4 (7.0%) | 0 (0.0%) |
| 6:00 AM to 6:29 AM | 7 (12.3%) | 8 (36.4%) |
| 6:30 AM to 6:59 AM | 0 (0.0%) | 0 (0.0%) |
| 7:00 AM to 7:29 AM | 28 (49.1%) | 0 (0.0%) |
| 7:30 AM to 7:59 AM | 0 (0.0%) | 0 (0.0%) |
| 8:00 AM to 8:29 AM | 6 (10.5%) | 14 (63.6%) |
| 8:30 AM to 8:59 AM | 0 (0.0%) | 0 (0.0%) |
| 9:00 AM to 9:59 AM | 0 (0.0%) | 0 (0.0%) |
| 10:00 AM to 10:59 AM | 0 (0.0%) | 0 (0.0%) |
| 11:00 AM to 11:59 AM | 0 (0.0%) | 0 (0.0%) |
| 12:00 PM to 3:59 PM | 0 (0.0%) | 0 (0.0%) |
| 4:00 PM to 11:59 PM | 0 (0.0%) | 0 (0.0%) |
| Total | 57 (100.0%) | 22 (100.0%) |
Housing Occupancy in Ezel
Occupancy by Ownership in Ezel
Of the total 113 dwellings in Ezel, owner-occupied units account for 96 (85.0%), while renter-occupied units make up 17 (15.0%).
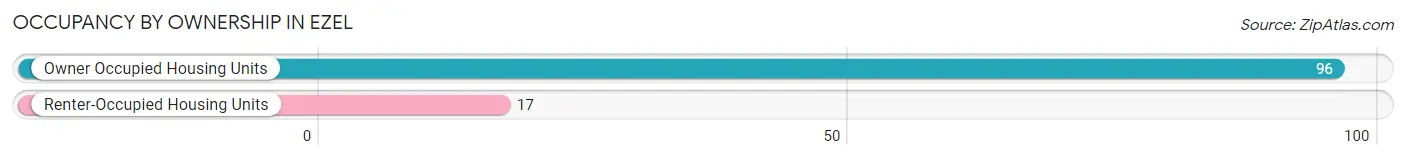
| Occupancy | # Housing Units | % Housing Units |
| Owner Occupied Housing Units | 96 | 85.0% |
| Renter-Occupied Housing Units | 17 | 15.0% |
| Total Occupied Housing Units | 113 | 100.0% |
Occupancy by Household Size in Ezel
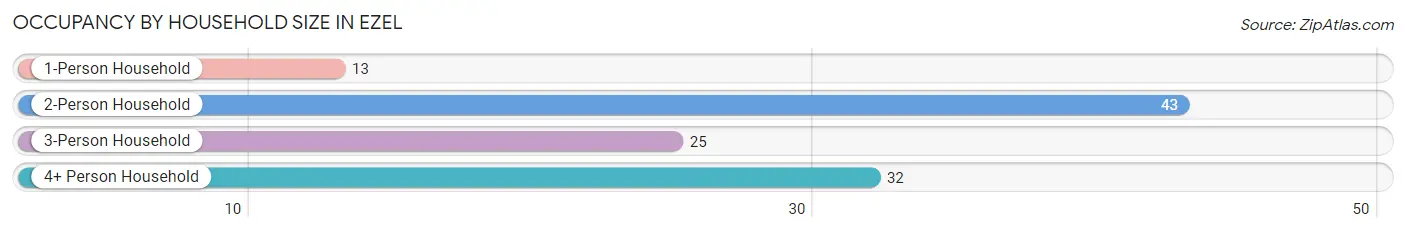
| Household Size | # Housing Units | % Housing Units |
| 1-Person Household | 13 | 11.5% |
| 2-Person Household | 43 | 38.1% |
| 3-Person Household | 25 | 22.1% |
| 4+ Person Household | 32 | 28.3% |
| Total Housing Units | 113 | 100.0% |
Occupancy by Ownership by Household Size in Ezel
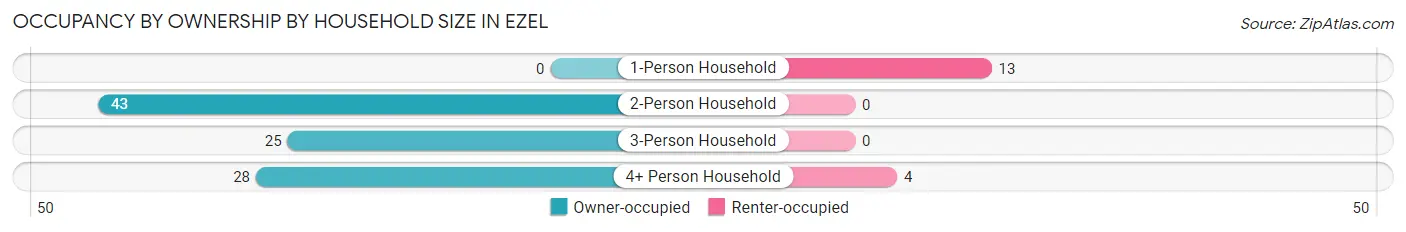
| Household Size | Owner-occupied | Renter-occupied |
| 1-Person Household | 0 (0.0%) | 13 (100.0%) |
| 2-Person Household | 43 (100.0%) | 0 (0.0%) |
| 3-Person Household | 25 (100.0%) | 0 (0.0%) |
| 4+ Person Household | 28 (87.5%) | 4 (12.5%) |
| Total Housing Units | 96 (85.0%) | 17 (15.0%) |
Occupancy by Educational Attainment in Ezel
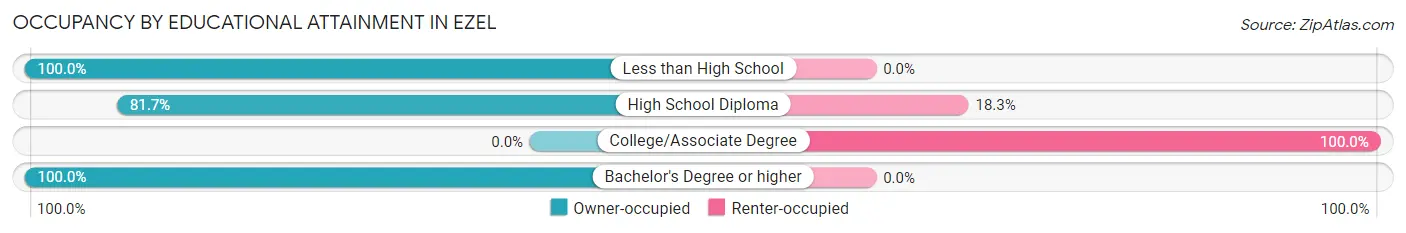
| Household Size | Owner-occupied | Renter-occupied |
| Less than High School | 18 (100.0%) | 0 (0.0%) |
| High School Diploma | 58 (81.7%) | 13 (18.3%) |
| College/Associate Degree | 0 (0.0%) | 4 (100.0%) |
| Bachelor's Degree or higher | 20 (100.0%) | 0 (0.0%) |
Occupancy by Age of Householder in Ezel
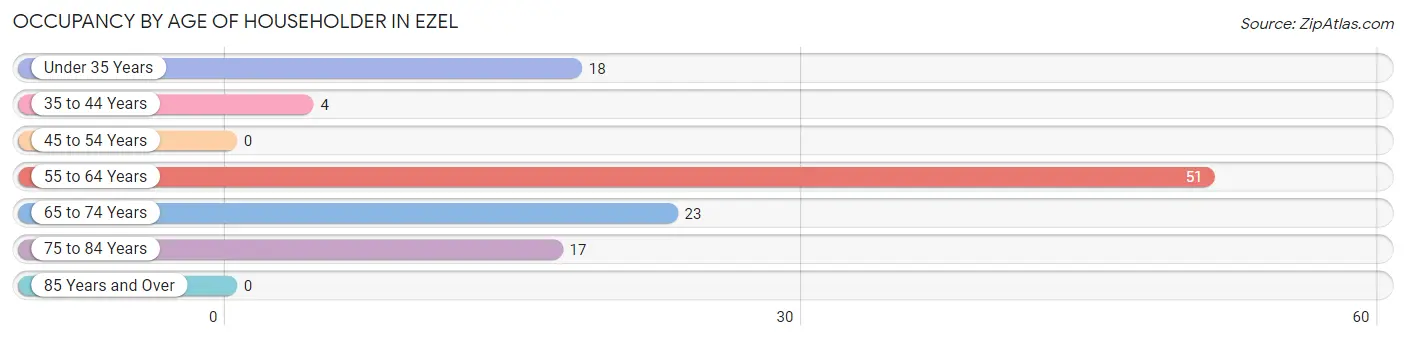
| Age Bracket | # Households | % Households |
| Under 35 Years | 18 | 15.9% |
| 35 to 44 Years | 4 | 3.5% |
| 45 to 54 Years | 0 | 0.0% |
| 55 to 64 Years | 51 | 45.1% |
| 65 to 74 Years | 23 | 20.3% |
| 75 to 84 Years | 17 | 15.0% |
| 85 Years and Over | 0 | 0.0% |
| Total | 113 | 100.0% |
Housing Finances in Ezel
Median Income by Occupancy in Ezel
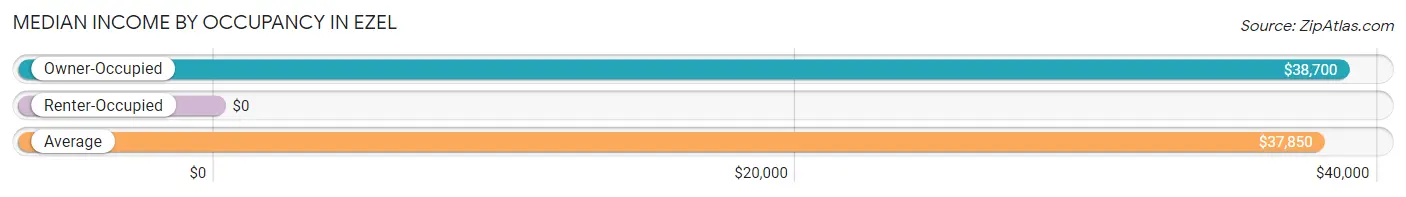
| Occupancy Type | # Households | Median Income |
| Owner-Occupied | 96 (85.0%) | $38,700 |
| Renter-Occupied | 17 (15.0%) | $0 |
| Average | 113 (100.0%) | $37,850 |
Occupancy by Householder Income Bracket in Ezel
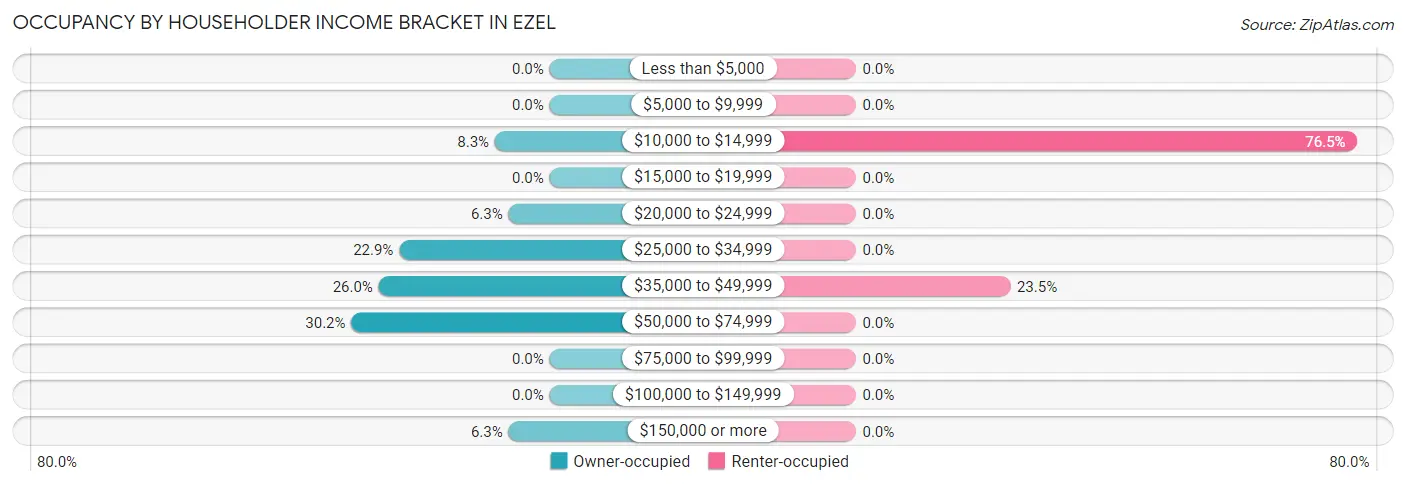
| Income Bracket | Owner-occupied | Renter-occupied |
| Less than $5,000 | 0 (0.0%) | 0 (0.0%) |
| $5,000 to $9,999 | 0 (0.0%) | 0 (0.0%) |
| $10,000 to $14,999 | 8 (8.3%) | 13 (76.5%) |
| $15,000 to $19,999 | 0 (0.0%) | 0 (0.0%) |
| $20,000 to $24,999 | 6 (6.2%) | 0 (0.0%) |
| $25,000 to $34,999 | 22 (22.9%) | 0 (0.0%) |
| $35,000 to $49,999 | 25 (26.0%) | 4 (23.5%) |
| $50,000 to $74,999 | 29 (30.2%) | 0 (0.0%) |
| $75,000 to $99,999 | 0 (0.0%) | 0 (0.0%) |
| $100,000 to $149,999 | 0 (0.0%) | 0 (0.0%) |
| $150,000 or more | 6 (6.2%) | 0 (0.0%) |
| Total | 96 (100.0%) | 17 (100.0%) |
Monthly Housing Cost Tiers in Ezel
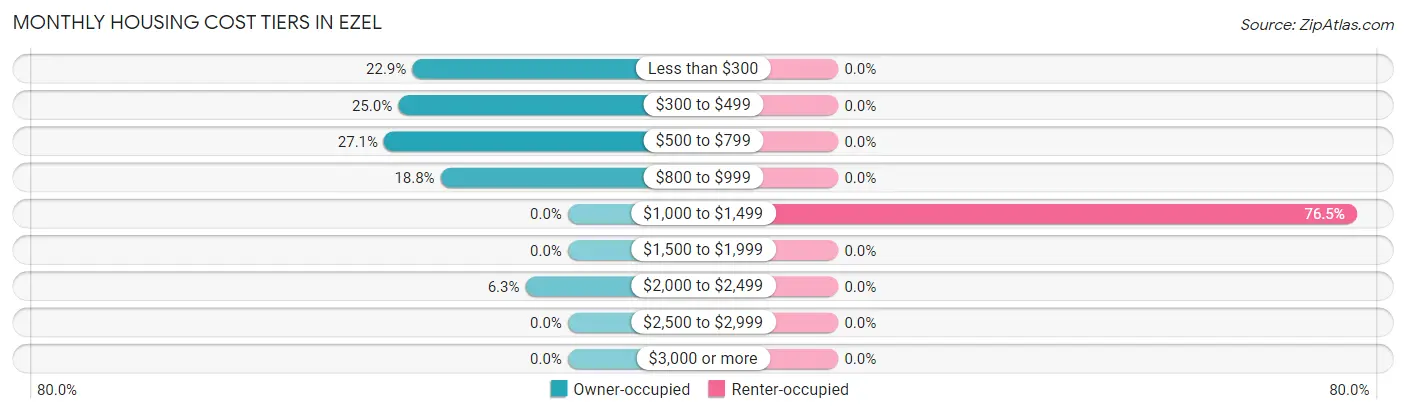
| Monthly Cost | Owner-occupied | Renter-occupied |
| Less than $300 | 22 (22.9%) | 0 (0.0%) |
| $300 to $499 | 24 (25.0%) | 0 (0.0%) |
| $500 to $799 | 26 (27.1%) | 0 (0.0%) |
| $800 to $999 | 18 (18.8%) | 0 (0.0%) |
| $1,000 to $1,499 | 0 (0.0%) | 13 (76.5%) |
| $1,500 to $1,999 | 0 (0.0%) | 0 (0.0%) |
| $2,000 to $2,499 | 6 (6.2%) | 0 (0.0%) |
| $2,500 to $2,999 | 0 (0.0%) | 0 (0.0%) |
| $3,000 or more | 0 (0.0%) | 0 (0.0%) |
| Total | 96 (100.0%) | 17 (100.0%) |
Physical Housing Characteristics in Ezel
Housing Structures in Ezel
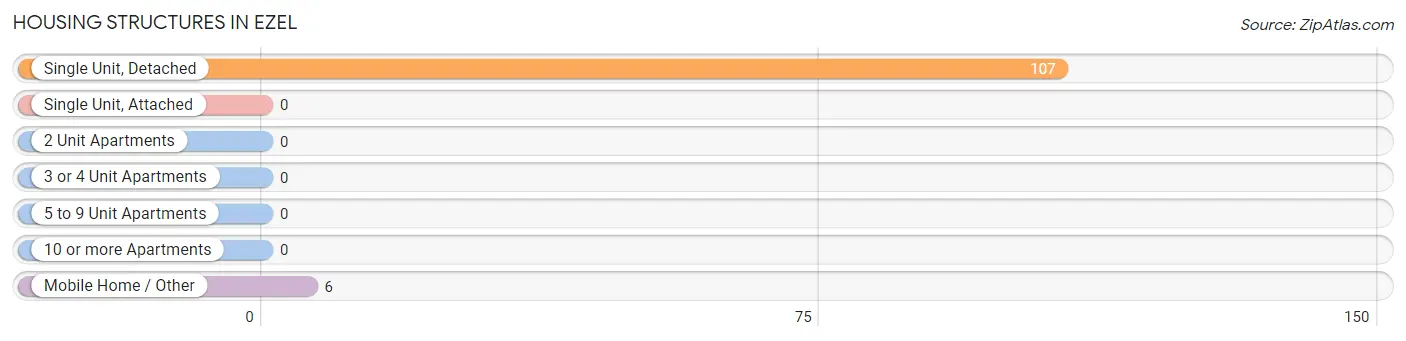
| Structure Type | # Housing Units | % Housing Units |
| Single Unit, Detached | 107 | 94.7% |
| Single Unit, Attached | 0 | 0.0% |
| 2 Unit Apartments | 0 | 0.0% |
| 3 or 4 Unit Apartments | 0 | 0.0% |
| 5 to 9 Unit Apartments | 0 | 0.0% |
| 10 or more Apartments | 0 | 0.0% |
| Mobile Home / Other | 6 | 5.3% |
| Total | 113 | 100.0% |
Housing Structures by Occupancy in Ezel
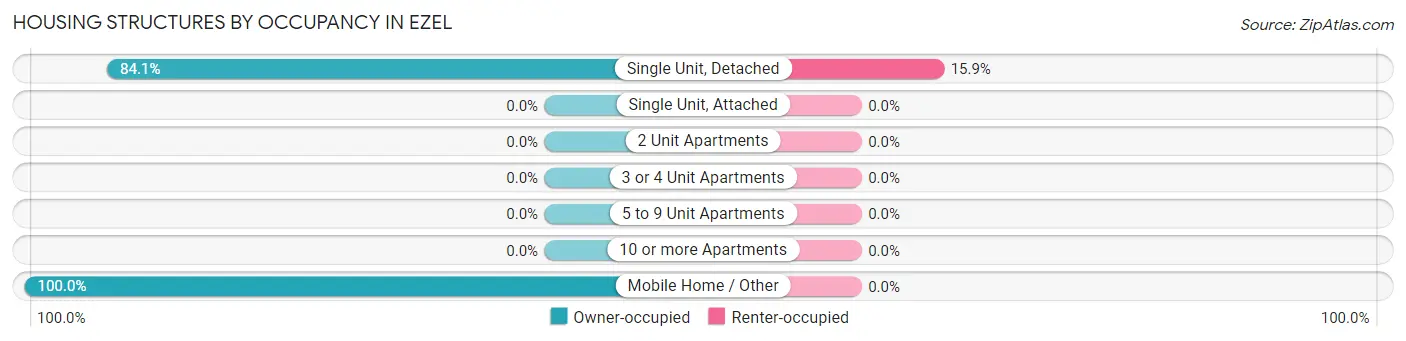
| Structure Type | Owner-occupied | Renter-occupied |
| Single Unit, Detached | 90 (84.1%) | 17 (15.9%) |
| Single Unit, Attached | 0 (0.0%) | 0 (0.0%) |
| 2 Unit Apartments | 0 (0.0%) | 0 (0.0%) |
| 3 or 4 Unit Apartments | 0 (0.0%) | 0 (0.0%) |
| 5 to 9 Unit Apartments | 0 (0.0%) | 0 (0.0%) |
| 10 or more Apartments | 0 (0.0%) | 0 (0.0%) |
| Mobile Home / Other | 6 (100.0%) | 0 (0.0%) |
| Total | 96 (85.0%) | 17 (15.0%) |
Housing Structures by Number of Rooms in Ezel
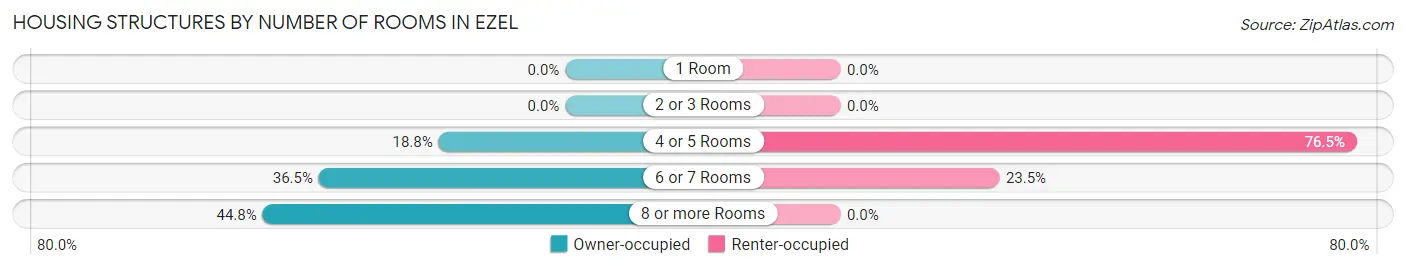
| Number of Rooms | Owner-occupied | Renter-occupied |
| 1 Room | 0 (0.0%) | 0 (0.0%) |
| 2 or 3 Rooms | 0 (0.0%) | 0 (0.0%) |
| 4 or 5 Rooms | 18 (18.8%) | 13 (76.5%) |
| 6 or 7 Rooms | 35 (36.5%) | 4 (23.5%) |
| 8 or more Rooms | 43 (44.8%) | 0 (0.0%) |
| Total | 96 (100.0%) | 17 (100.0%) |
Housing Structure by Heating Type in Ezel
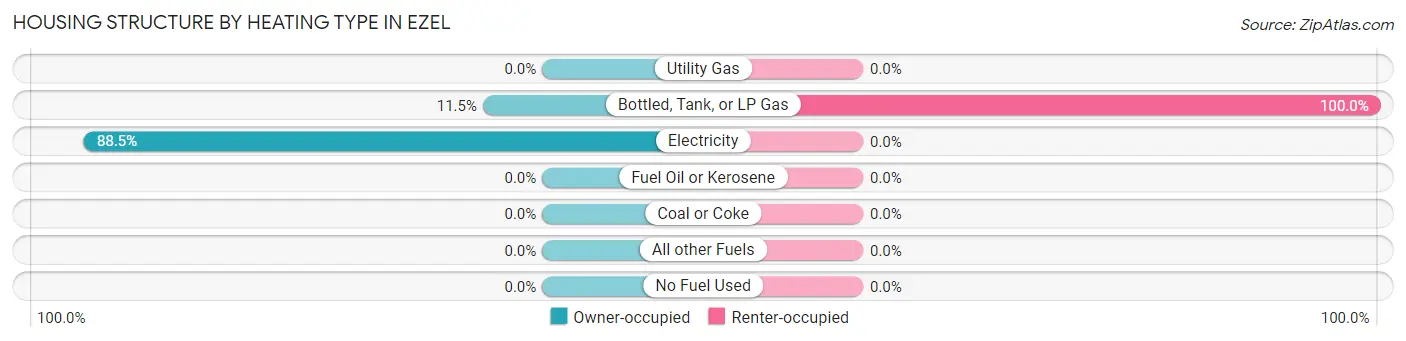
| Heating Type | Owner-occupied | Renter-occupied |
| Utility Gas | 0 (0.0%) | 0 (0.0%) |
| Bottled, Tank, or LP Gas | 11 (11.5%) | 17 (100.0%) |
| Electricity | 85 (88.5%) | 0 (0.0%) |
| Fuel Oil or Kerosene | 0 (0.0%) | 0 (0.0%) |
| Coal or Coke | 0 (0.0%) | 0 (0.0%) |
| All other Fuels | 0 (0.0%) | 0 (0.0%) |
| No Fuel Used | 0 (0.0%) | 0 (0.0%) |
| Total | 96 (100.0%) | 17 (100.0%) |
Household Vehicle Usage in Ezel
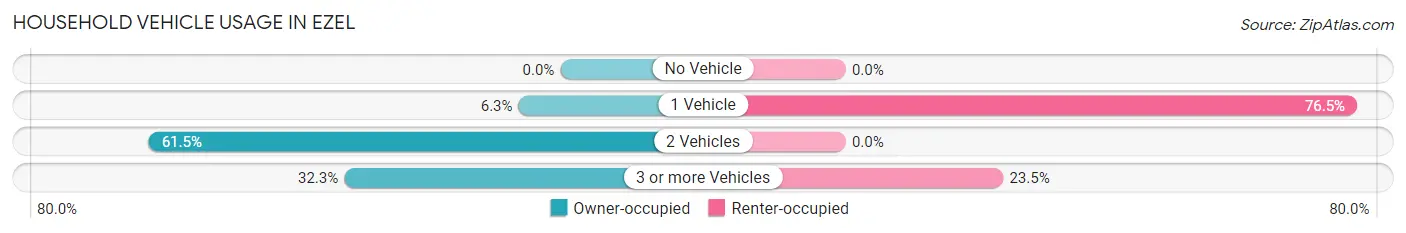
| Vehicles per Household | Owner-occupied | Renter-occupied |
| No Vehicle | 0 (0.0%) | 0 (0.0%) |
| 1 Vehicle | 6 (6.2%) | 13 (76.5%) |
| 2 Vehicles | 59 (61.5%) | 0 (0.0%) |
| 3 or more Vehicles | 31 (32.3%) | 4 (23.5%) |
| Total | 96 (100.0%) | 17 (100.0%) |
Real Estate & Mortgages in Ezel
Real Estate and Mortgage Overview in Ezel
| Characteristic | Without Mortgage | With Mortgage |
| Housing Units | 54 | 42 |
| Median Property Value | - | - |
| Median Household Income | $32,917 | $6 |
| Monthly Housing Costs | $310 | $0 |
| Real Estate Taxes | $199 | $0 |
Property Value by Mortgage Status in Ezel
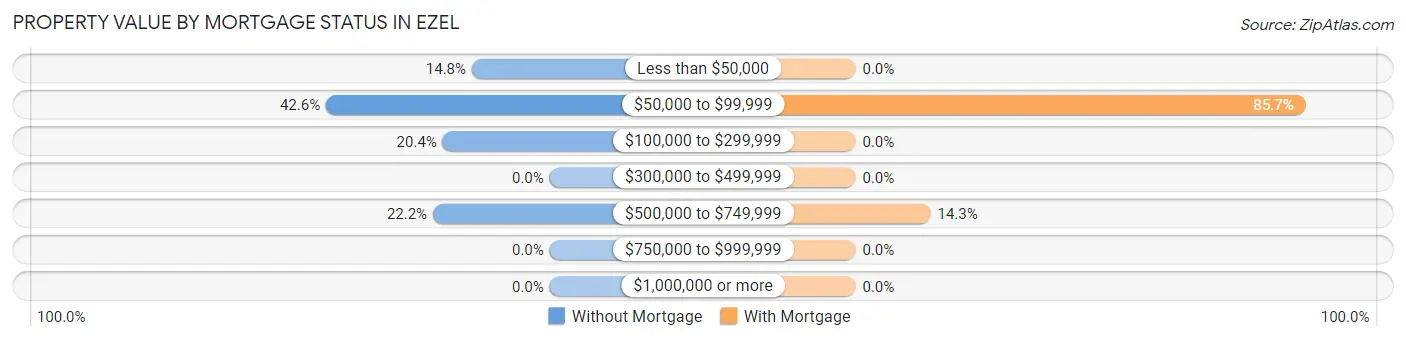
| Property Value | Without Mortgage | With Mortgage |
| Less than $50,000 | 8 (14.8%) | 0 (0.0%) |
| $50,000 to $99,999 | 23 (42.6%) | 36 (85.7%) |
| $100,000 to $299,999 | 11 (20.4%) | 0 (0.0%) |
| $300,000 to $499,999 | 0 (0.0%) | 0 (0.0%) |
| $500,000 to $749,999 | 12 (22.2%) | 6 (14.3%) |
| $750,000 to $999,999 | 0 (0.0%) | 0 (0.0%) |
| $1,000,000 or more | 0 (0.0%) | 0 (0.0%) |
| Total | 54 (100.0%) | 42 (100.0%) |
Household Income by Mortgage Status in Ezel
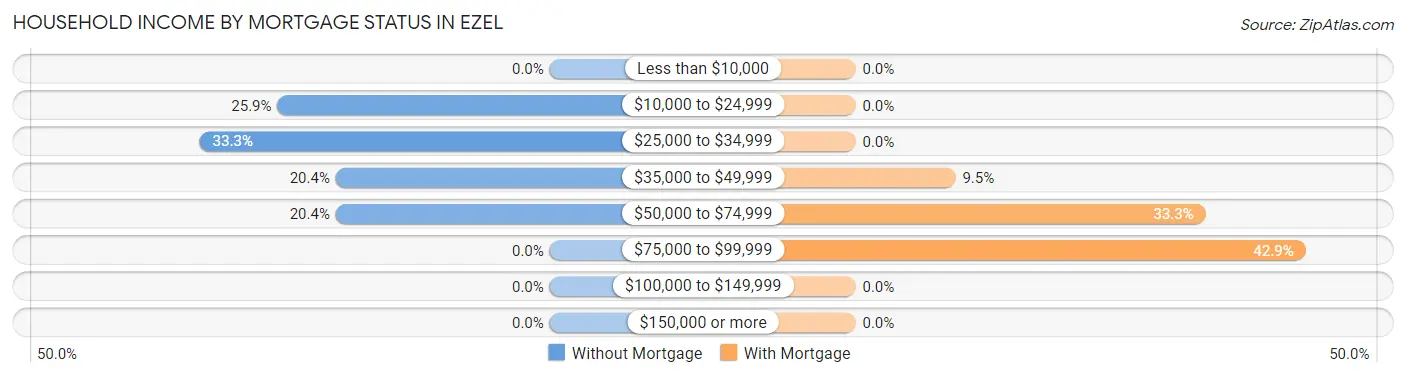
| Household Income | Without Mortgage | With Mortgage |
| Less than $10,000 | 0 (0.0%) | 0 (0.0%) |
| $10,000 to $24,999 | 14 (25.9%) | 0 (0.0%) |
| $25,000 to $34,999 | 18 (33.3%) | 0 (0.0%) |
| $35,000 to $49,999 | 11 (20.4%) | 4 (9.5%) |
| $50,000 to $74,999 | 11 (20.4%) | 14 (33.3%) |
| $75,000 to $99,999 | 0 (0.0%) | 18 (42.9%) |
| $100,000 to $149,999 | 0 (0.0%) | 0 (0.0%) |
| $150,000 or more | 0 (0.0%) | 0 (0.0%) |
| Total | 54 (100.0%) | 42 (100.0%) |
Property Value to Household Income Ratio in Ezel
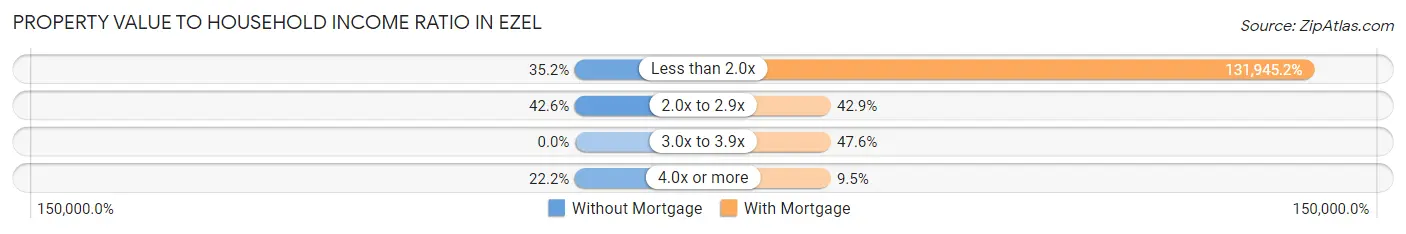
| Value-to-Income Ratio | Without Mortgage | With Mortgage |
| Less than 2.0x | 19 (35.2%) | 55,417 (131,945.2%) |
| 2.0x to 2.9x | 23 (42.6%) | 18 (42.9%) |
| 3.0x to 3.9x | 0 (0.0%) | 20 (47.6%) |
| 4.0x or more | 12 (22.2%) | 4 (9.5%) |
| Total | 54 (100.0%) | 42 (100.0%) |
Real Estate Taxes by Mortgage Status in Ezel
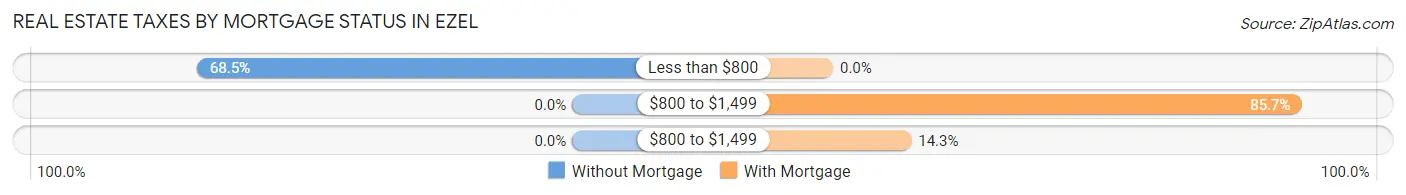
| Property Taxes | Without Mortgage | With Mortgage |
| Less than $800 | 37 (68.5%) | 0 (0.0%) |
| $800 to $1,499 | 0 (0.0%) | 36 (85.7%) |
| $800 to $1,499 | 0 (0.0%) | 6 (14.3%) |
| Total | 54 (100.0%) | 42 (100.0%) |
Health & Disability in Ezel
Health Insurance Coverage by Age in Ezel
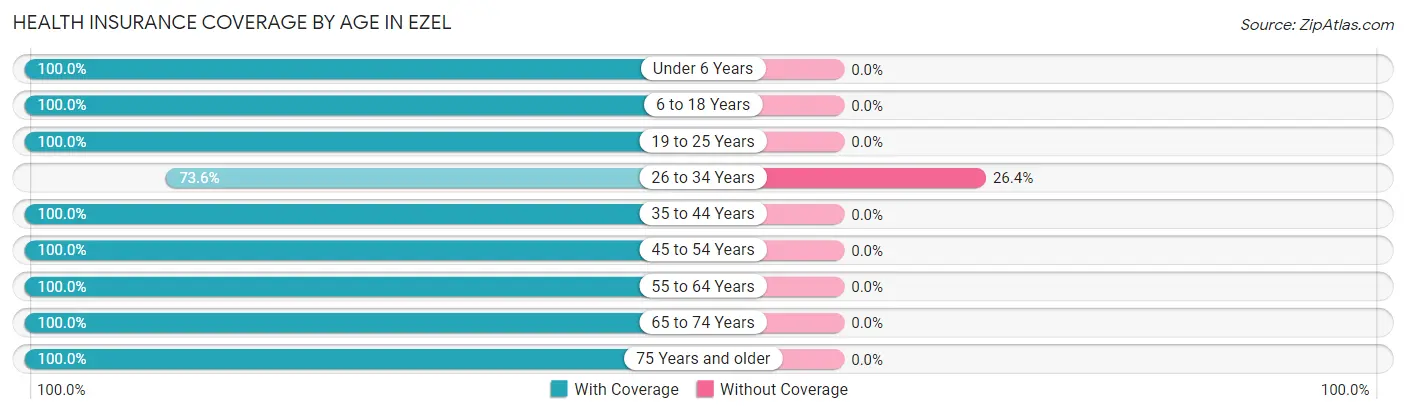
| Age Bracket | With Coverage | Without Coverage |
| Under 6 Years | 5 (100.0%) | 0 (0.0%) |
| 6 to 18 Years | 68 (100.0%) | 0 (0.0%) |
| 19 to 25 Years | 7 (100.0%) | 0 (0.0%) |
| 26 to 34 Years | 39 (73.6%) | 14 (26.4%) |
| 35 to 44 Years | 24 (100.0%) | 0 (0.0%) |
| 45 to 54 Years | 8 (100.0%) | 0 (0.0%) |
| 55 to 64 Years | 80 (100.0%) | 0 (0.0%) |
| 65 to 74 Years | 44 (100.0%) | 0 (0.0%) |
| 75 Years and older | 36 (100.0%) | 0 (0.0%) |
| Total | 311 (95.7%) | 14 (4.3%) |
Health Insurance Coverage by Citizenship Status in Ezel
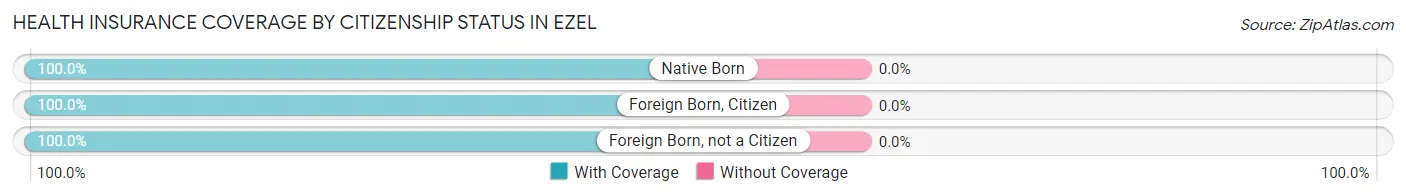
| Citizenship Status | With Coverage | Without Coverage |
| Native Born | 5 (100.0%) | 0 (0.0%) |
| Foreign Born, Citizen | 68 (100.0%) | 0 (0.0%) |
| Foreign Born, not a Citizen | 7 (100.0%) | 0 (0.0%) |
Health Insurance Coverage by Household Income in Ezel
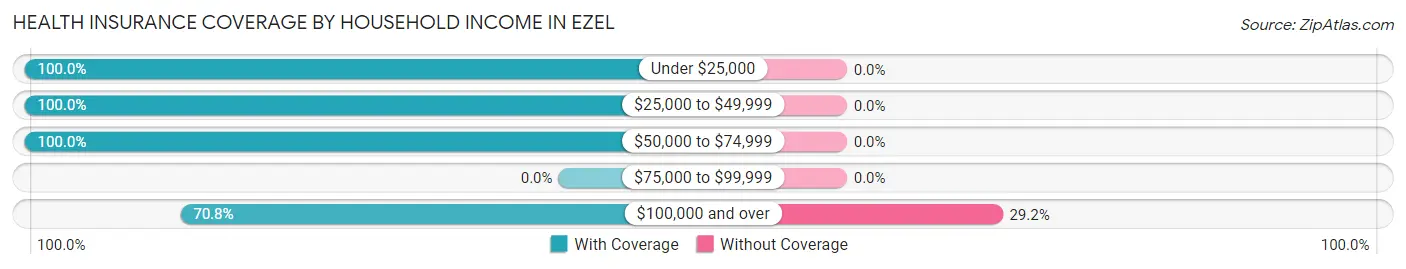
| Household Income | With Coverage | Without Coverage |
| Under $25,000 | 38 (100.0%) | 0 (0.0%) |
| $25,000 to $49,999 | 121 (100.0%) | 0 (0.0%) |
| $50,000 to $74,999 | 118 (100.0%) | 0 (0.0%) |
| $75,000 to $99,999 | 0 (0.0%) | 0 (0.0%) |
| $100,000 and over | 34 (70.8%) | 14 (29.2%) |
Public vs Private Health Insurance Coverage by Age in Ezel
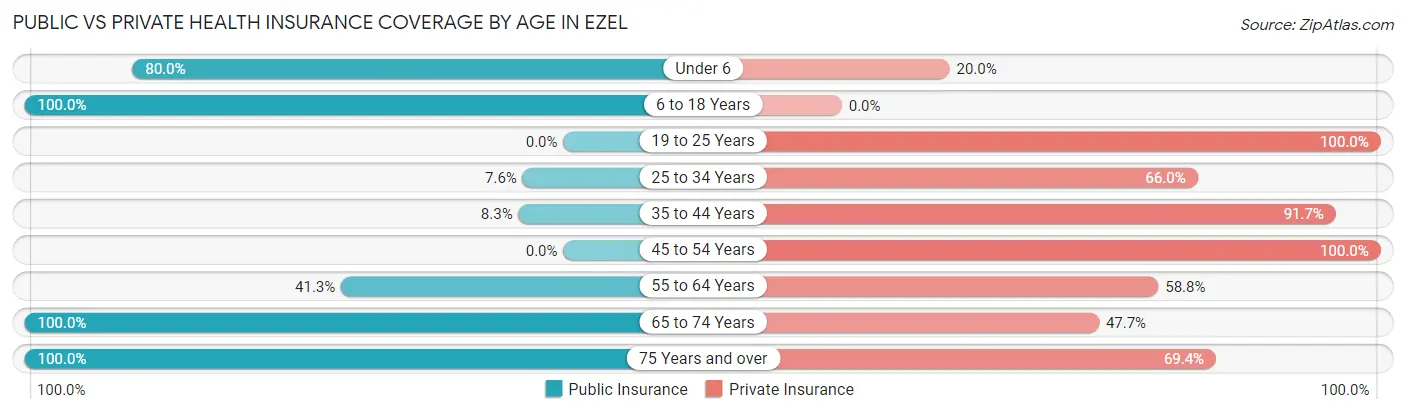
| Age Bracket | Public Insurance | Private Insurance |
| Under 6 | 4 (80.0%) | 1 (20.0%) |
| 6 to 18 Years | 68 (100.0%) | 0 (0.0%) |
| 19 to 25 Years | 0 (0.0%) | 7 (100.0%) |
| 25 to 34 Years | 4 (7.5%) | 35 (66.0%) |
| 35 to 44 Years | 2 (8.3%) | 22 (91.7%) |
| 45 to 54 Years | 0 (0.0%) | 8 (100.0%) |
| 55 to 64 Years | 33 (41.2%) | 47 (58.8%) |
| 65 to 74 Years | 44 (100.0%) | 21 (47.7%) |
| 75 Years and over | 36 (100.0%) | 25 (69.4%) |
| Total | 191 (58.8%) | 166 (51.1%) |
Disability Status by Sex by Age in Ezel
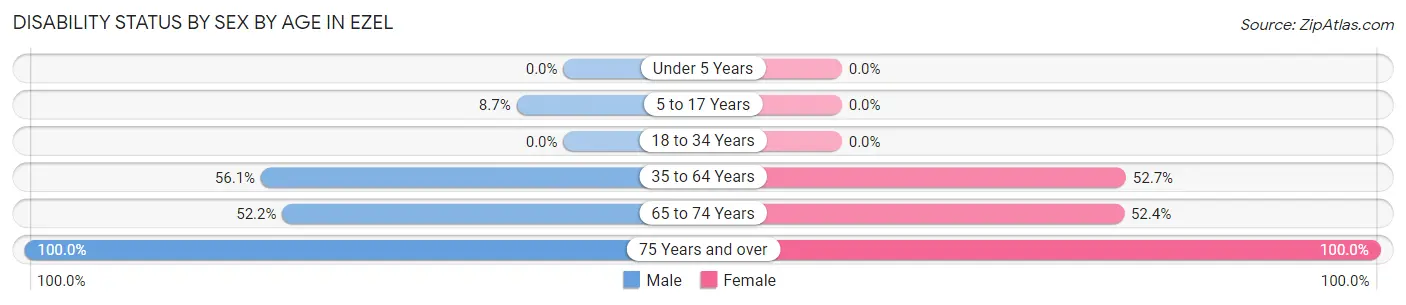
| Age Bracket | Male | Female |
| Under 5 Years | 0 (0.0%) | 0 (0.0%) |
| 5 to 17 Years | 2 (8.7%) | 0 (0.0%) |
| 18 to 34 Years | 0 (0.0%) | 0 (0.0%) |
| 35 to 64 Years | 32 (56.1%) | 29 (52.7%) |
| 65 to 74 Years | 12 (52.2%) | 11 (52.4%) |
| 75 Years and over | 19 (100.0%) | 17 (100.0%) |
Disability Class by Sex by Age in Ezel
Disability Class: Hearing Difficulty
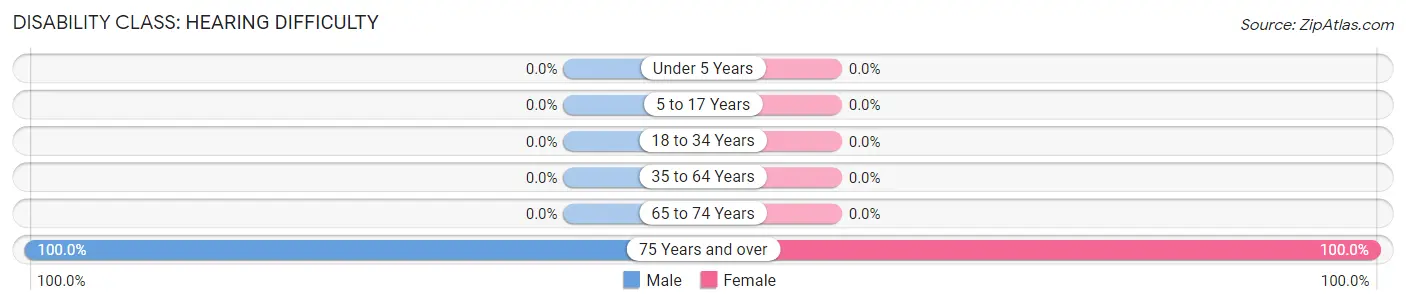
| Age Bracket | Male | Female |
| Under 5 Years | 0 (0.0%) | 0 (0.0%) |
| 5 to 17 Years | 0 (0.0%) | 0 (0.0%) |
| 18 to 34 Years | 0 (0.0%) | 0 (0.0%) |
| 35 to 64 Years | 0 (0.0%) | 0 (0.0%) |
| 65 to 74 Years | 0 (0.0%) | 0 (0.0%) |
| 75 Years and over | 19 (100.0%) | 17 (100.0%) |
Disability Class: Vision Difficulty
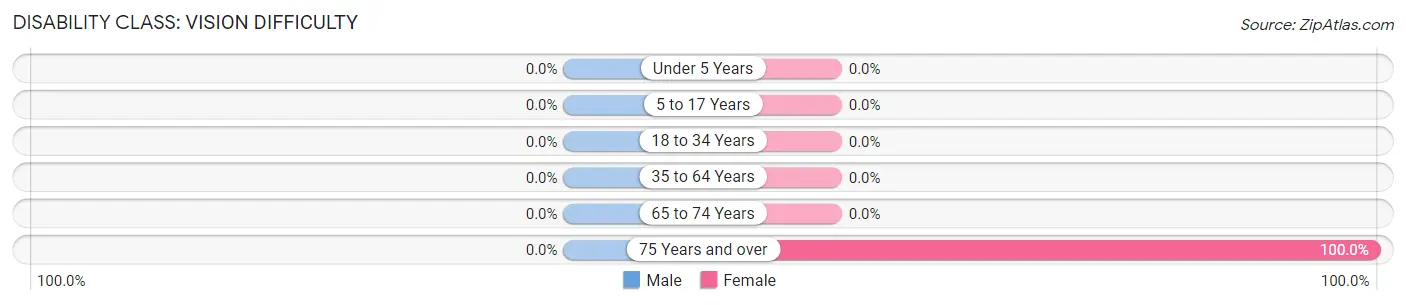
| Age Bracket | Male | Female |
| Under 5 Years | 0 (0.0%) | 0 (0.0%) |
| 5 to 17 Years | 0 (0.0%) | 0 (0.0%) |
| 18 to 34 Years | 0 (0.0%) | 0 (0.0%) |
| 35 to 64 Years | 0 (0.0%) | 0 (0.0%) |
| 65 to 74 Years | 0 (0.0%) | 0 (0.0%) |
| 75 Years and over | 0 (0.0%) | 17 (100.0%) |
Disability Class: Cognitive Difficulty
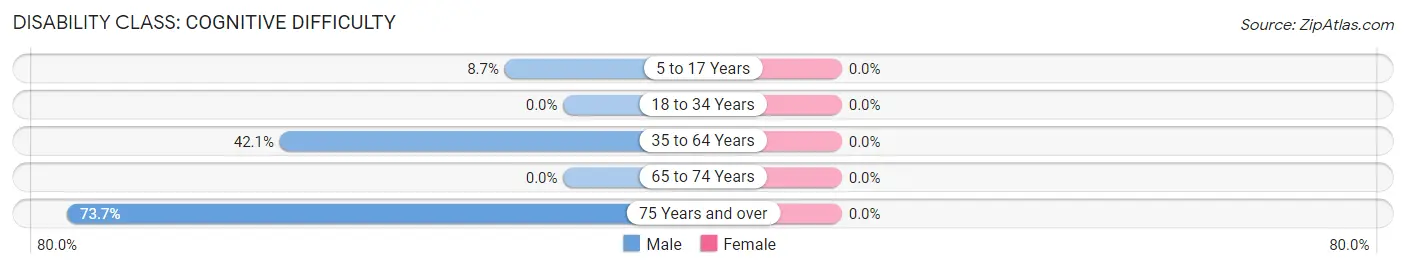
| Age Bracket | Male | Female |
| 5 to 17 Years | 2 (8.7%) | 0 (0.0%) |
| 18 to 34 Years | 0 (0.0%) | 0 (0.0%) |
| 35 to 64 Years | 24 (42.1%) | 0 (0.0%) |
| 65 to 74 Years | 0 (0.0%) | 0 (0.0%) |
| 75 Years and over | 14 (73.7%) | 0 (0.0%) |
Disability Class: Ambulatory Difficulty
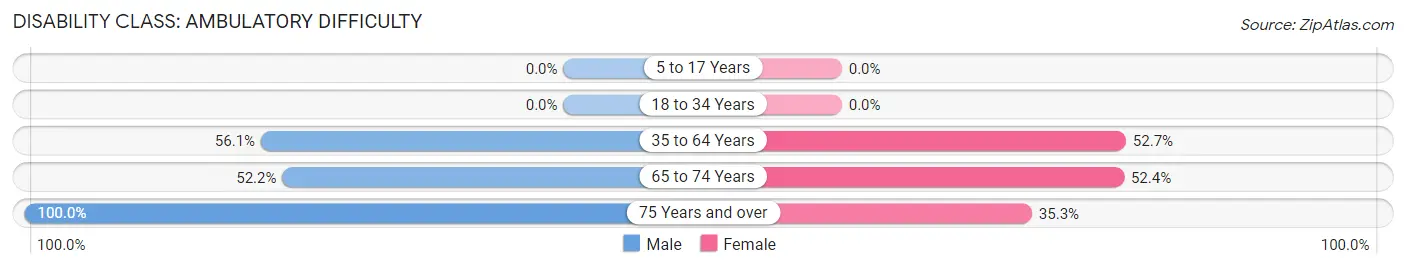
| Age Bracket | Male | Female |
| 5 to 17 Years | 0 (0.0%) | 0 (0.0%) |
| 18 to 34 Years | 0 (0.0%) | 0 (0.0%) |
| 35 to 64 Years | 32 (56.1%) | 29 (52.7%) |
| 65 to 74 Years | 12 (52.2%) | 11 (52.4%) |
| 75 Years and over | 19 (100.0%) | 6 (35.3%) |
Disability Class: Self-Care Difficulty
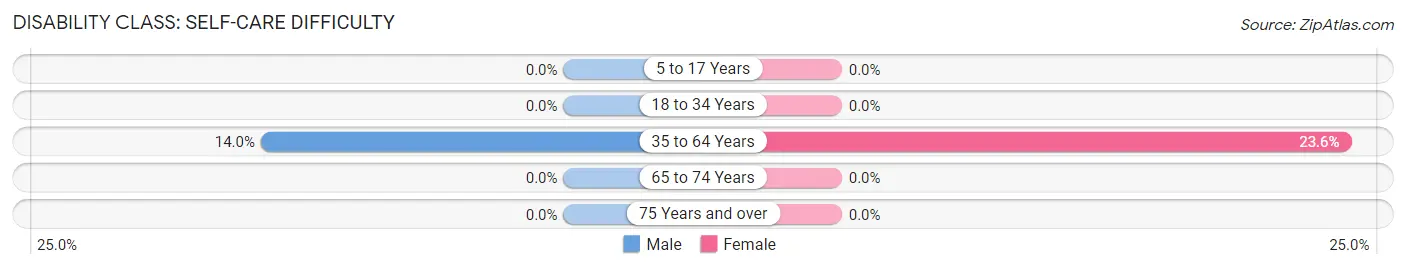
| Age Bracket | Male | Female |
| 5 to 17 Years | 0 (0.0%) | 0 (0.0%) |
| 18 to 34 Years | 0 (0.0%) | 0 (0.0%) |
| 35 to 64 Years | 8 (14.0%) | 13 (23.6%) |
| 65 to 74 Years | 0 (0.0%) | 0 (0.0%) |
| 75 Years and over | 0 (0.0%) | 0 (0.0%) |
Technology Access in Ezel
Computing Device Access in Ezel
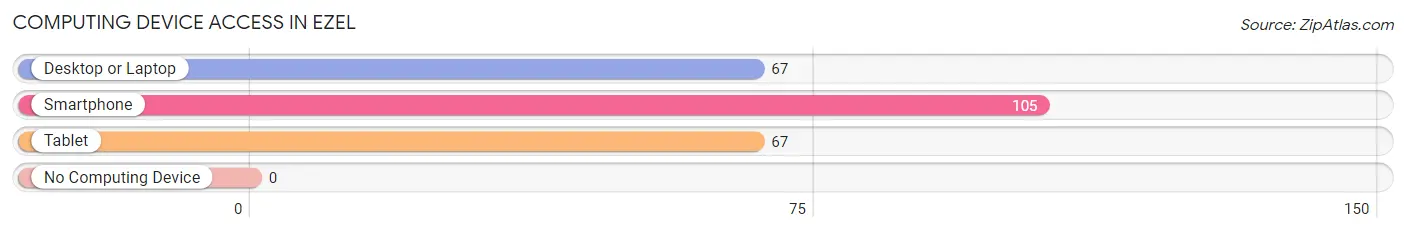
| Device Type | # Households | % Households |
| Desktop or Laptop | 67 | 59.3% |
| Smartphone | 105 | 92.9% |
| Tablet | 67 | 59.3% |
| No Computing Device | 0 | 0.0% |
| Total | 113 | 100.0% |
Internet Access in Ezel
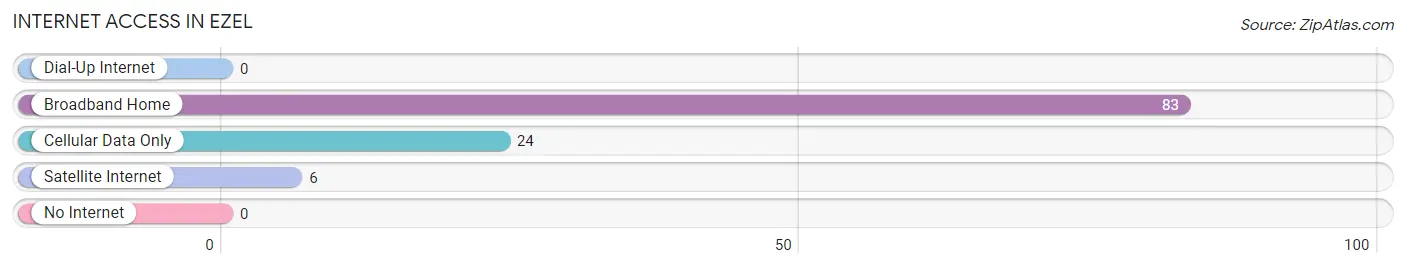
| Internet Type | # Households | % Households |
| Dial-Up Internet | 0 | 0.0% |
| Broadband Home | 83 | 73.5% |
| Cellular Data Only | 24 | 21.2% |
| Satellite Internet | 6 | 5.3% |
| No Internet | 0 | 0.0% |
| Total | 113 | 100.0% |
Ezel Summary
Ezel is a small unincorporated community located in Morgan County, Kentucky. It is situated in the foothills of the Appalachian Mountains, approximately 20 miles east of Lexington. The population of Ezel was estimated to be around 500 in 2000.
Geography
Ezel is located in the foothills of the Appalachian Mountains, approximately 20 miles east of Lexington. The town is situated in a valley surrounded by rolling hills and is bordered by the Licking River to the north. The terrain is mostly hilly and forested, with some open fields and pastures. The climate is humid and temperate, with hot summers and cold winters.
Economy
The economy of Ezel is largely based on agriculture and forestry. The town is home to several small farms, which produce a variety of crops, including corn, soybeans, wheat, and hay. The surrounding forests provide timber for the local lumber industry. There are also several small businesses in the area, including a general store, a gas station, and a few restaurants.
Demographics
As of the 2000 census, the population of Ezel was estimated to be around 500. The racial makeup of the town was 97.2% White, 0.8% African American, 0.4% Native American, 0.2% Asian, and 1.4% from other races. The median household income was $25,000, and the median family income was $30,000. The per capita income was $14,000.
Conclusion
Ezel is a small unincorporated community located in Morgan County, Kentucky. It is situated in the foothills of the Appalachian Mountains, approximately 20 miles east of Lexington. The economy of Ezel is largely based on agriculture and forestry, and the population of the town was estimated to be around 500 in 2000. The racial makeup of the town was 97.2% White, 0.8% African American, 0.4% Native American, 0.2% Asian, and 1.4% from other races. The median household income was $25,000, and the median family income was $30,000. The per capita income was $14,000.
Common Questions
What is Per Capita Income in Ezel?
Per Capita income in Ezel is $17,200.
What is the Median Family Income in Ezel?
Median Family Income in Ezel is $38,500.
What is the Median Household income in Ezel?
Median Household Income in Ezel is $37,850.
What is Inequality or Gini Index in Ezel?
Inequality or Gini Index in Ezel is 0.34.
What is the Total Population of Ezel?
Total Population of Ezel is 325.
What is the Total Male Population of Ezel?
Total Male Population of Ezel is 154.
What is the Total Female Population of Ezel?
Total Female Population of Ezel is 171.
What is the Ratio of Males per 100 Females in Ezel?
There are 90.06 Males per 100 Females in Ezel.
What is the Ratio of Females per 100 Males in Ezel?
There are 111.04 Females per 100 Males in Ezel.
What is the Median Population Age in Ezel?
Median Population Age in Ezel is 53.7 Years.
What is the Average Family Size in Ezel
Average Family Size in Ezel is 3.1 People.
What is the Average Household Size in Ezel
Average Household Size in Ezel is 2.9 People.
How Large is the Labor Force in Ezel?
There are 79 People in the Labor Forcein in Ezel.
What is the Percentage of People in the Labor Force in Ezel?
28.4% of People are in the Labor Force in Ezel.