Big Clifty, KY Map & Demographics
Big Clifty Map
Big Clifty Overview
$14,048
PER CAPITA INCOME
$25,500
AVG FAMILY INCOME
$22,813
AVG HOUSEHOLD INCOME
0.42
INEQUALITY / GINI INDEX
227
TOTAL POPULATION
140
MALE POPULATION
87
FEMALE POPULATION
160.92
MALES / 100 FEMALES
62.14
FEMALES / 100 MALES
27.0
MEDIAN AGE
4.0
AVG FAMILY SIZE
2.5
AVG HOUSEHOLD SIZE
82
LABOR FORCE [ PEOPLE ]
46.9%
PERCENT IN LABOR FORCE
18.3%
UNEMPLOYMENT RATE
Big Clifty Zip Codes
Big Clifty Area Codes
Income in Big Clifty
Income Overview in Big Clifty
Per Capita Income in Big Clifty is $14,048, while median incomes of families and households are $25,500 and $22,813 respectively.
| Characteristic | Number | Measure |
| Per Capita Income | 227 | $14,048 |
| Median Family Income | 40 | $25,500 |
| Mean Family Income | 40 | $43,548 |
| Median Household Income | 92 | $22,813 |
| Mean Household Income | 92 | $33,216 |
| Income Deficit | 40 | $0 |
| Wage / Income Gap (%) | 227 | 0.00% |
| Wage / Income Gap ($) | 227 | 100.00¢ per $1 |
| Gini / Inequality Index | 227 | 0.42 |
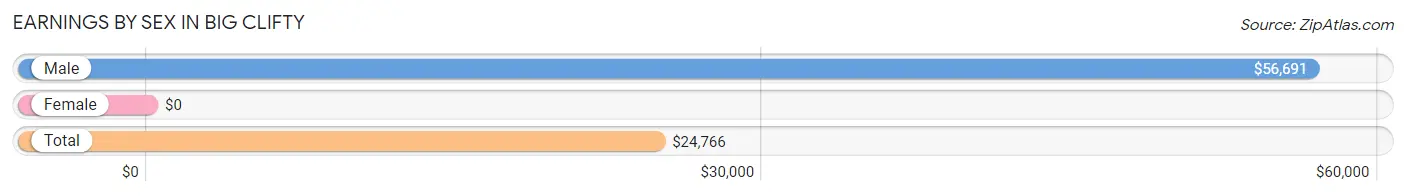
Earnings by Sex in Big Clifty
| Sex | Number | Average Earnings |
| Male | 23 (34.3%) | $56,691 |
| Female | 44 (65.7%) | $0 |
| Total | 67 (100.0%) | $24,766 |
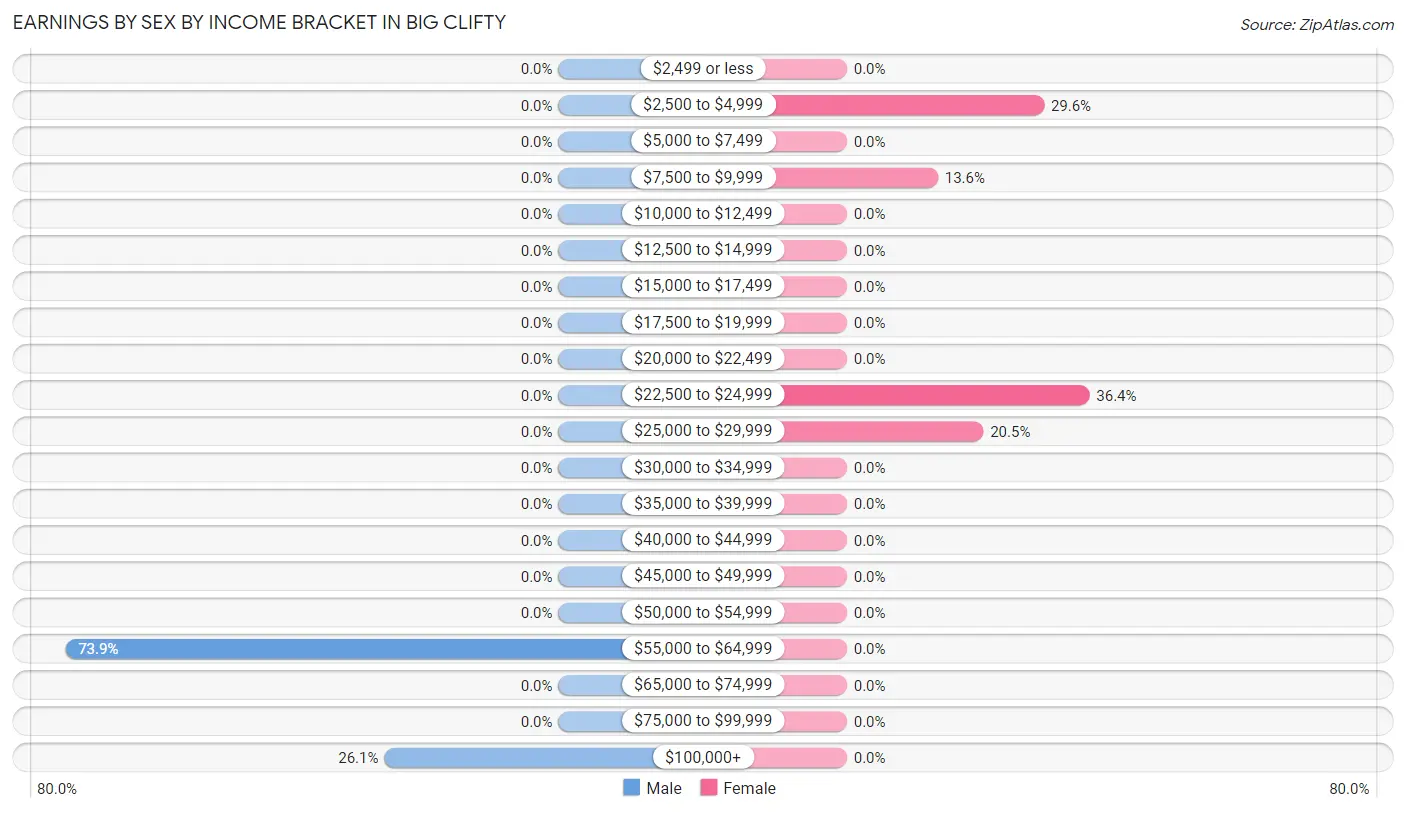
Earnings by Sex by Income Bracket in Big Clifty
The most common earnings brackets in Big Clifty are $55,000 to $64,999 for men (17 | 73.9%) and $22,500 to $24,999 for women (16 | 36.4%).
| Income | Male | Female |
| $2,499 or less | 0 (0.0%) | 0 (0.0%) |
| $2,500 to $4,999 | 0 (0.0%) | 13 (29.5%) |
| $5,000 to $7,499 | 0 (0.0%) | 0 (0.0%) |
| $7,500 to $9,999 | 0 (0.0%) | 6 (13.6%) |
| $10,000 to $12,499 | 0 (0.0%) | 0 (0.0%) |
| $12,500 to $14,999 | 0 (0.0%) | 0 (0.0%) |
| $15,000 to $17,499 | 0 (0.0%) | 0 (0.0%) |
| $17,500 to $19,999 | 0 (0.0%) | 0 (0.0%) |
| $20,000 to $22,499 | 0 (0.0%) | 0 (0.0%) |
| $22,500 to $24,999 | 0 (0.0%) | 16 (36.4%) |
| $25,000 to $29,999 | 0 (0.0%) | 9 (20.4%) |
| $30,000 to $34,999 | 0 (0.0%) | 0 (0.0%) |
| $35,000 to $39,999 | 0 (0.0%) | 0 (0.0%) |
| $40,000 to $44,999 | 0 (0.0%) | 0 (0.0%) |
| $45,000 to $49,999 | 0 (0.0%) | 0 (0.0%) |
| $50,000 to $54,999 | 0 (0.0%) | 0 (0.0%) |
| $55,000 to $64,999 | 17 (73.9%) | 0 (0.0%) |
| $65,000 to $74,999 | 0 (0.0%) | 0 (0.0%) |
| $75,000 to $99,999 | 0 (0.0%) | 0 (0.0%) |
| $100,000+ | 6 (26.1%) | 0 (0.0%) |
| Total | 23 (100.0%) | 44 (100.0%) |
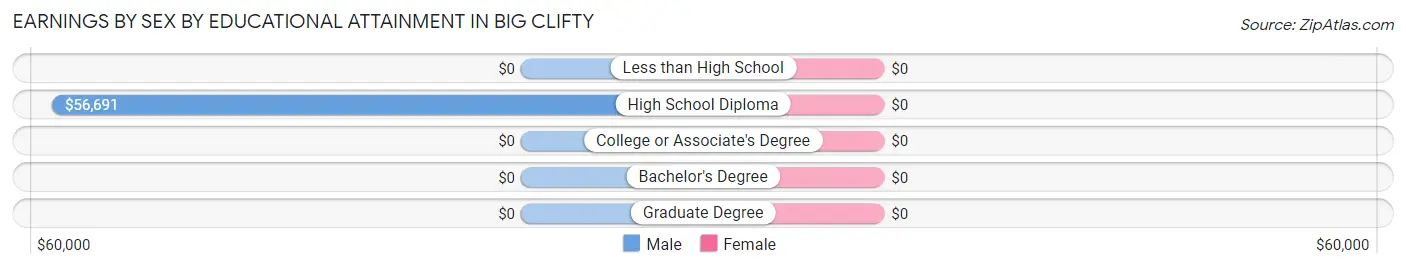
Earnings by Sex by Educational Attainment in Big Clifty
| Educational Attainment | Male Income | Female Income |
| Less than High School | - | - |
| High School Diploma | $56,691 | $0 |
| College or Associate's Degree | - | - |
| Bachelor's Degree | - | - |
| Graduate Degree | - | - |
| Total | $56,691 | $0 |
Family Income in Big Clifty
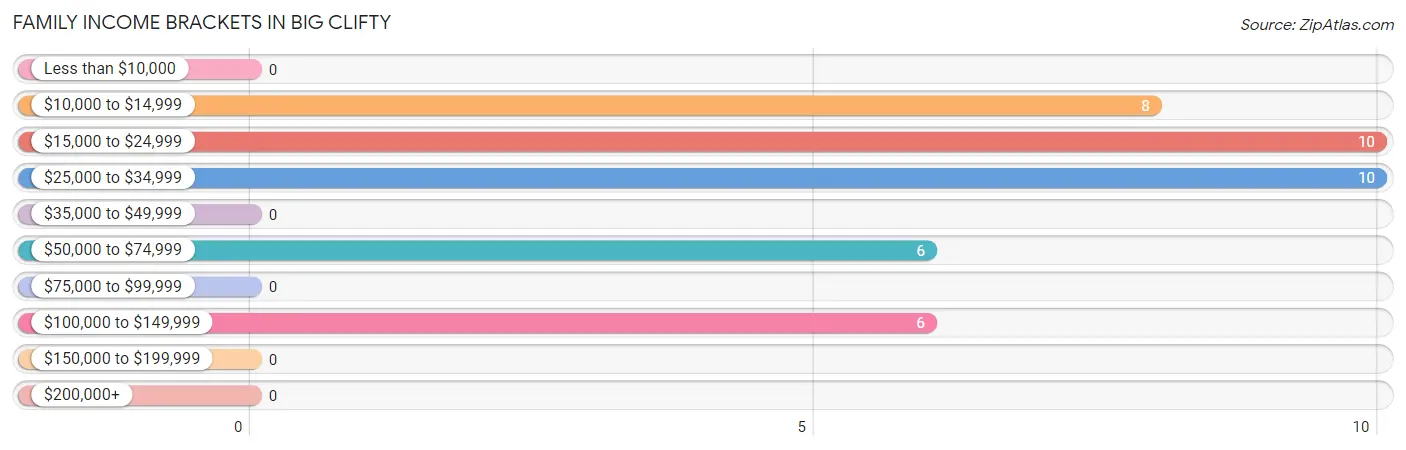
Family Income Brackets in Big Clifty
According to the Big Clifty family income data, there are 10 families falling into the $15,000 to $24,999 income range, which is the most common income bracket and makes up 25.0% of all families.
| Income Bracket | # Families | % Families |
| Less than $10,000 | 0 | 0.0% |
| $10,000 to $14,999 | 8 | 20.0% |
| $15,000 to $24,999 | 10 | 25.0% |
| $25,000 to $34,999 | 10 | 25.0% |
| $35,000 to $49,999 | 0 | 0.0% |
| $50,000 to $74,999 | 6 | 15.0% |
| $75,000 to $99,999 | 0 | 0.0% |
| $100,000 to $149,999 | 6 | 15.0% |
| $150,000 to $199,999 | 0 | 0.0% |
| $200,000+ | 0 | 0.0% |
Family Income by Famaliy Size in Big Clifty
| Income Bracket | # Families | Median Income |
| 2-Person Families | 18 (45.0%) | $0 |
| 3-Person Families | 10 (25.0%) | $0 |
| 4-Person Families | 0 (0.0%) | $0 |
| 5-Person Families | 12 (30.0%) | $0 |
| 6-Person Families | 0 (0.0%) | $0 |
| 7+ Person Families | 0 (0.0%) | $0 |
| Total | 40 (100.0%) | $25,500 |
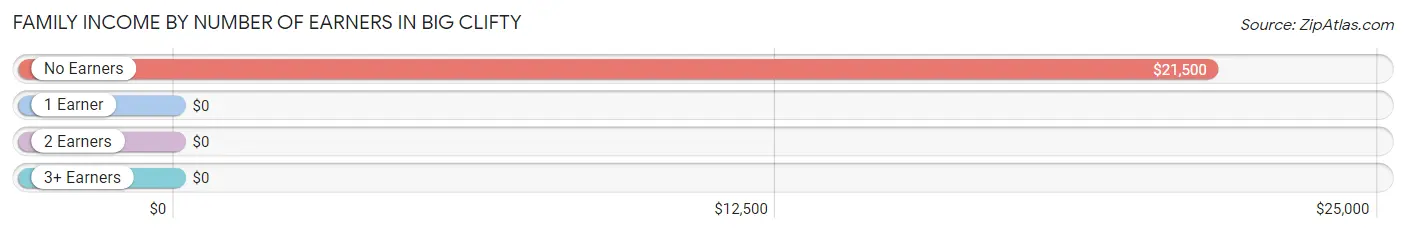
Family Income by Number of Earners in Big Clifty
| Number of Earners | # Families | Median Income |
| No Earners | 28 (70.0%) | $21,500 |
| 1 Earner | 0 (0.0%) | $0 |
| 2 Earners | 12 (30.0%) | $0 |
| 3+ Earners | 0 (0.0%) | $0 |
| Total | 40 (100.0%) | $25,500 |
Household Income in Big Clifty
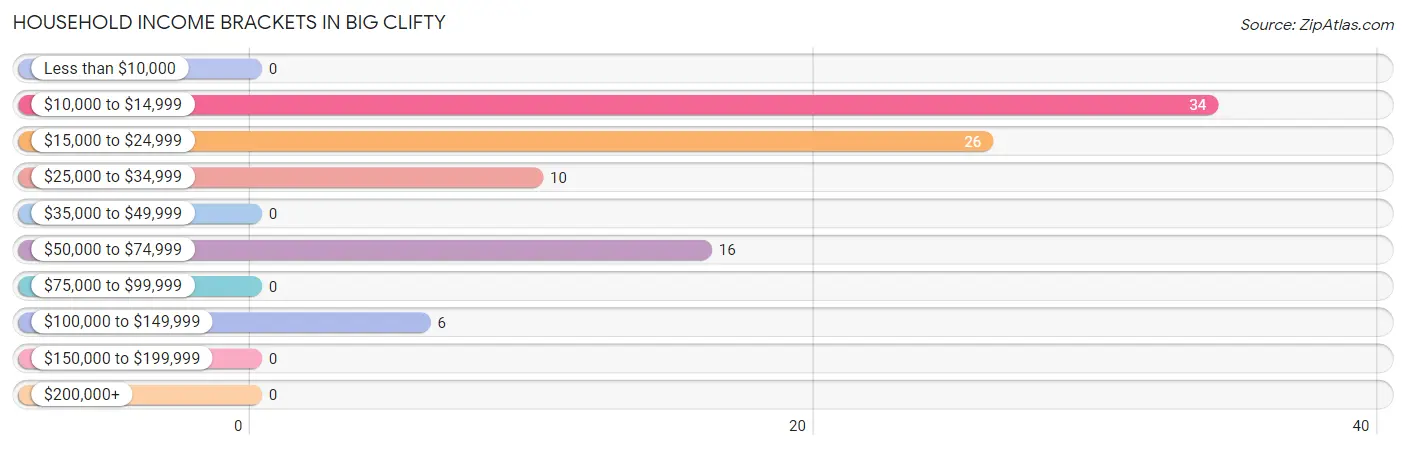
Household Income Brackets in Big Clifty
With 34 households falling in the category, the $10,000 to $14,999 income range is the most frequent in Big Clifty, accounting for 37.0% of all households.
| Income Bracket | # Households | % Households |
| Less than $10,000 | 0 | 0.0% |
| $10,000 to $14,999 | 34 | 37.0% |
| $15,000 to $24,999 | 26 | 28.3% |
| $25,000 to $34,999 | 10 | 10.9% |
| $35,000 to $49,999 | 0 | 0.0% |
| $50,000 to $74,999 | 16 | 17.4% |
| $75,000 to $99,999 | 0 | 0.0% |
| $100,000 to $149,999 | 6 | 6.5% |
| $150,000 to $199,999 | 0 | 0.0% |
| $200,000+ | 0 | 0.0% |
Household Income by Householder Age in Big Clifty
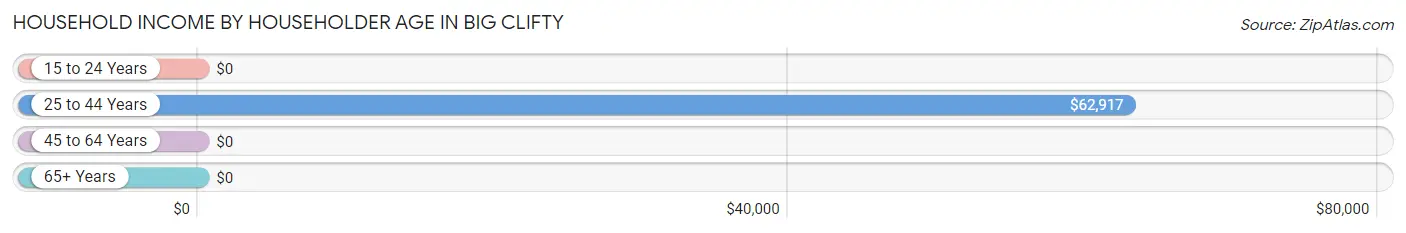
The median household income in Big Clifty is $22,813, with the highest median household income of $62,917 found in the 25 to 44 years age bracket for the primary householder. A total of 22 households (23.9%) fall into this category. Meanwhile, the 15 to 24 years age bracket for the primary householder has the lowest median household income of $0, with 16 households (17.4%) in this group.
| Income Bracket | # Households | Median Income |
| 15 to 24 Years | 16 (17.4%) | $0 |
| 25 to 44 Years | 22 (23.9%) | $62,917 |
| 45 to 64 Years | 8 (8.7%) | $0 |
| 65+ Years | 46 (50.0%) | $0 |
| Total | 92 (100.0%) | $22,813 |
Poverty in Big Clifty
Income Below Poverty by Sex and Age in Big Clifty
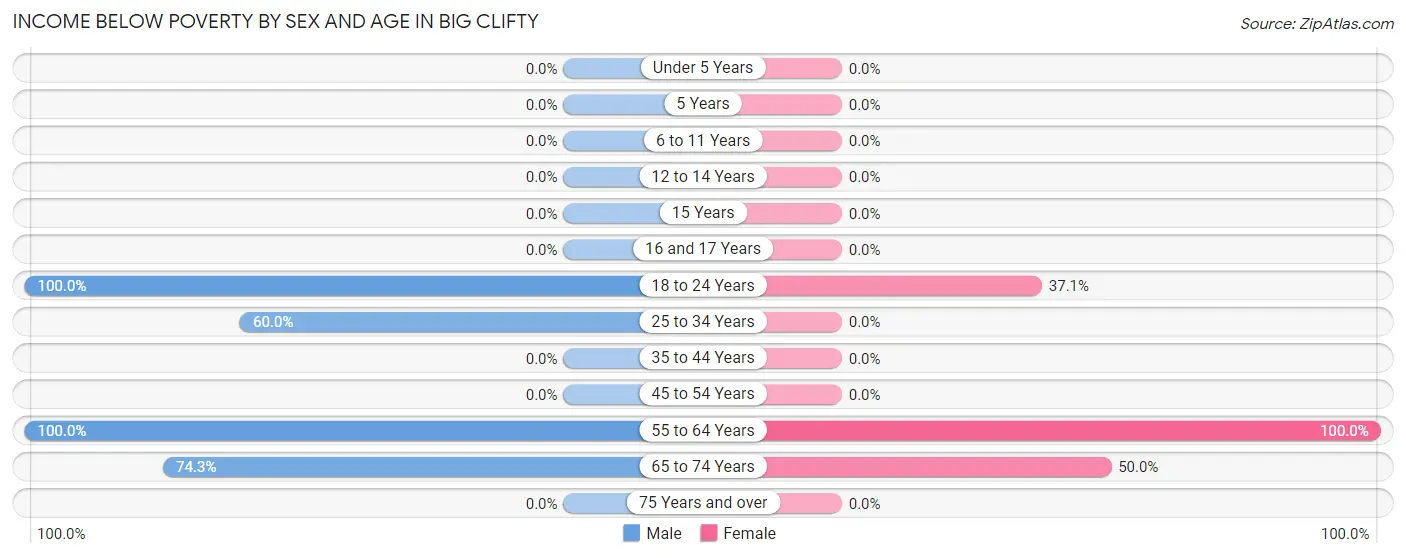
With 46.4% poverty level for males and 35.6% for females among the residents of Big Clifty, 18 to 24 year old males and 55 to 64 year old females are the most vulnerable to poverty, with 17 males (100.0%) and 8 females (100.0%) in their respective age groups living below the poverty level.
| Age Bracket | Male | Female |
| Under 5 Years | 0 (0.0%) | 0 (0.0%) |
| 5 Years | 0 (0.0%) | 0 (0.0%) |
| 6 to 11 Years | 0 (0.0%) | 0 (0.0%) |
| 12 to 14 Years | 0 (0.0%) | 0 (0.0%) |
| 15 Years | 0 (0.0%) | 0 (0.0%) |
| 16 and 17 Years | 0 (0.0%) | 0 (0.0%) |
| 18 to 24 Years | 17 (100.0%) | 13 (37.1%) |
| 25 to 34 Years | 15 (60.0%) | 0 (0.0%) |
| 35 to 44 Years | 0 (0.0%) | 0 (0.0%) |
| 45 to 54 Years | 0 (0.0%) | 0 (0.0%) |
| 55 to 64 Years | 7 (100.0%) | 8 (100.0%) |
| 65 to 74 Years | 26 (74.3%) | 10 (50.0%) |
| 75 Years and over | 0 (0.0%) | 0 (0.0%) |
| Total | 65 (46.4%) | 31 (35.6%) |
Income Above Poverty by Sex and Age in Big Clifty
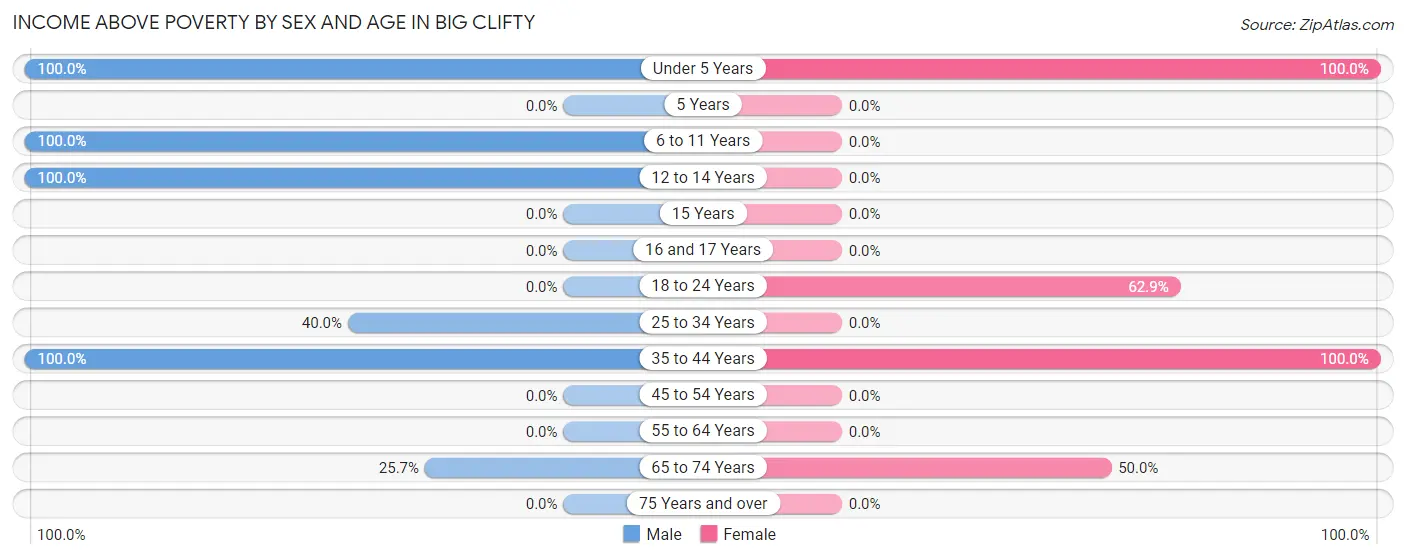
According to the poverty statistics in Big Clifty, males aged under 5 years and females aged under 5 years are the age groups that are most secure financially, with 100.0% of males and 100.0% of females in these age groups living above the poverty line.
| Age Bracket | Male | Female |
| Under 5 Years | 7 (100.0%) | 9 (100.0%) |
| 5 Years | 0 (0.0%) | 0 (0.0%) |
| 6 to 11 Years | 27 (100.0%) | 0 (0.0%) |
| 12 to 14 Years | 9 (100.0%) | 0 (0.0%) |
| 15 Years | 0 (0.0%) | 0 (0.0%) |
| 16 and 17 Years | 0 (0.0%) | 0 (0.0%) |
| 18 to 24 Years | 0 (0.0%) | 22 (62.9%) |
| 25 to 34 Years | 10 (40.0%) | 0 (0.0%) |
| 35 to 44 Years | 13 (100.0%) | 15 (100.0%) |
| 45 to 54 Years | 0 (0.0%) | 0 (0.0%) |
| 55 to 64 Years | 0 (0.0%) | 0 (0.0%) |
| 65 to 74 Years | 9 (25.7%) | 10 (50.0%) |
| 75 Years and over | 0 (0.0%) | 0 (0.0%) |
| Total | 75 (53.6%) | 56 (64.4%) |
Income Below Poverty Among Married-Couple Families in Big Clifty
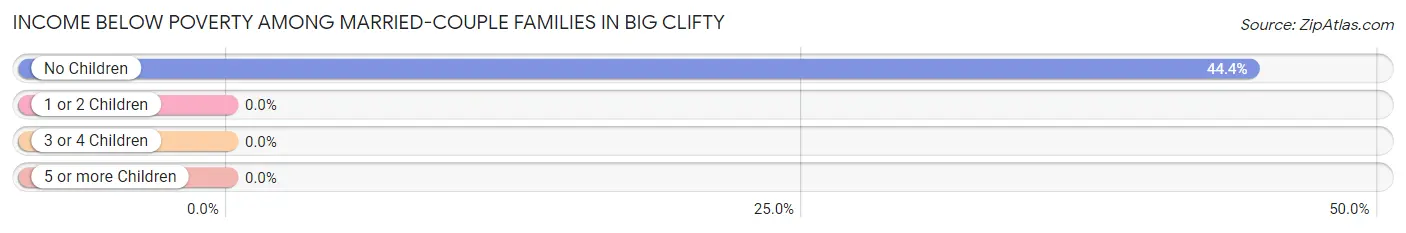
The poverty statistics for married-couple families in Big Clifty show that 26.7% or 8 of the total 30 families live below the poverty line. Families with no children have the highest poverty rate of 44.4%, comprising of 8 families. On the other hand, families with 1 or 2 children have the lowest poverty rate of 0.0%, which includes 0 families.
| Children | Above Poverty | Below Poverty |
| No Children | 10 (55.6%) | 8 (44.4%) |
| 1 or 2 Children | 6 (100.0%) | 0 (0.0%) |
| 3 or 4 Children | 6 (100.0%) | 0 (0.0%) |
| 5 or more Children | 0 (0.0%) | 0 (0.0%) |
| Total | 22 (73.3%) | 8 (26.7%) |
Income Below Poverty Among Single-Parent Households in Big Clifty
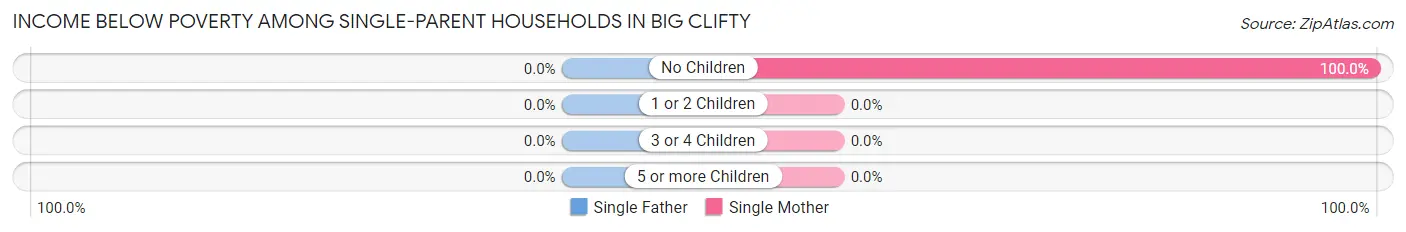
| Children | Single Father | Single Mother |
| No Children | 0 (0.0%) | 10 (100.0%) |
| 1 or 2 Children | 0 (0.0%) | 0 (0.0%) |
| 3 or 4 Children | 0 (0.0%) | 0 (0.0%) |
| 5 or more Children | 0 (0.0%) | 0 (0.0%) |
| Total | 0 (0.0%) | 10 (100.0%) |
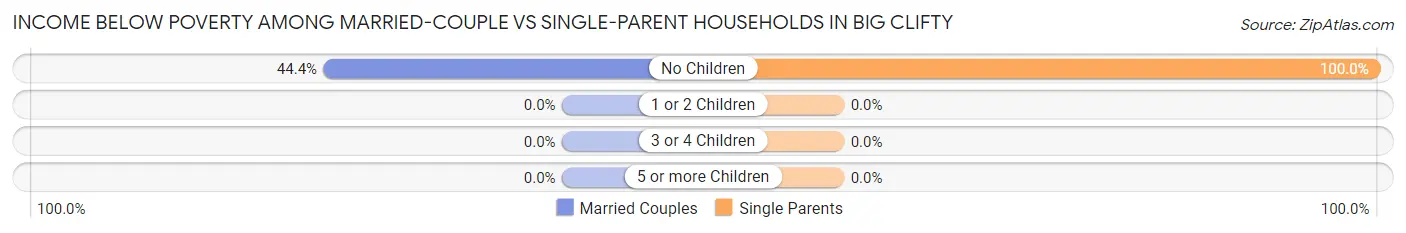
Income Below Poverty Among Married-Couple vs Single-Parent Households in Big Clifty
The poverty data for Big Clifty shows that 8 of the married-couple family households (26.7%) and 10 of the single-parent households (100.0%) are living below the poverty level. Within the married-couple family households, those with no children have the highest poverty rate, with 8 households (44.4%) falling below the poverty line. Among the single-parent households, those with no children have the highest poverty rate, with 10 household (100.0%) living below poverty.
| Children | Married-Couple Families | Single-Parent Households |
| No Children | 8 (44.4%) | 10 (100.0%) |
| 1 or 2 Children | 0 (0.0%) | 0 (0.0%) |
| 3 or 4 Children | 0 (0.0%) | 0 (0.0%) |
| 5 or more Children | 0 (0.0%) | 0 (0.0%) |
| Total | 8 (26.7%) | 10 (100.0%) |
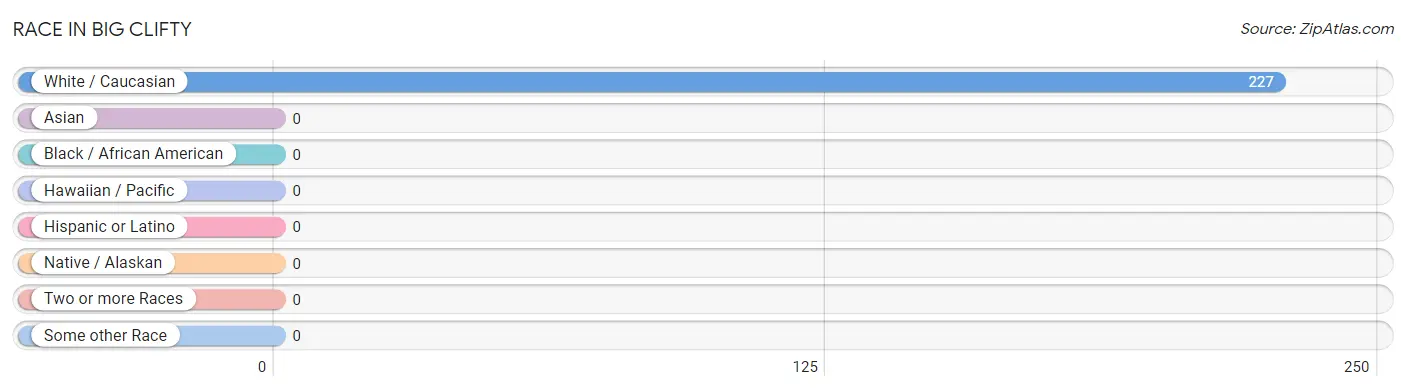
Race in Big Clifty
The most populous races in Big Clifty are , and White / Caucasian (227 | 100.0%).
| Race | # Population | % Population |
| Asian | 0 | 0.0% |
| Black / African American | 0 | 0.0% |
| Hawaiian / Pacific | 0 | 0.0% |
| Hispanic or Latino | 0 | 0.0% |
| Native / Alaskan | 0 | 0.0% |
| White / Caucasian | 227 | 100.0% |
| Two or more Races | 0 | 0.0% |
| Some other Race | 0 | 0.0% |
| Total | 227 | 100.0% |
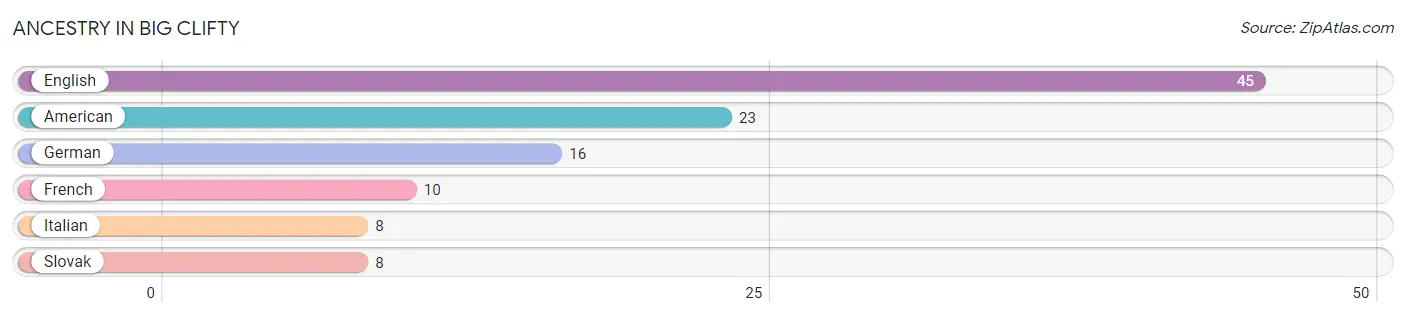
Ancestry in Big Clifty
The most populous ancestries reported in Big Clifty are English (45 | 19.8%), American (23 | 10.1%), German (16 | 7.0%), French (10 | 4.4%), and Italian (8 | 3.5%), together accounting for 44.9% of all Big Clifty residents.
| Ancestry | # Population | % Population |
| American | 23 | 10.1% |
| English | 45 | 19.8% |
| French | 10 | 4.4% |
| German | 16 | 7.0% |
| Italian | 8 | 3.5% |
| Slovak | 8 | 3.5% | View All 6 Rows |
Immigrants in Big Clifty

| Immigration Origin | # Population | % Population | View All 0 Rows |
Sex and Age in Big Clifty
Sex and Age in Big Clifty
The most populous age groups in Big Clifty are 65 to 69 Years (35 | 25.0%) for men and 20 to 24 Years (29 | 33.3%) for women.
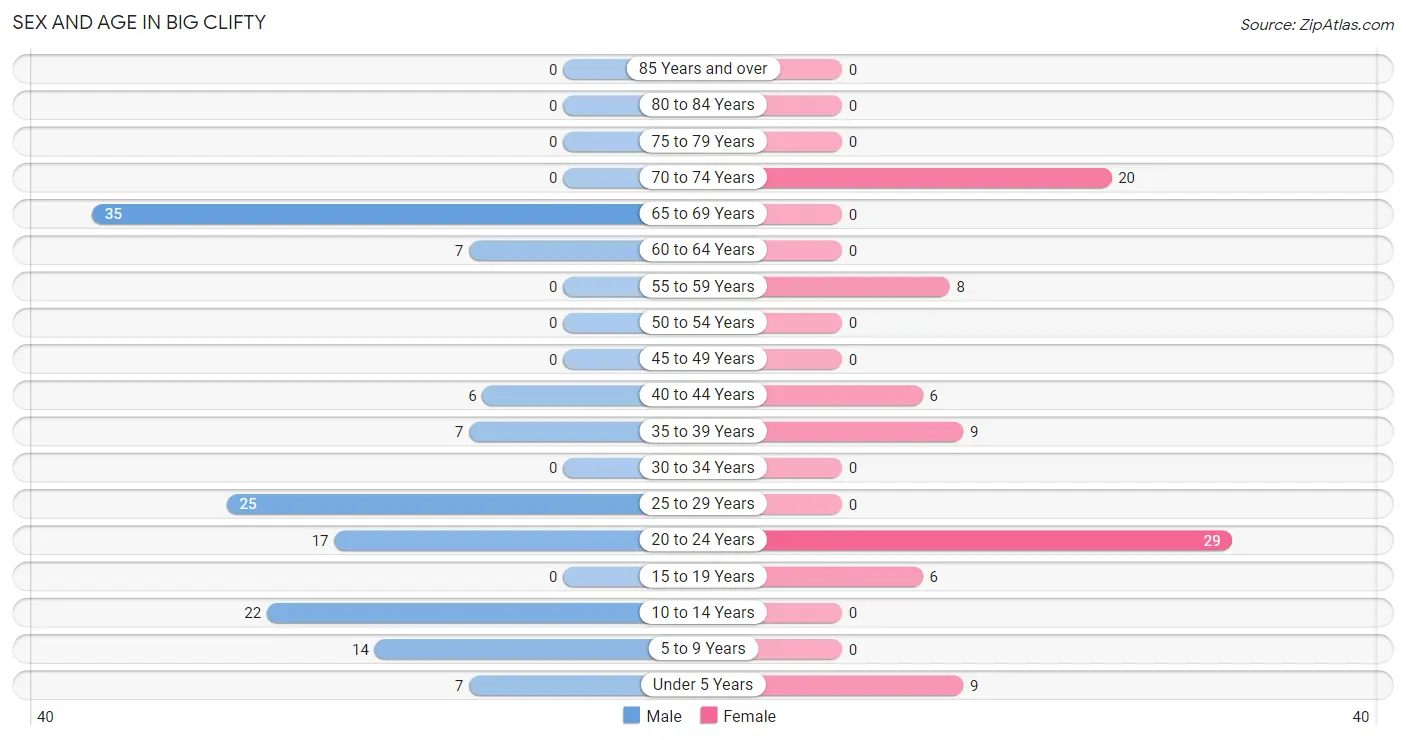
| Age Bracket | Male | Female |
| Under 5 Years | 7 (5.0%) | 9 (10.3%) |
| 5 to 9 Years | 14 (10.0%) | 0 (0.0%) |
| 10 to 14 Years | 22 (15.7%) | 0 (0.0%) |
| 15 to 19 Years | 0 (0.0%) | 6 (6.9%) |
| 20 to 24 Years | 17 (12.1%) | 29 (33.3%) |
| 25 to 29 Years | 25 (17.9%) | 0 (0.0%) |
| 30 to 34 Years | 0 (0.0%) | 0 (0.0%) |
| 35 to 39 Years | 7 (5.0%) | 9 (10.3%) |
| 40 to 44 Years | 6 (4.3%) | 6 (6.9%) |
| 45 to 49 Years | 0 (0.0%) | 0 (0.0%) |
| 50 to 54 Years | 0 (0.0%) | 0 (0.0%) |
| 55 to 59 Years | 0 (0.0%) | 8 (9.2%) |
| 60 to 64 Years | 7 (5.0%) | 0 (0.0%) |
| 65 to 69 Years | 35 (25.0%) | 0 (0.0%) |
| 70 to 74 Years | 0 (0.0%) | 20 (23.0%) |
| 75 to 79 Years | 0 (0.0%) | 0 (0.0%) |
| 80 to 84 Years | 0 (0.0%) | 0 (0.0%) |
| 85 Years and over | 0 (0.0%) | 0 (0.0%) |
| Total | 140 (100.0%) | 87 (100.0%) |
Families and Households in Big Clifty
Median Family Size in Big Clifty
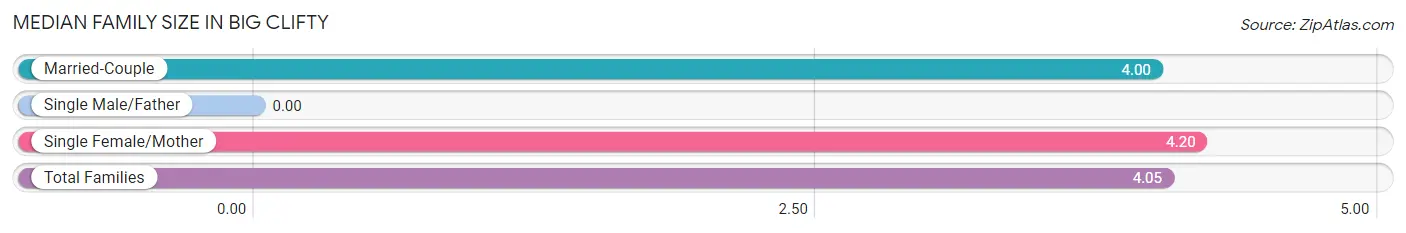
| Family Type | # Families | Family Size |
| Married-Couple | 30 (75.0%) | 4.00 |
| Single Male/Father | 0 (0.0%) | - |
| Single Female/Mother | 10 (25.0%) | 4.20 |
| Total Families | 40 (100.0%) | 4.05 |
Median Household Size in Big Clifty
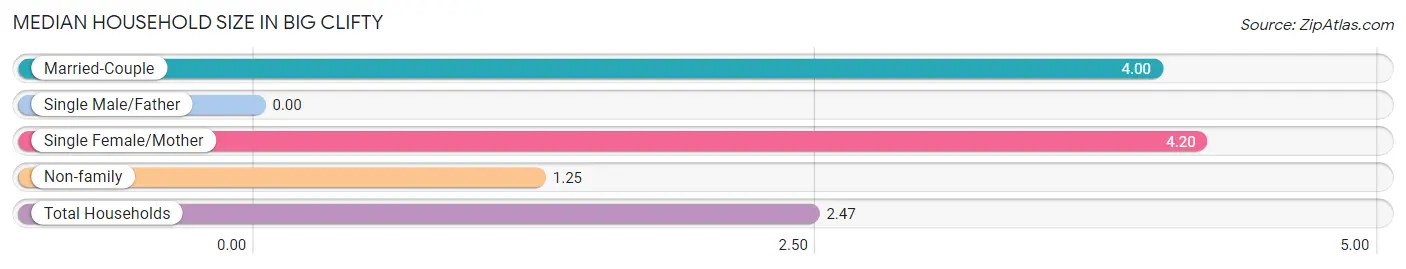
| Household Type | # Households | Household Size |
| Married-Couple | 30 (32.6%) | 4.00 |
| Single Male/Father | 0 (0.0%) | - |
| Single Female/Mother | 10 (10.9%) | 4.20 |
| Non-family | 52 (56.5%) | 1.25 |
| Total Households | 92 (100.0%) | 2.47 |
Household Size by Marriage Status in Big Clifty
Out of a total of 92 households in Big Clifty, 40 (43.5%) are family households, while 52 (56.5%) are nonfamily households. The most numerous type of family households are 2-person households, comprising 18, and the most common type of nonfamily households are 1-person households, comprising 42.
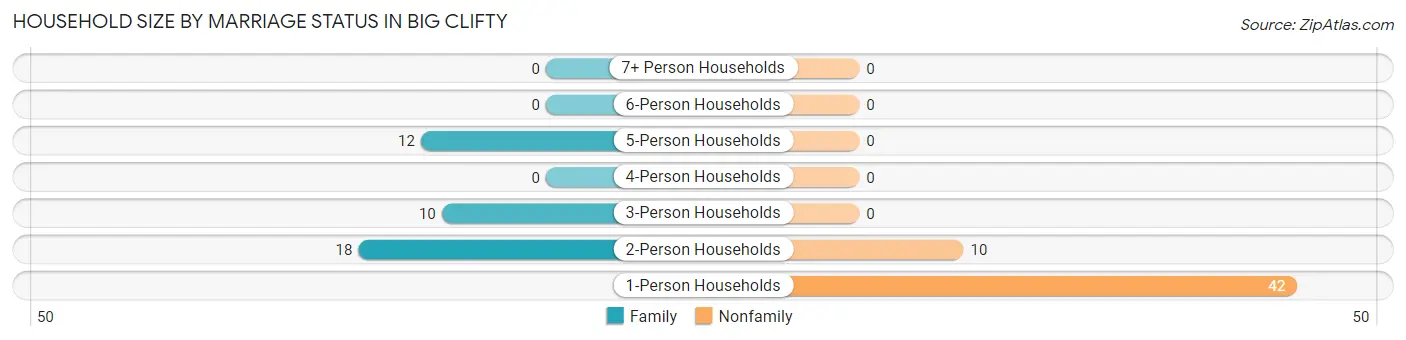
| Household Size | Family Households | Nonfamily Households |
| 1-Person Households | - | 42 (45.7%) |
| 2-Person Households | 18 (19.6%) | 10 (10.9%) |
| 3-Person Households | 10 (10.9%) | 0 (0.0%) |
| 4-Person Households | 0 (0.0%) | 0 (0.0%) |
| 5-Person Households | 12 (13.0%) | 0 (0.0%) |
| 6-Person Households | 0 (0.0%) | 0 (0.0%) |
| 7+ Person Households | 0 (0.0%) | 0 (0.0%) |
| Total | 40 (43.5%) | 52 (56.5%) |
Female Fertility in Big Clifty
Fertility by Age in Big Clifty
Average fertility rate in Big Clifty is 120.0 births per 1,000 women. Women in the age bracket of 15 to 19 years have the highest fertility rate with 1,000.0 births per 1,000 women. Women in the age bracket of 15 to 19 years acount for 100.0% of all women with births.
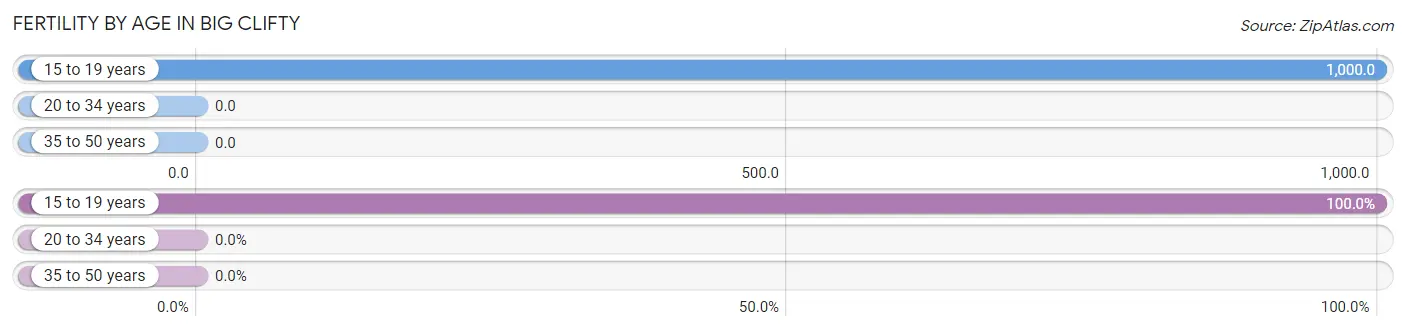
| Age Bracket | Women with Births | Births / 1,000 Women |
| 15 to 19 years | 6 (100.0%) | 1,000.0 |
| 20 to 34 years | 0 (0.0%) | 0.0 |
| 35 to 50 years | 0 (0.0%) | 0.0 |
| Total | 6 (100.0%) | 120.0 |
Fertility by Age by Marriage Status in Big Clifty
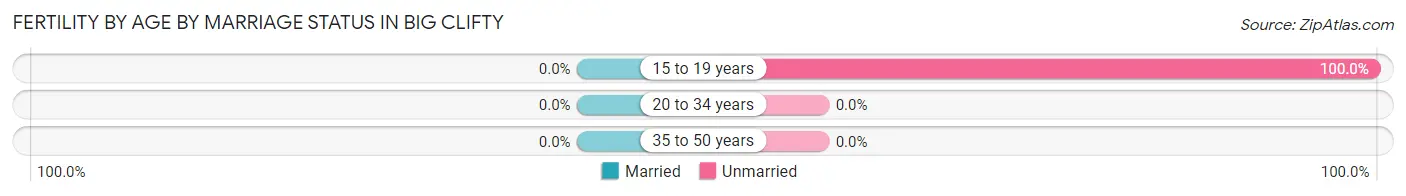
| Age Bracket | Married | Unmarried |
| 15 to 19 years | 0 (0.0%) | 6 (100.0%) |
| 20 to 34 years | 0 (0.0%) | 0 (0.0%) |
| 35 to 50 years | 0 (0.0%) | 0 (0.0%) |
| Total | 0 (0.0%) | 6 (100.0%) |
Fertility by Education in Big Clifty
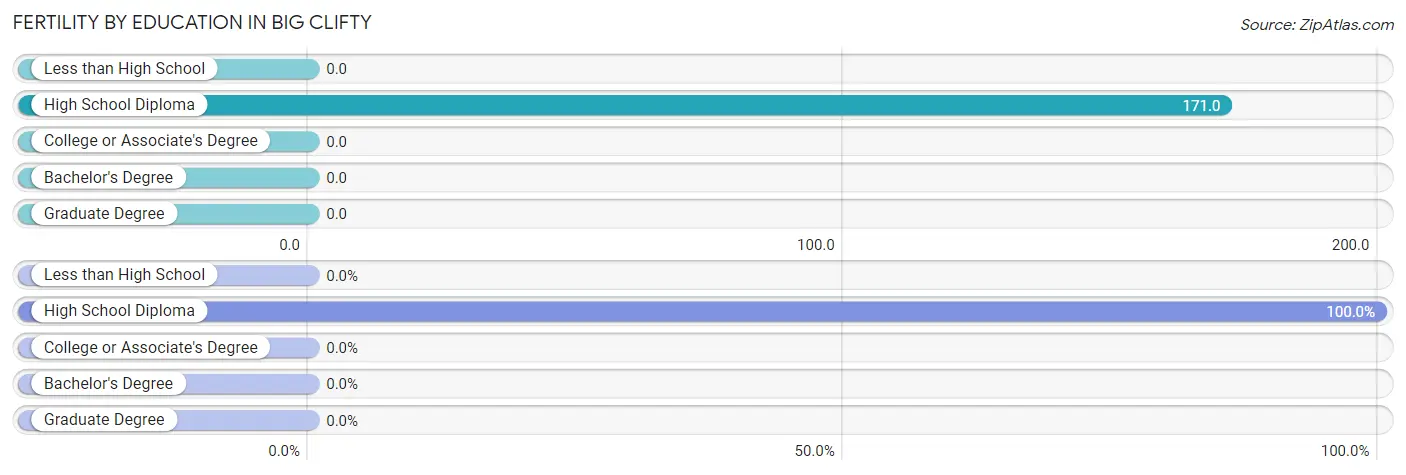
| Educational Attainment | Women with Births | Births / 1,000 Women |
| Less than High School | 0 (0.0%) | 0.0 |
| High School Diploma | 6 (100.0%) | 171.0 |
| College or Associate's Degree | 0 (0.0%) | 0.0 |
| Bachelor's Degree | 0 (0.0%) | 0.0 |
| Graduate Degree | 0 (0.0%) | 0.0 |
| Total | 6 (100.0%) | 120.0 |
Fertility by Education by Marriage Status in Big Clifty
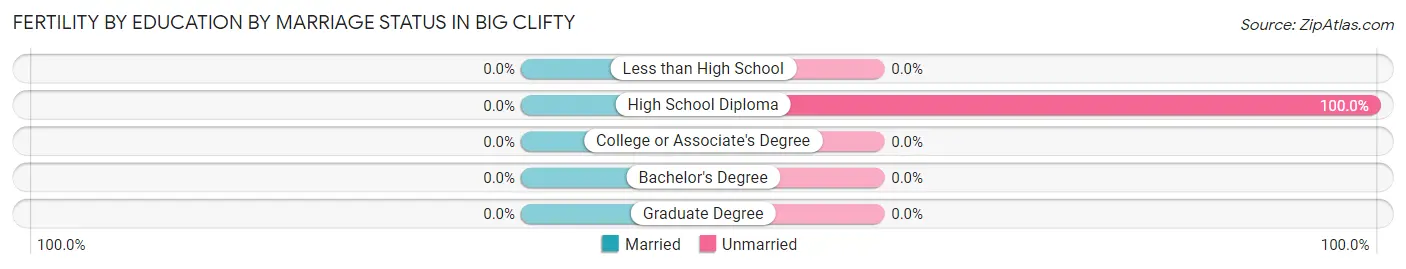
| Educational Attainment | Married | Unmarried |
| Less than High School | 0 (0.0%) | 0 (0.0%) |
| High School Diploma | 0 (0.0%) | 6 (100.0%) |
| College or Associate's Degree | 0 (0.0%) | 0 (0.0%) |
| Bachelor's Degree | 0 (0.0%) | 0 (0.0%) |
| Graduate Degree | 0 (0.0%) | 0 (0.0%) |
| Total | 0 (0.0%) | 6 (100.0%) |
Employment Characteristics in Big Clifty
Employment by Class of Employer in Big Clifty
Among the 67 employed individuals in Big Clifty, private company employees (52 | 77.6%), local government employees (9 | 13.4%), and self-employed (incorporated) (6 | 9.0%) make up the most common classes of employment.
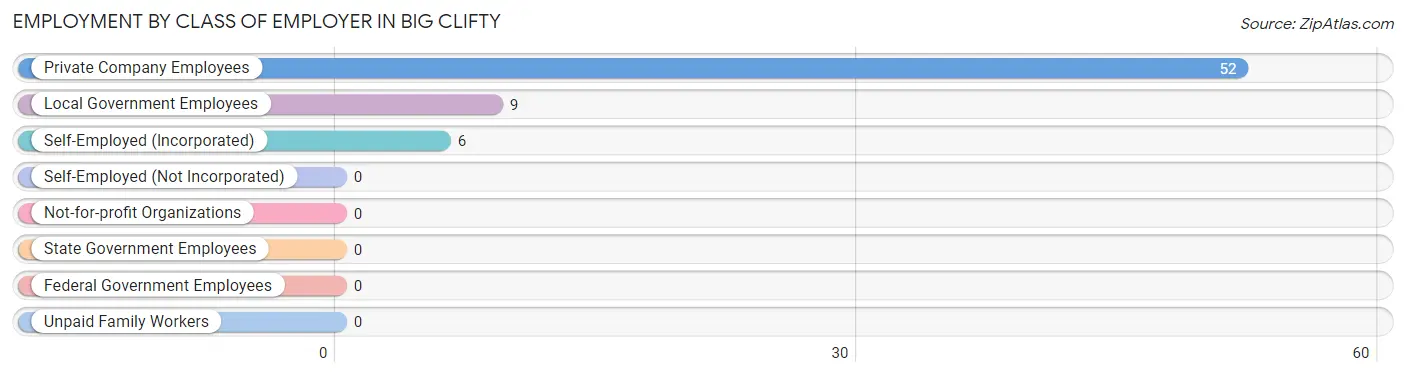
| Employer Class | # Employees | % Employees |
| Private Company Employees | 52 | 77.6% |
| Self-Employed (Incorporated) | 6 | 9.0% |
| Self-Employed (Not Incorporated) | 0 | 0.0% |
| Not-for-profit Organizations | 0 | 0.0% |
| Local Government Employees | 9 | 13.4% |
| State Government Employees | 0 | 0.0% |
| Federal Government Employees | 0 | 0.0% |
| Unpaid Family Workers | 0 | 0.0% |
| Total | 67 | 100.0% |
Employment Status by Age in Big Clifty
According to the labor force statistics for Big Clifty, out of the total population over 16 years of age (175), 46.9% or 82 individuals are in the labor force, with 18.3% or 15 of them unemployed. The age group with the highest labor force participation rate is 25 to 29 years, with 100.0% or 25 individuals in the labor force. Within the labor force, the 25 to 29 years age range has the highest percentage of unemployed individuals, with 60.0% or 15 of them being unemployed.
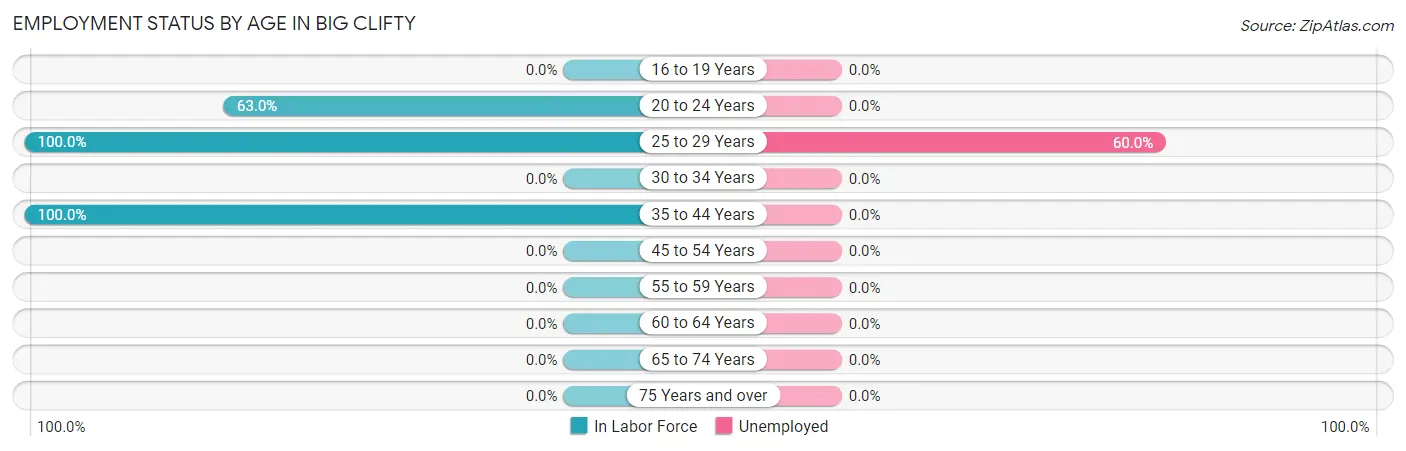
| Age Bracket | In Labor Force | Unemployed |
| 16 to 19 Years | 0 (0.0%) | 0 (0.0%) |
| 20 to 24 Years | 29 (63.0%) | 0 (0.0%) |
| 25 to 29 Years | 25 (100.0%) | 15 (60.0%) |
| 30 to 34 Years | 0 (0.0%) | 0 (0.0%) |
| 35 to 44 Years | 28 (100.0%) | 0 (0.0%) |
| 45 to 54 Years | 0 (0.0%) | 0 (0.0%) |
| 55 to 59 Years | 0 (0.0%) | 0 (0.0%) |
| 60 to 64 Years | 0 (0.0%) | 0 (0.0%) |
| 65 to 74 Years | 0 (0.0%) | 0 (0.0%) |
| 75 Years and over | 0 (0.0%) | 0 (0.0%) |
| Total | 82 (46.9%) | 15 (18.3%) |
Employment Status by Educational Attainment in Big Clifty
According to labor force statistics for Big Clifty, 77.9% of individuals (53) out of the total population between 25 and 64 years of age (68) are in the labor force, with 28.3% or 15 of them being unemployed. The group with the highest labor force participation rate are those with the educational attainment of high school diploma, with 84.4% or 38 individuals in the labor force. Within the labor force, individuals with high school diploma education have the highest percentage of unemployment, with 39.5% or 15 of them being unemployed.
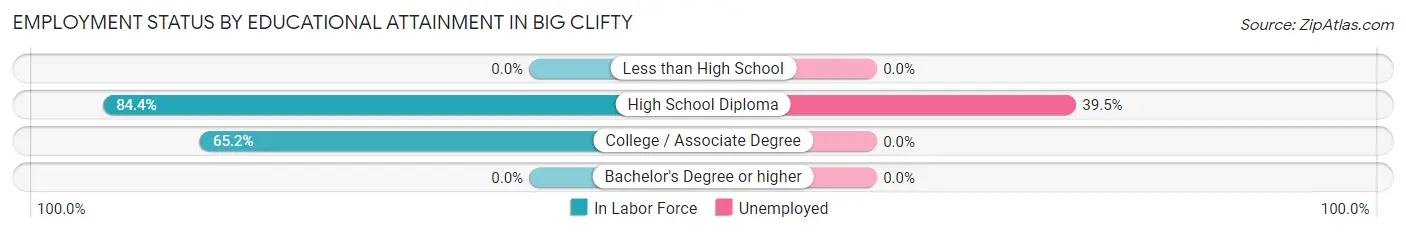
| Educational Attainment | In Labor Force | Unemployed |
| Less than High School | 0 (0.0%) | 0 (0.0%) |
| High School Diploma | 38 (84.4%) | 18 (39.5%) |
| College / Associate Degree | 15 (65.2%) | 0 (0.0%) |
| Bachelor's Degree or higher | 0 (0.0%) | 0 (0.0%) |
| Total | 53 (77.9%) | 19 (28.3%) |
Employment Occupations by Sex in Big Clifty
Management, Business, Science and Arts Occupations
The most common Management, Business, Science and Arts occupations in Big Clifty are Computers, Engineering & Science (6 | 9.0%), and Architecture & Engineering (6 | 9.0%).
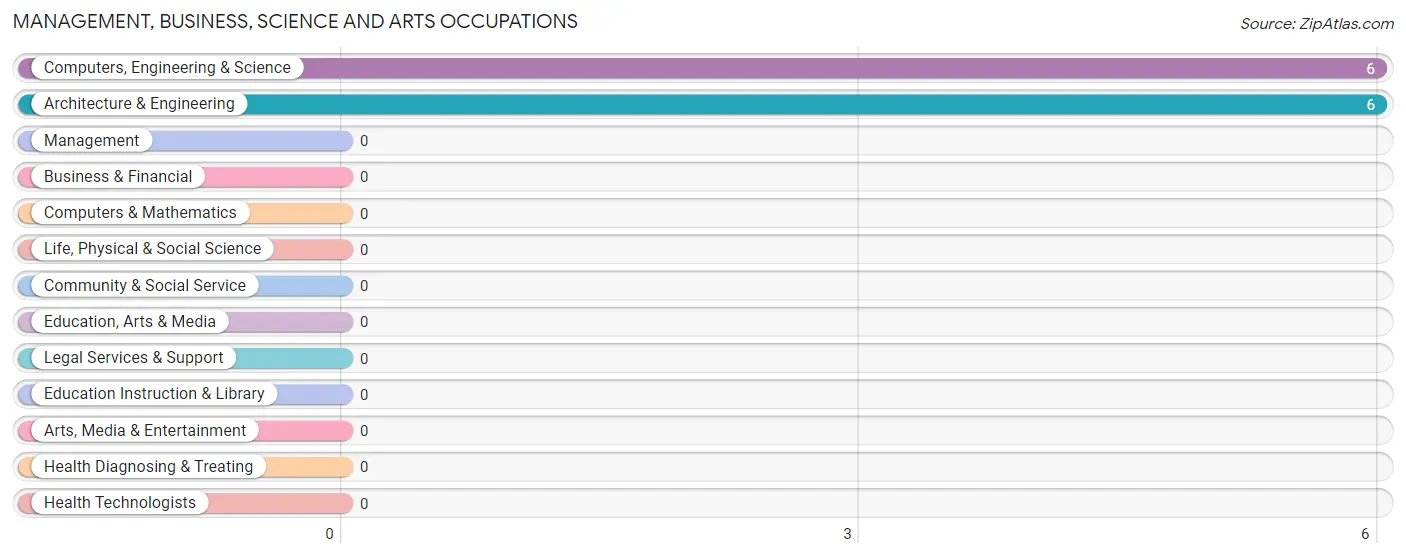
Management, Business, Science and Arts Occupations by Sex
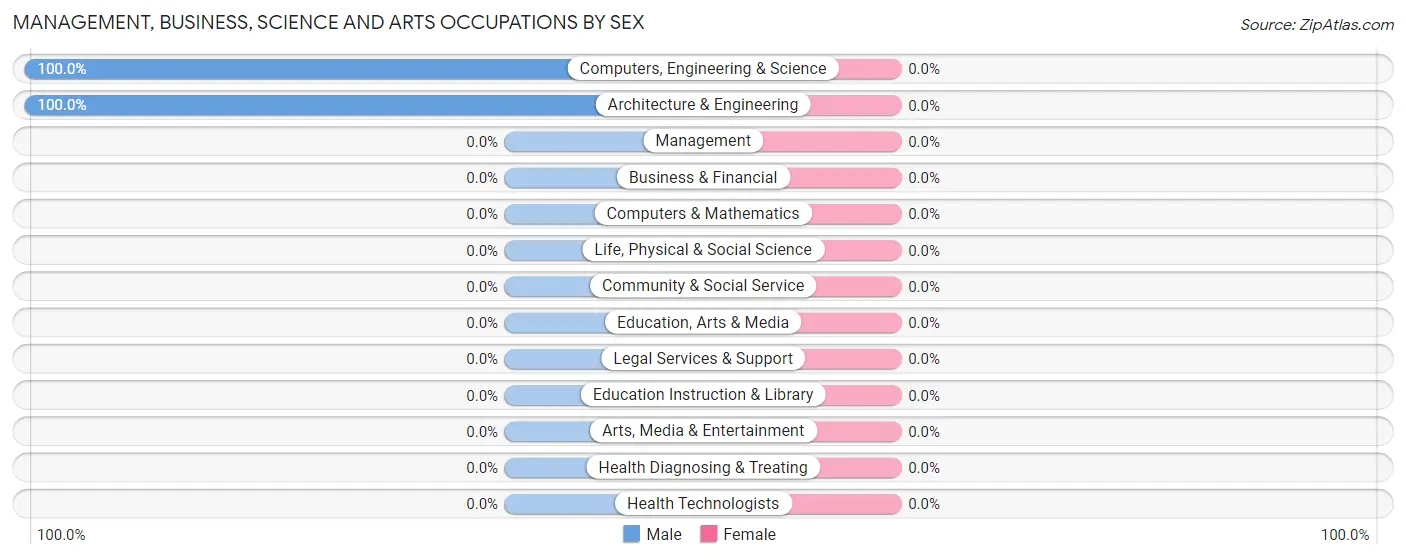
| Occupation | Male | Female |
| Management | 0 (0.0%) | 0 (0.0%) |
| Business & Financial | 0 (0.0%) | 0 (0.0%) |
| Computers, Engineering & Science | 6 (100.0%) | 0 (0.0%) |
| Computers & Mathematics | 0 (0.0%) | 0 (0.0%) |
| Architecture & Engineering | 6 (100.0%) | 0 (0.0%) |
| Life, Physical & Social Science | 0 (0.0%) | 0 (0.0%) |
| Community & Social Service | 0 (0.0%) | 0 (0.0%) |
| Education, Arts & Media | 0 (0.0%) | 0 (0.0%) |
| Legal Services & Support | 0 (0.0%) | 0 (0.0%) |
| Education Instruction & Library | 0 (0.0%) | 0 (0.0%) |
| Arts, Media & Entertainment | 0 (0.0%) | 0 (0.0%) |
| Health Diagnosing & Treating | 0 (0.0%) | 0 (0.0%) |
| Health Technologists | 0 (0.0%) | 0 (0.0%) |
| Total (Category) | 6 (100.0%) | 0 (0.0%) |
| Total (Overall) | 23 (34.3%) | 44 (65.7%) |
Services Occupations
The most common Services occupations in Big Clifty are , and Food Preparation & Serving (6 | 9.0%).
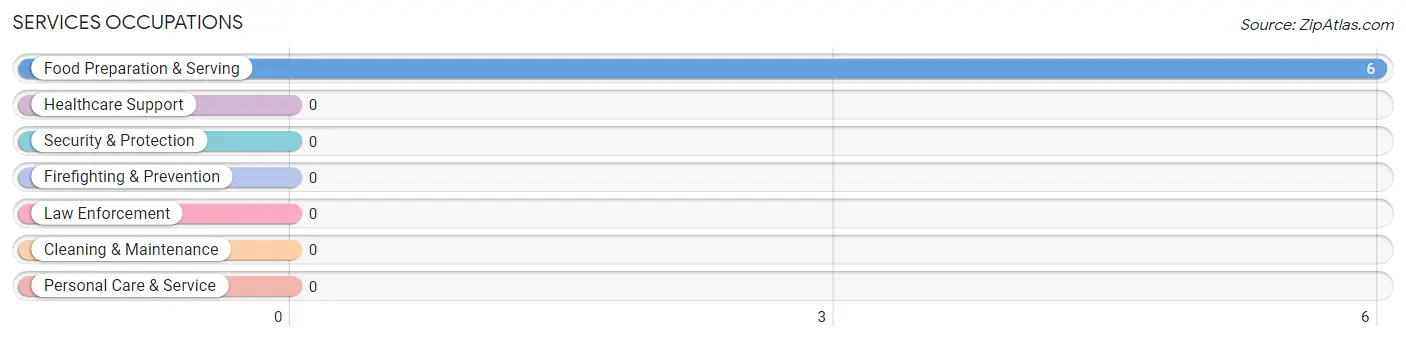
Services Occupations by Sex
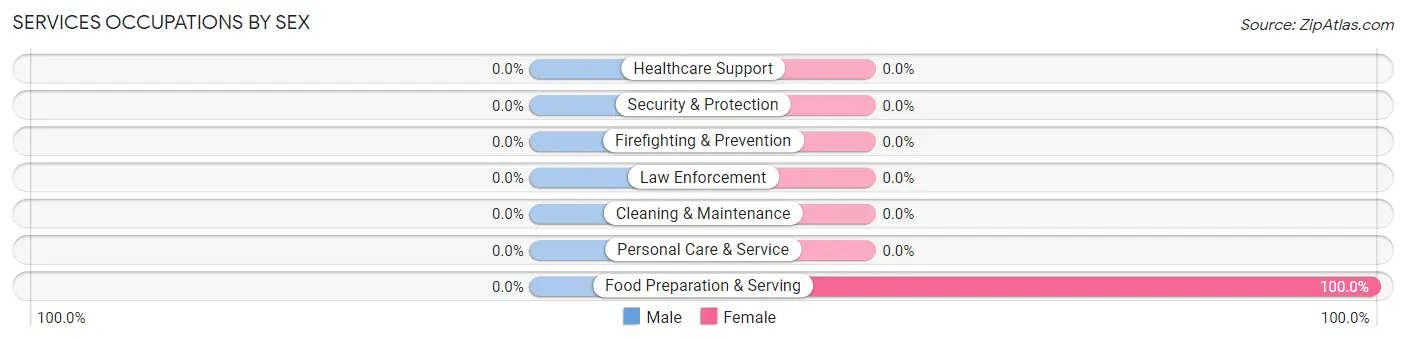
| Occupation | Male | Female |
| Healthcare Support | 0 (0.0%) | 0 (0.0%) |
| Security & Protection | 0 (0.0%) | 0 (0.0%) |
| Firefighting & Prevention | 0 (0.0%) | 0 (0.0%) |
| Law Enforcement | 0 (0.0%) | 0 (0.0%) |
| Food Preparation & Serving | 0 (0.0%) | 6 (100.0%) |
| Cleaning & Maintenance | 0 (0.0%) | 0 (0.0%) |
| Personal Care & Service | 0 (0.0%) | 0 (0.0%) |
| Total (Category) | 0 (0.0%) | 6 (100.0%) |
| Total (Overall) | 23 (34.3%) | 44 (65.7%) |
Sales and Office Occupations
The most common Sales and Office occupations in Big Clifty are , and Office & Administration (9 | 13.4%).
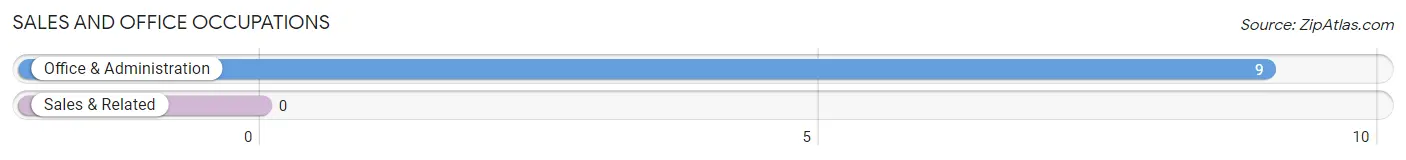
Sales and Office Occupations by Sex
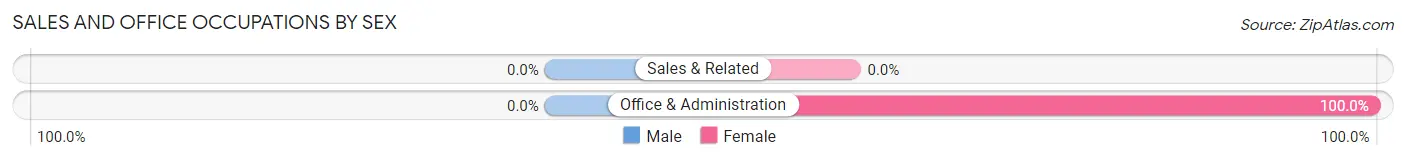
| Occupation | Male | Female |
| Sales & Related | 0 (0.0%) | 0 (0.0%) |
| Office & Administration | 0 (0.0%) | 9 (100.0%) |
| Total (Category) | 0 (0.0%) | 9 (100.0%) |
| Total (Overall) | 23 (34.3%) | 44 (65.7%) |
Natural Resources, Construction and Maintenance Occupations
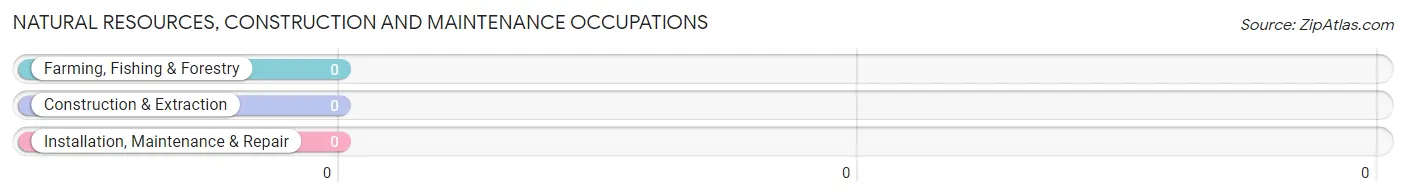
Natural Resources, Construction and Maintenance Occupations by Sex
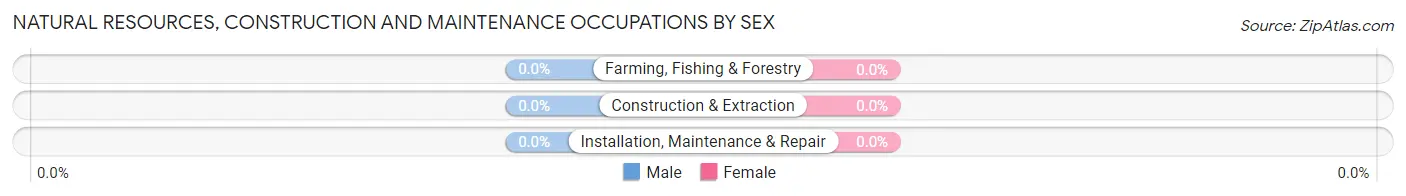
| Occupation | Male | Female |
| Farming, Fishing & Forestry | 0 (0.0%) | 0 (0.0%) |
| Construction & Extraction | 0 (0.0%) | 0 (0.0%) |
| Installation, Maintenance & Repair | 0 (0.0%) | 0 (0.0%) |
| Total (Category) | 0 (0.0%) | 0 (0.0%) |
| Total (Overall) | 23 (34.3%) | 44 (65.7%) |
Production, Transportation and Moving Occupations
The most common Production, Transportation and Moving occupations in Big Clifty are , and Production (46 | 68.7%).
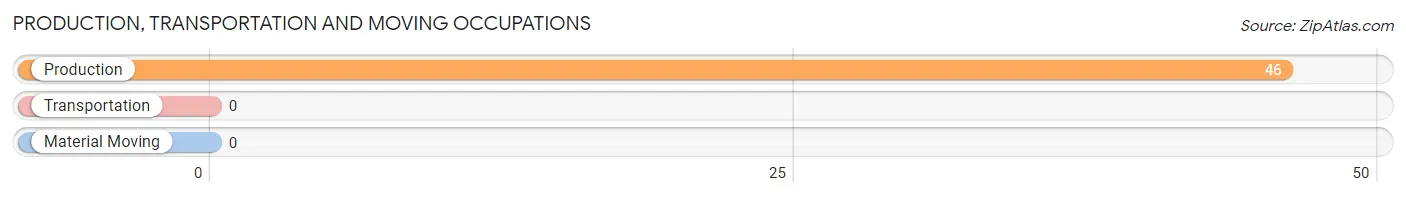
Production, Transportation and Moving Occupations by Sex
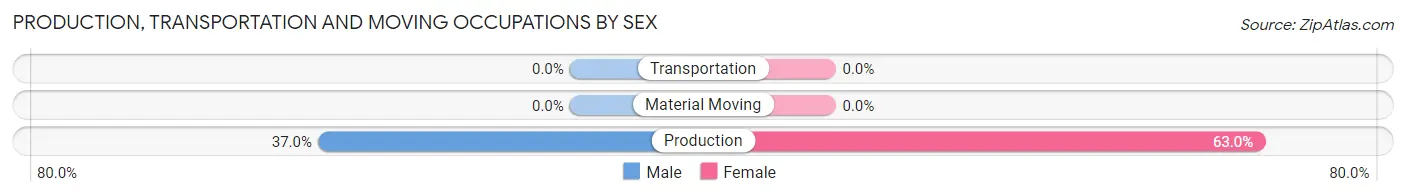
| Occupation | Male | Female |
| Production | 17 (37.0%) | 29 (63.0%) |
| Transportation | 0 (0.0%) | 0 (0.0%) |
| Material Moving | 0 (0.0%) | 0 (0.0%) |
| Total (Category) | 17 (37.0%) | 29 (63.0%) |
| Total (Overall) | 23 (34.3%) | 44 (65.7%) |
Employment Industries by Sex in Big Clifty
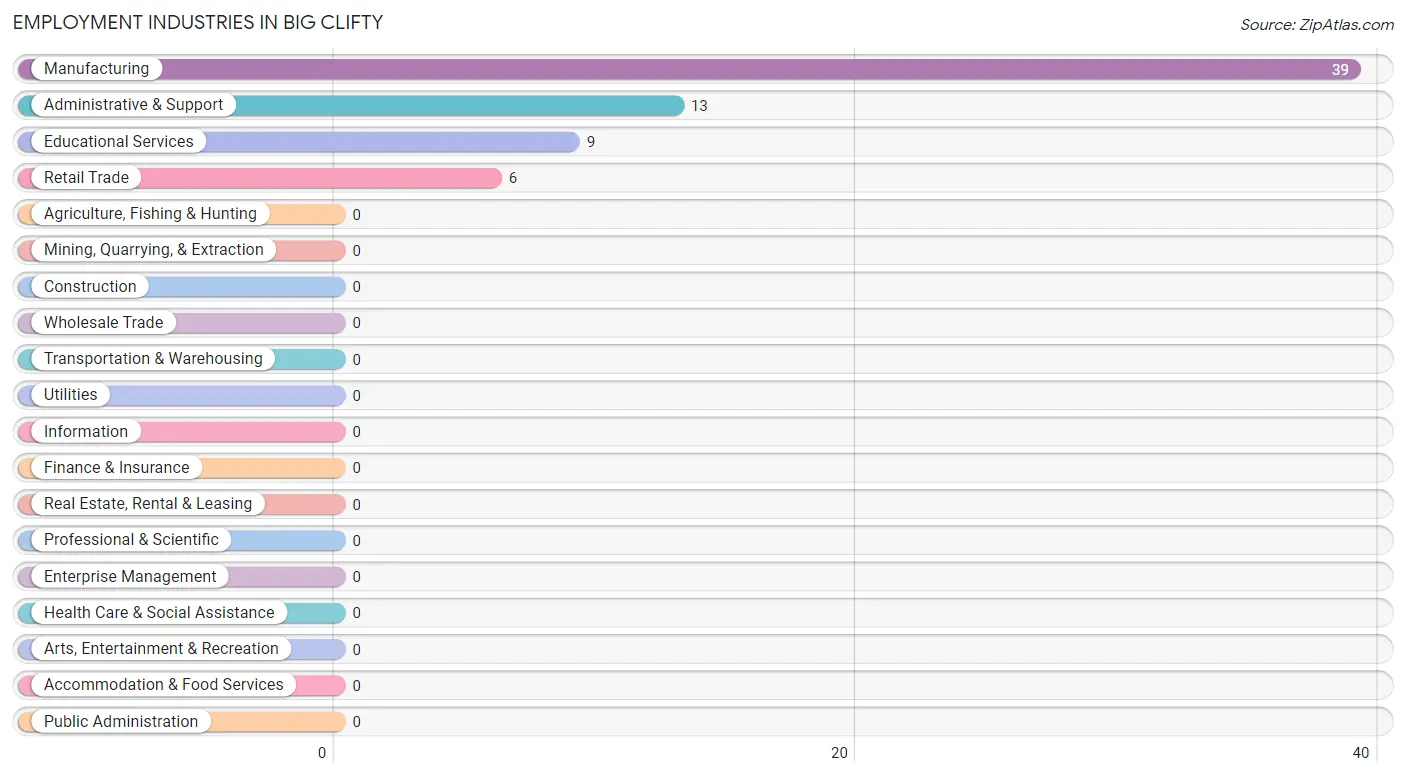
Employment Industries in Big Clifty
The major employment industries in Big Clifty include Manufacturing (39 | 58.2%), Administrative & Support (13 | 19.4%), Educational Services (9 | 13.4%), and Retail Trade (6 | 9.0%).
Employment Industries by Sex in Big Clifty
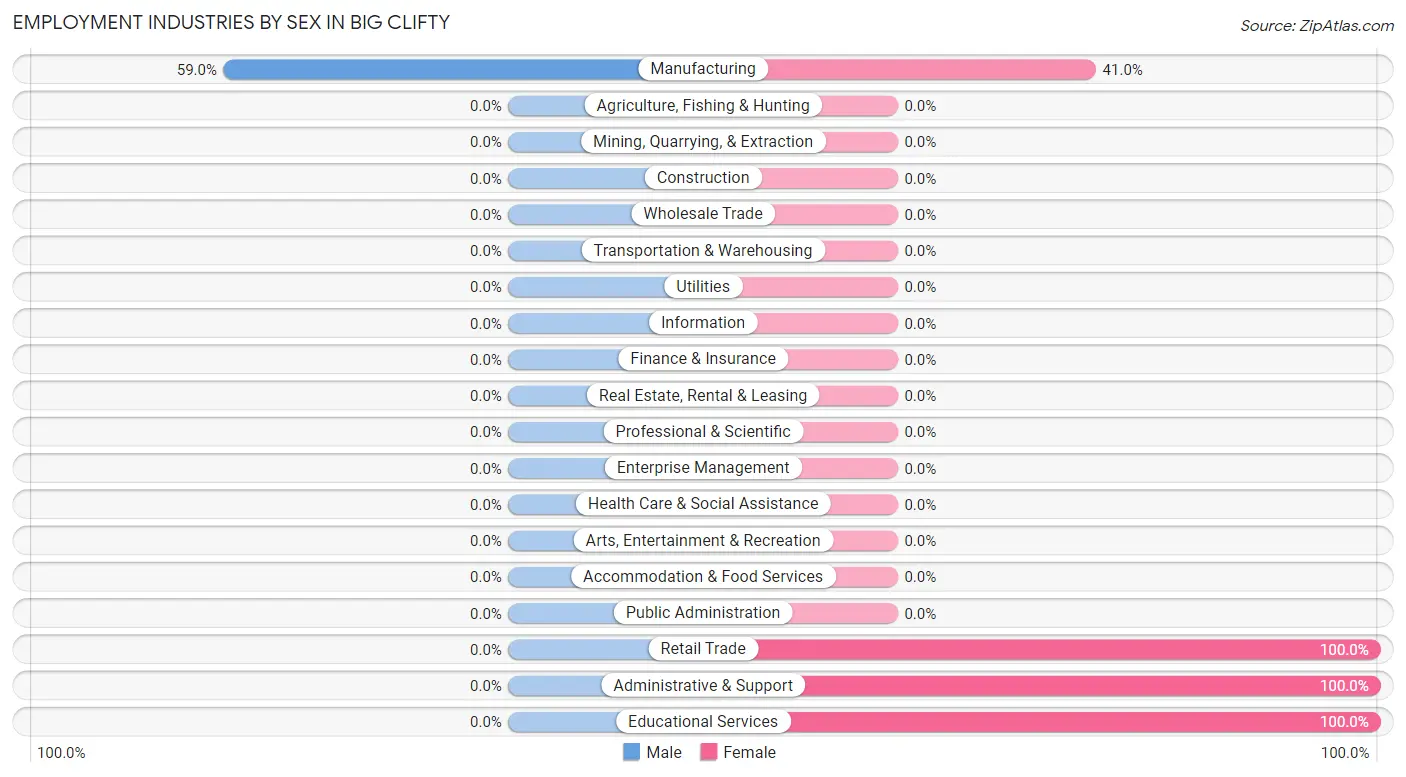
| Industry | Male | Female |
| Agriculture, Fishing & Hunting | 0 (0.0%) | 0 (0.0%) |
| Mining, Quarrying, & Extraction | 0 (0.0%) | 0 (0.0%) |
| Construction | 0 (0.0%) | 0 (0.0%) |
| Manufacturing | 23 (59.0%) | 16 (41.0%) |
| Wholesale Trade | 0 (0.0%) | 0 (0.0%) |
| Retail Trade | 0 (0.0%) | 6 (100.0%) |
| Transportation & Warehousing | 0 (0.0%) | 0 (0.0%) |
| Utilities | 0 (0.0%) | 0 (0.0%) |
| Information | 0 (0.0%) | 0 (0.0%) |
| Finance & Insurance | 0 (0.0%) | 0 (0.0%) |
| Real Estate, Rental & Leasing | 0 (0.0%) | 0 (0.0%) |
| Professional & Scientific | 0 (0.0%) | 0 (0.0%) |
| Enterprise Management | 0 (0.0%) | 0 (0.0%) |
| Administrative & Support | 0 (0.0%) | 13 (100.0%) |
| Educational Services | 0 (0.0%) | 9 (100.0%) |
| Health Care & Social Assistance | 0 (0.0%) | 0 (0.0%) |
| Arts, Entertainment & Recreation | 0 (0.0%) | 0 (0.0%) |
| Accommodation & Food Services | 0 (0.0%) | 0 (0.0%) |
| Public Administration | 0 (0.0%) | 0 (0.0%) |
| Total | 23 (34.3%) | 44 (65.7%) |
Education in Big Clifty
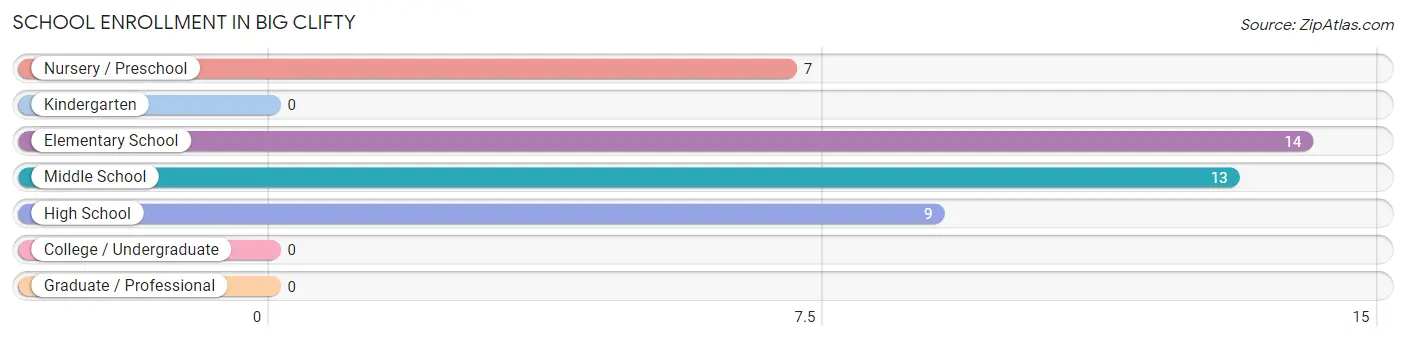
School Enrollment in Big Clifty
The most common levels of schooling among the 43 students in Big Clifty are elementary school (14 | 32.6%), middle school (13 | 30.2%), and high school (9 | 20.9%).
| School Level | # Students | % Students |
| Nursery / Preschool | 7 | 16.3% |
| Kindergarten | 0 | 0.0% |
| Elementary School | 14 | 32.6% |
| Middle School | 13 | 30.2% |
| High School | 9 | 20.9% |
| College / Undergraduate | 0 | 0.0% |
| Graduate / Professional | 0 | 0.0% |
| Total | 43 | 100.0% |
School Enrollment by Age by Funding Source in Big Clifty
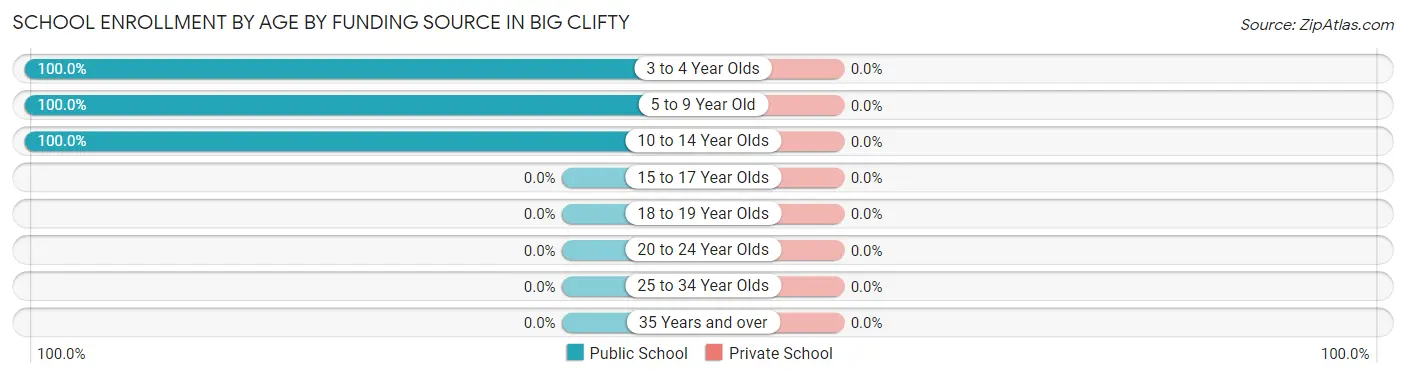
| Age Bracket | Public School | Private School |
| 3 to 4 Year Olds | 7 (100.0%) | 0 (0.0%) |
| 5 to 9 Year Old | 14 (100.0%) | 0 (0.0%) |
| 10 to 14 Year Olds | 22 (100.0%) | 0 (0.0%) |
| 15 to 17 Year Olds | 0 (0.0%) | 0 (0.0%) |
| 18 to 19 Year Olds | 0 (0.0%) | 0 (0.0%) |
| 20 to 24 Year Olds | 0 (0.0%) | 0 (0.0%) |
| 25 to 34 Year Olds | 0 (0.0%) | 0 (0.0%) |
| 35 Years and over | 0 (0.0%) | 0 (0.0%) |
| Total | 43 (100.0%) | 0 (0.0%) |
Educational Attainment by Field of Study in Big Clifty
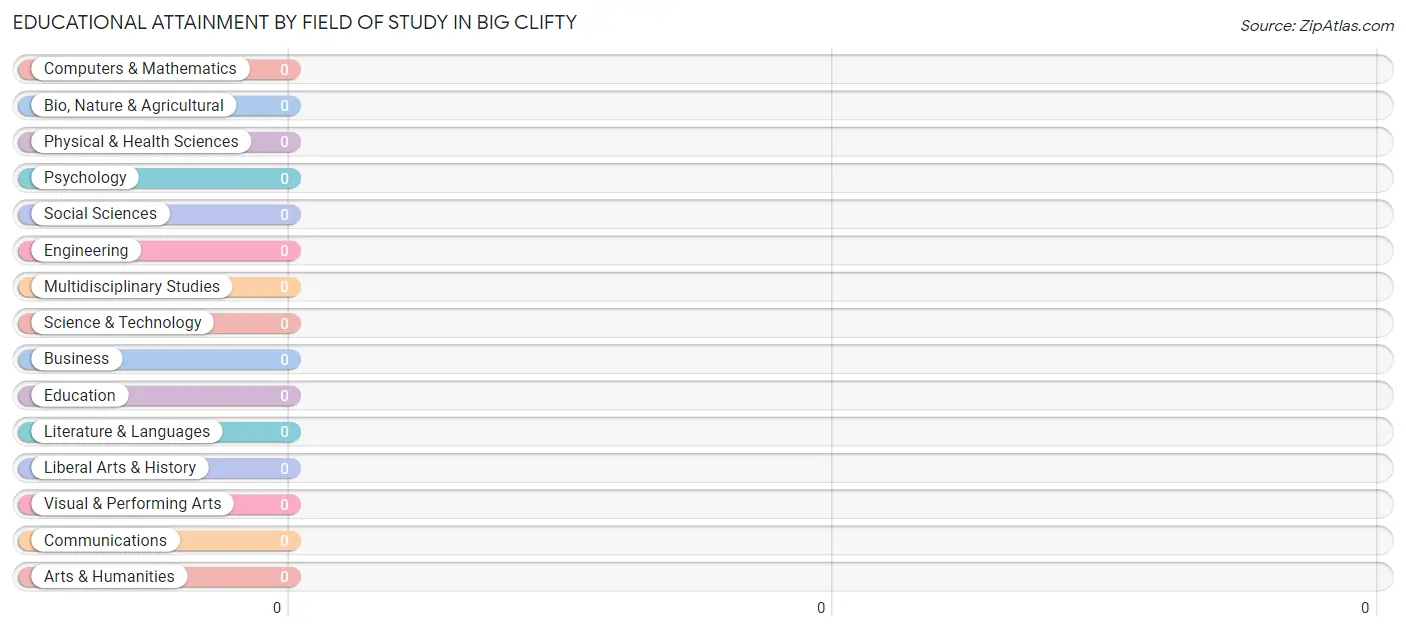
| Field of Study | # Graduates | % Graduates |
| Computers & Mathematics | 0 | 0.0% |
| Bio, Nature & Agricultural | 0 | 0.0% |
| Physical & Health Sciences | 0 | 0.0% |
| Psychology | 0 | 0.0% |
| Social Sciences | 0 | 0.0% |
| Engineering | 0 | 0.0% |
| Multidisciplinary Studies | 0 | 0.0% |
| Science & Technology | 0 | 0.0% |
| Business | 0 | 0.0% |
| Education | 0 | 0.0% |
| Literature & Languages | 0 | 0.0% |
| Liberal Arts & History | 0 | 0.0% |
| Visual & Performing Arts | 0 | 0.0% |
| Communications | 0 | 0.0% |
| Arts & Humanities | 0 | 0.0% |
| Total | 0 | 0.0% |
Transportation & Commute in Big Clifty
Vehicle Availability by Sex in Big Clifty
The most prevalent vehicle ownership categories in Big Clifty are males with 2 vehicles (13, accounting for 56.5%) and females with 2 vehicles (15, making up 29.5%).
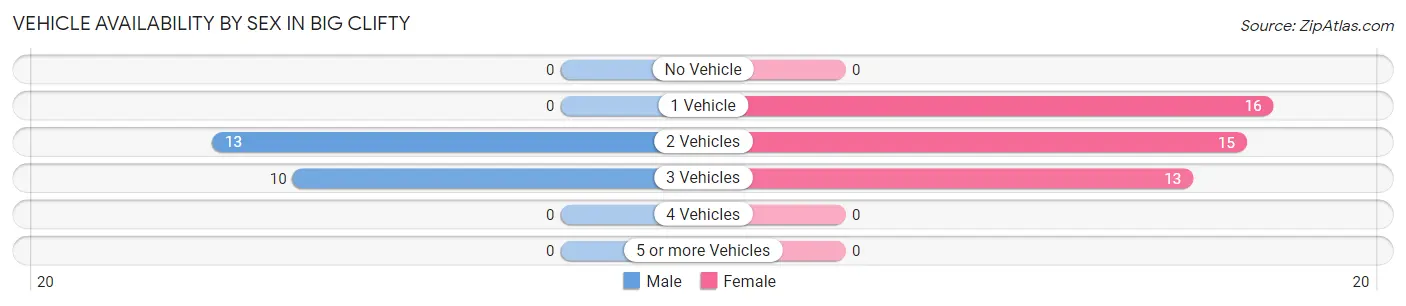
| Vehicles Available | Male | Female |
| No Vehicle | 0 (0.0%) | 0 (0.0%) |
| 1 Vehicle | 0 (0.0%) | 16 (36.4%) |
| 2 Vehicles | 13 (56.5%) | 15 (34.1%) |
| 3 Vehicles | 10 (43.5%) | 13 (29.5%) |
| 4 Vehicles | 0 (0.0%) | 0 (0.0%) |
| 5 or more Vehicles | 0 (0.0%) | 0 (0.0%) |
| Total | 23 (100.0%) | 44 (100.0%) |
Commute Time in Big Clifty
The most frequently occuring commute durations in Big Clifty are 25 to 29 minutes (26 commuters, 38.8%), 15 to 19 minutes (13 commuters, 19.4%), and 60 to 89 minutes (13 commuters, 19.4%).
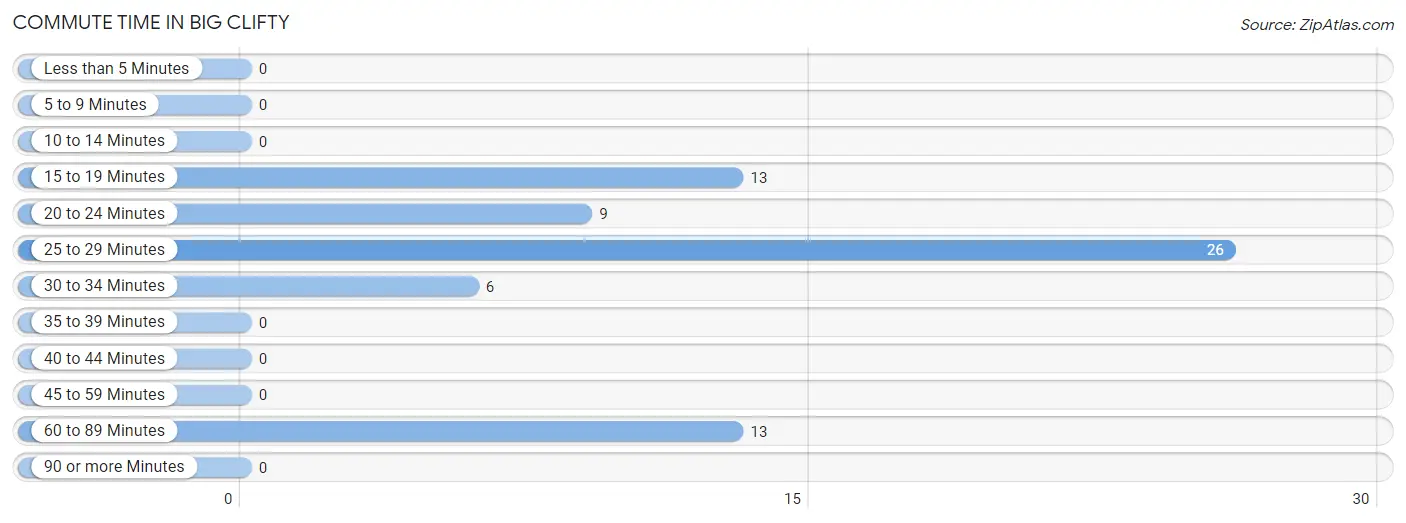
| Commute Time | # Commuters | % Commuters |
| Less than 5 Minutes | 0 | 0.0% |
| 5 to 9 Minutes | 0 | 0.0% |
| 10 to 14 Minutes | 0 | 0.0% |
| 15 to 19 Minutes | 13 | 19.4% |
| 20 to 24 Minutes | 9 | 13.4% |
| 25 to 29 Minutes | 26 | 38.8% |
| 30 to 34 Minutes | 6 | 9.0% |
| 35 to 39 Minutes | 0 | 0.0% |
| 40 to 44 Minutes | 0 | 0.0% |
| 45 to 59 Minutes | 0 | 0.0% |
| 60 to 89 Minutes | 13 | 19.4% |
| 90 or more Minutes | 0 | 0.0% |
Commute Time by Sex in Big Clifty
The most common commute times in Big Clifty are 60 to 89 minutes (13 commuters, 56.5%) for males and 25 to 29 minutes (16 commuters, 36.4%) for females.
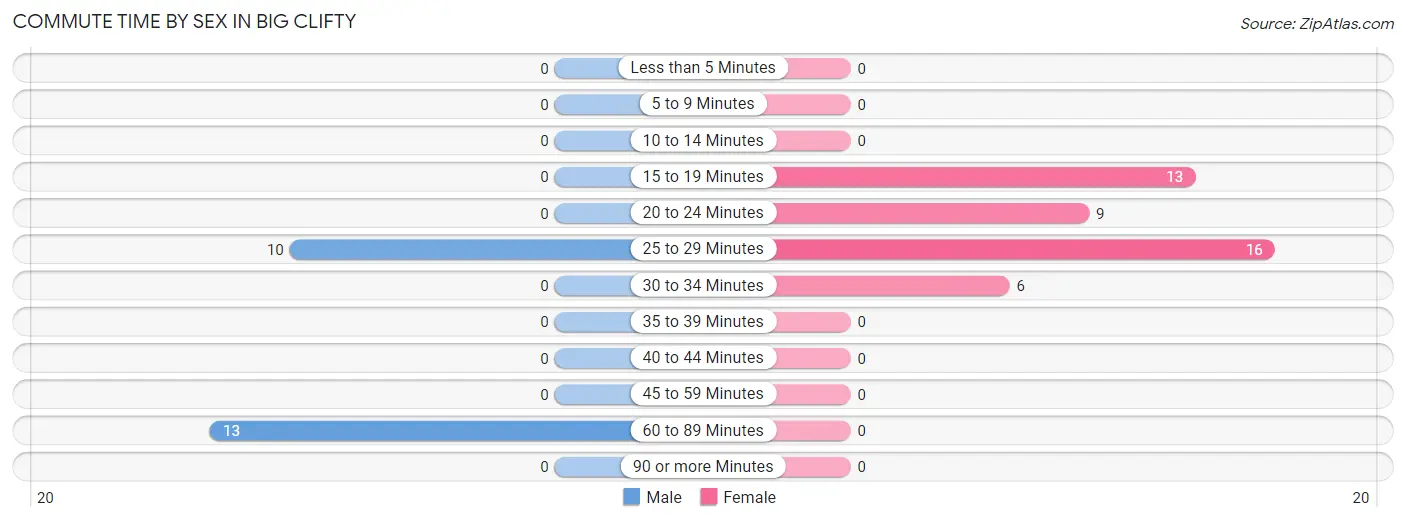
| Commute Time | Male | Female |
| Less than 5 Minutes | 0 (0.0%) | 0 (0.0%) |
| 5 to 9 Minutes | 0 (0.0%) | 0 (0.0%) |
| 10 to 14 Minutes | 0 (0.0%) | 0 (0.0%) |
| 15 to 19 Minutes | 0 (0.0%) | 13 (29.5%) |
| 20 to 24 Minutes | 0 (0.0%) | 9 (20.4%) |
| 25 to 29 Minutes | 10 (43.5%) | 16 (36.4%) |
| 30 to 34 Minutes | 0 (0.0%) | 6 (13.6%) |
| 35 to 39 Minutes | 0 (0.0%) | 0 (0.0%) |
| 40 to 44 Minutes | 0 (0.0%) | 0 (0.0%) |
| 45 to 59 Minutes | 0 (0.0%) | 0 (0.0%) |
| 60 to 89 Minutes | 13 (56.5%) | 0 (0.0%) |
| 90 or more Minutes | 0 (0.0%) | 0 (0.0%) |
Time of Departure to Work by Sex in Big Clifty
The most frequent times of departure to work in Big Clifty are 7:00 AM to 7:29 AM (10, 43.5%) for males and 4:00 PM to 11:59 PM (16, 36.4%) for females.
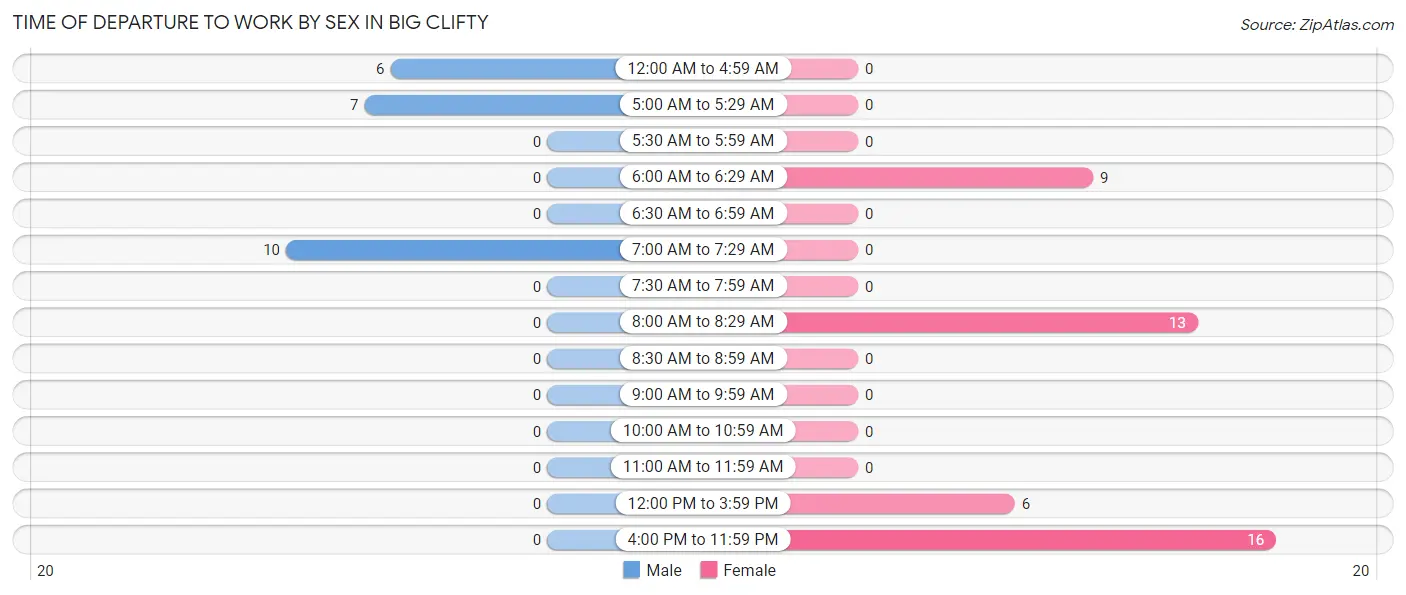
| Time of Departure | Male | Female |
| 12:00 AM to 4:59 AM | 6 (26.1%) | 0 (0.0%) |
| 5:00 AM to 5:29 AM | 7 (30.4%) | 0 (0.0%) |
| 5:30 AM to 5:59 AM | 0 (0.0%) | 0 (0.0%) |
| 6:00 AM to 6:29 AM | 0 (0.0%) | 9 (20.4%) |
| 6:30 AM to 6:59 AM | 0 (0.0%) | 0 (0.0%) |
| 7:00 AM to 7:29 AM | 10 (43.5%) | 0 (0.0%) |
| 7:30 AM to 7:59 AM | 0 (0.0%) | 0 (0.0%) |
| 8:00 AM to 8:29 AM | 0 (0.0%) | 13 (29.5%) |
| 8:30 AM to 8:59 AM | 0 (0.0%) | 0 (0.0%) |
| 9:00 AM to 9:59 AM | 0 (0.0%) | 0 (0.0%) |
| 10:00 AM to 10:59 AM | 0 (0.0%) | 0 (0.0%) |
| 11:00 AM to 11:59 AM | 0 (0.0%) | 0 (0.0%) |
| 12:00 PM to 3:59 PM | 0 (0.0%) | 6 (13.6%) |
| 4:00 PM to 11:59 PM | 0 (0.0%) | 16 (36.4%) |
| Total | 23 (100.0%) | 44 (100.0%) |
Housing Occupancy in Big Clifty
Occupancy by Ownership in Big Clifty
Of the total 92 dwellings in Big Clifty, owner-occupied units account for 60 (65.2%), while renter-occupied units make up 32 (34.8%).
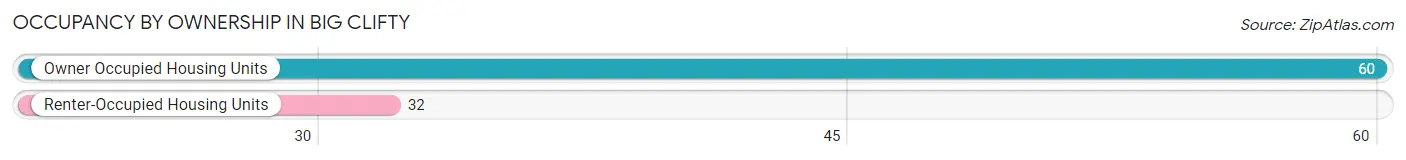
| Occupancy | # Housing Units | % Housing Units |
| Owner Occupied Housing Units | 60 | 65.2% |
| Renter-Occupied Housing Units | 32 | 34.8% |
| Total Occupied Housing Units | 92 | 100.0% |
Occupancy by Household Size in Big Clifty
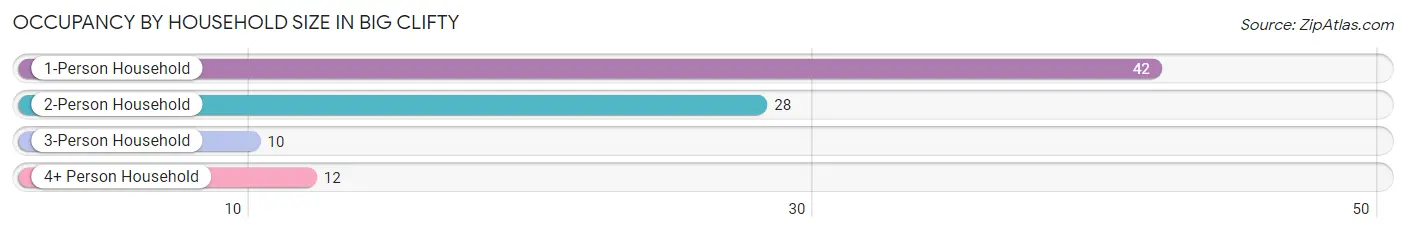
| Household Size | # Housing Units | % Housing Units |
| 1-Person Household | 42 | 45.7% |
| 2-Person Household | 28 | 30.4% |
| 3-Person Household | 10 | 10.9% |
| 4+ Person Household | 12 | 13.0% |
| Total Housing Units | 92 | 100.0% |
Occupancy by Ownership by Household Size in Big Clifty
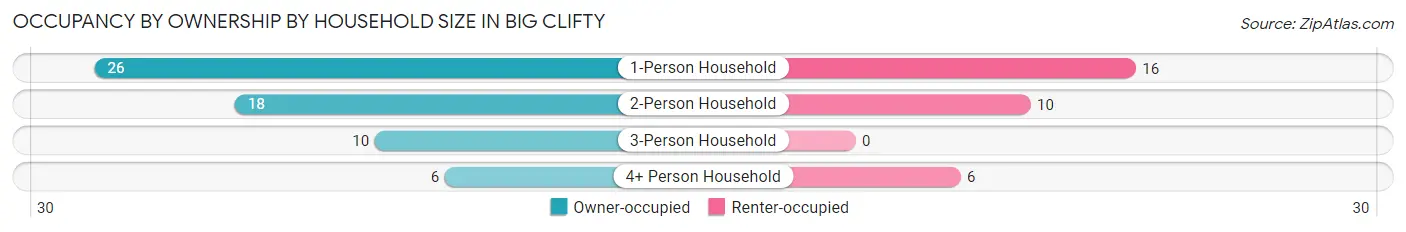
| Household Size | Owner-occupied | Renter-occupied |
| 1-Person Household | 26 (61.9%) | 16 (38.1%) |
| 2-Person Household | 18 (64.3%) | 10 (35.7%) |
| 3-Person Household | 10 (100.0%) | 0 (0.0%) |
| 4+ Person Household | 6 (50.0%) | 6 (50.0%) |
| Total Housing Units | 60 (65.2%) | 32 (34.8%) |
Occupancy by Educational Attainment in Big Clifty
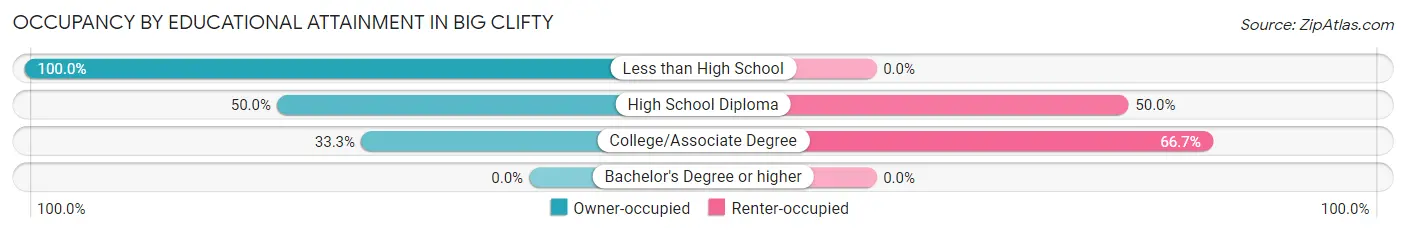
| Household Size | Owner-occupied | Renter-occupied |
| Less than High School | 36 (100.0%) | 0 (0.0%) |
| High School Diploma | 16 (50.0%) | 16 (50.0%) |
| College/Associate Degree | 8 (33.3%) | 16 (66.7%) |
| Bachelor's Degree or higher | 0 (0.0%) | 0 (0.0%) |
Occupancy by Age of Householder in Big Clifty
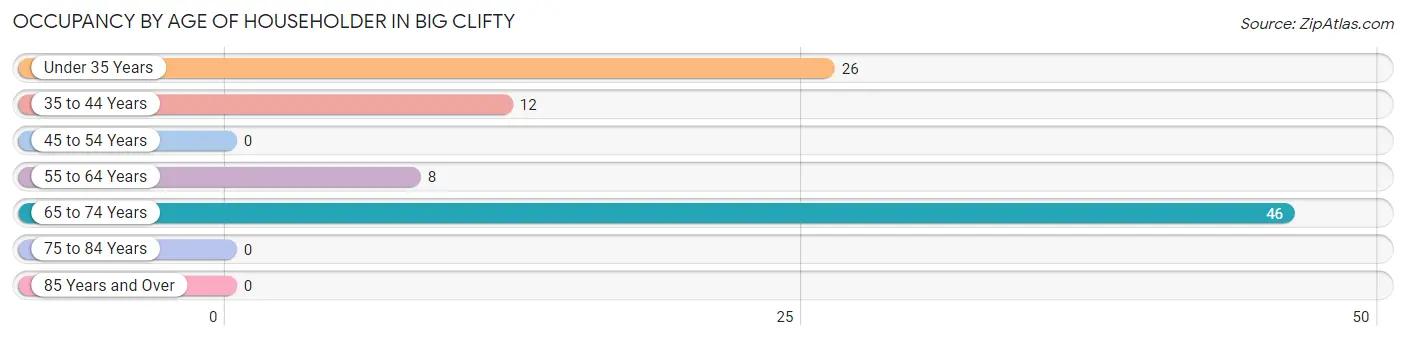
| Age Bracket | # Households | % Households |
| Under 35 Years | 26 | 28.3% |
| 35 to 44 Years | 12 | 13.0% |
| 45 to 54 Years | 0 | 0.0% |
| 55 to 64 Years | 8 | 8.7% |
| 65 to 74 Years | 46 | 50.0% |
| 75 to 84 Years | 0 | 0.0% |
| 85 Years and Over | 0 | 0.0% |
| Total | 92 | 100.0% |
Housing Finances in Big Clifty
Median Income by Occupancy in Big Clifty
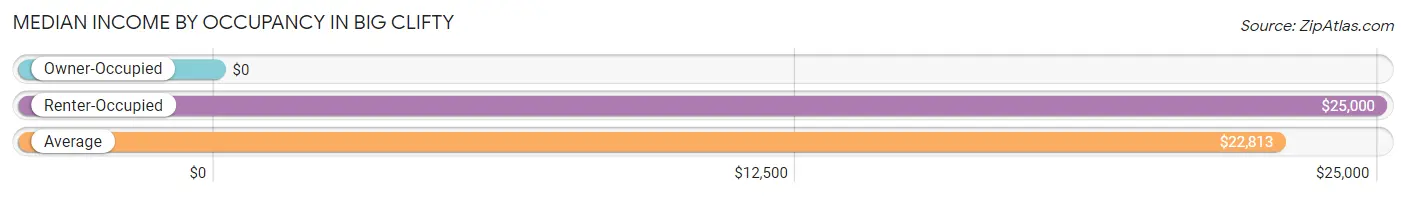
| Occupancy Type | # Households | Median Income |
| Owner-Occupied | 60 (65.2%) | $0 |
| Renter-Occupied | 32 (34.8%) | $25,000 |
| Average | 92 (100.0%) | $22,813 |
Occupancy by Householder Income Bracket in Big Clifty
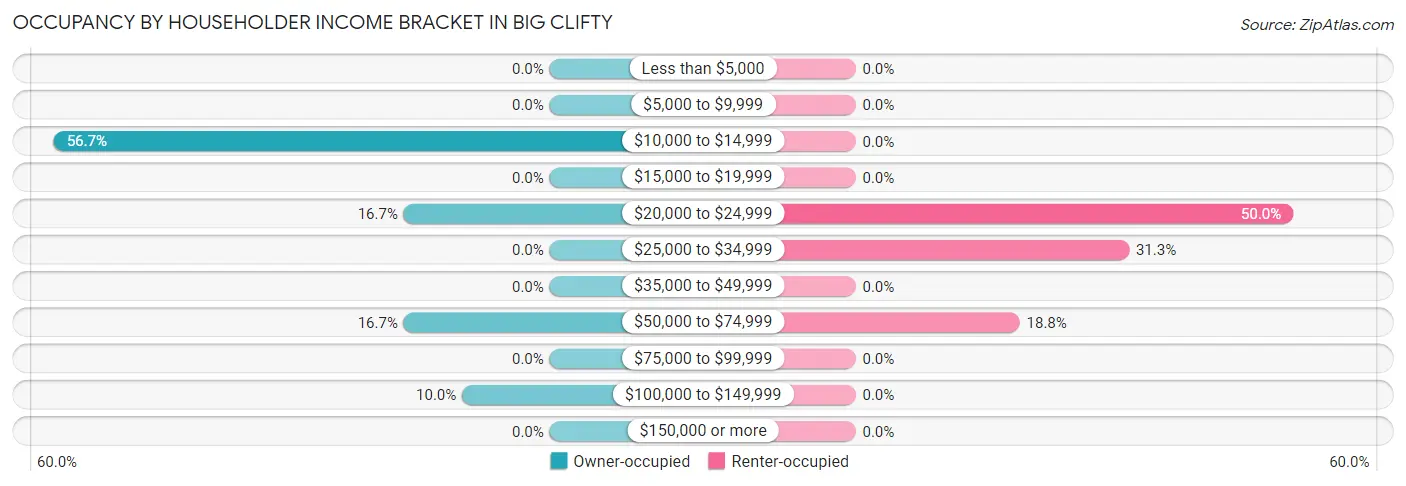
| Income Bracket | Owner-occupied | Renter-occupied |
| Less than $5,000 | 0 (0.0%) | 0 (0.0%) |
| $5,000 to $9,999 | 0 (0.0%) | 0 (0.0%) |
| $10,000 to $14,999 | 34 (56.7%) | 0 (0.0%) |
| $15,000 to $19,999 | 0 (0.0%) | 0 (0.0%) |
| $20,000 to $24,999 | 10 (16.7%) | 16 (50.0%) |
| $25,000 to $34,999 | 0 (0.0%) | 10 (31.2%) |
| $35,000 to $49,999 | 0 (0.0%) | 0 (0.0%) |
| $50,000 to $74,999 | 10 (16.7%) | 6 (18.8%) |
| $75,000 to $99,999 | 0 (0.0%) | 0 (0.0%) |
| $100,000 to $149,999 | 6 (10.0%) | 0 (0.0%) |
| $150,000 or more | 0 (0.0%) | 0 (0.0%) |
| Total | 60 (100.0%) | 32 (100.0%) |
Monthly Housing Cost Tiers in Big Clifty
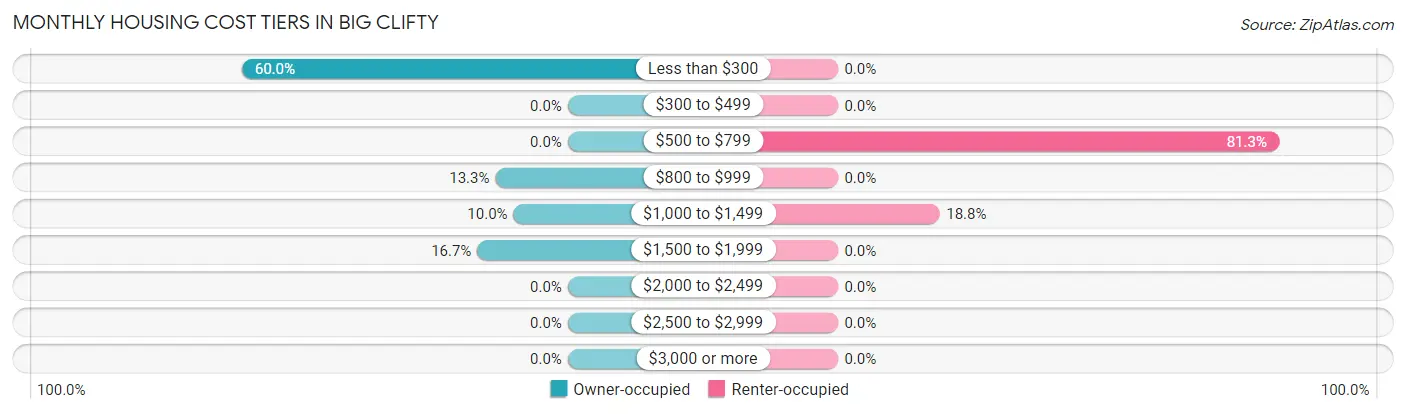
| Monthly Cost | Owner-occupied | Renter-occupied |
| Less than $300 | 36 (60.0%) | 0 (0.0%) |
| $300 to $499 | 0 (0.0%) | 0 (0.0%) |
| $500 to $799 | 0 (0.0%) | 26 (81.2%) |
| $800 to $999 | 8 (13.3%) | 0 (0.0%) |
| $1,000 to $1,499 | 6 (10.0%) | 6 (18.8%) |
| $1,500 to $1,999 | 10 (16.7%) | 0 (0.0%) |
| $2,000 to $2,499 | 0 (0.0%) | 0 (0.0%) |
| $2,500 to $2,999 | 0 (0.0%) | 0 (0.0%) |
| $3,000 or more | 0 (0.0%) | 0 (0.0%) |
| Total | 60 (100.0%) | 32 (100.0%) |
Physical Housing Characteristics in Big Clifty
Housing Structures in Big Clifty
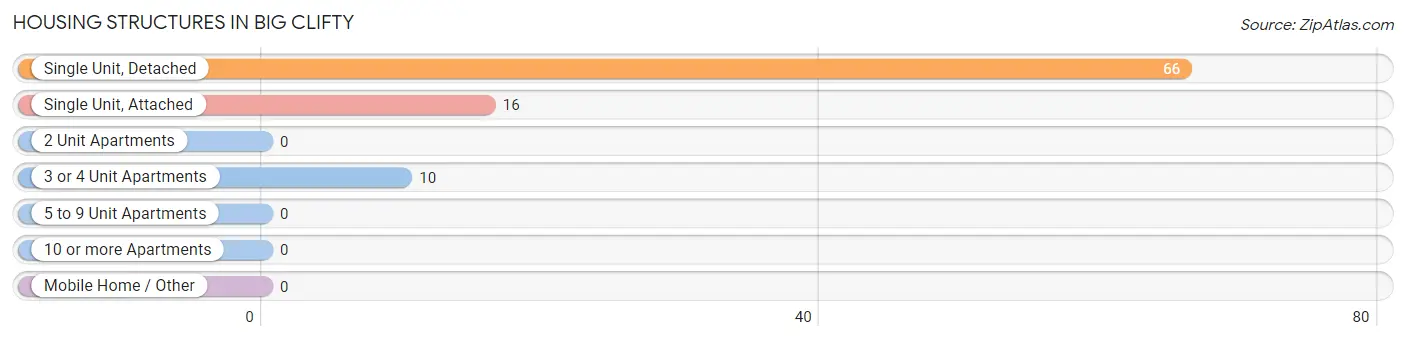
| Structure Type | # Housing Units | % Housing Units |
| Single Unit, Detached | 66 | 71.7% |
| Single Unit, Attached | 16 | 17.4% |
| 2 Unit Apartments | 0 | 0.0% |
| 3 or 4 Unit Apartments | 10 | 10.9% |
| 5 to 9 Unit Apartments | 0 | 0.0% |
| 10 or more Apartments | 0 | 0.0% |
| Mobile Home / Other | 0 | 0.0% |
| Total | 92 | 100.0% |
Housing Structures by Occupancy in Big Clifty
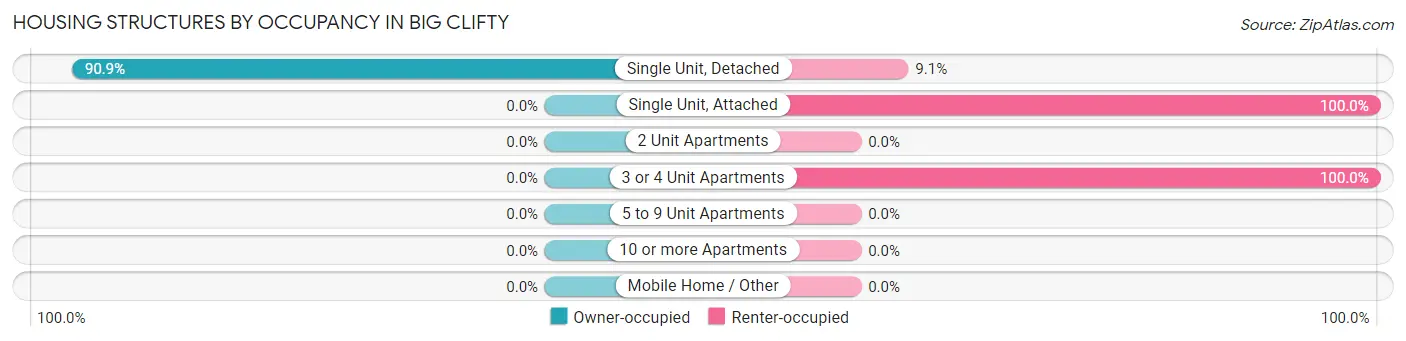
| Structure Type | Owner-occupied | Renter-occupied |
| Single Unit, Detached | 60 (90.9%) | 6 (9.1%) |
| Single Unit, Attached | 0 (0.0%) | 16 (100.0%) |
| 2 Unit Apartments | 0 (0.0%) | 0 (0.0%) |
| 3 or 4 Unit Apartments | 0 (0.0%) | 10 (100.0%) |
| 5 to 9 Unit Apartments | 0 (0.0%) | 0 (0.0%) |
| 10 or more Apartments | 0 (0.0%) | 0 (0.0%) |
| Mobile Home / Other | 0 (0.0%) | 0 (0.0%) |
| Total | 60 (65.2%) | 32 (34.8%) |
Housing Structures by Number of Rooms in Big Clifty
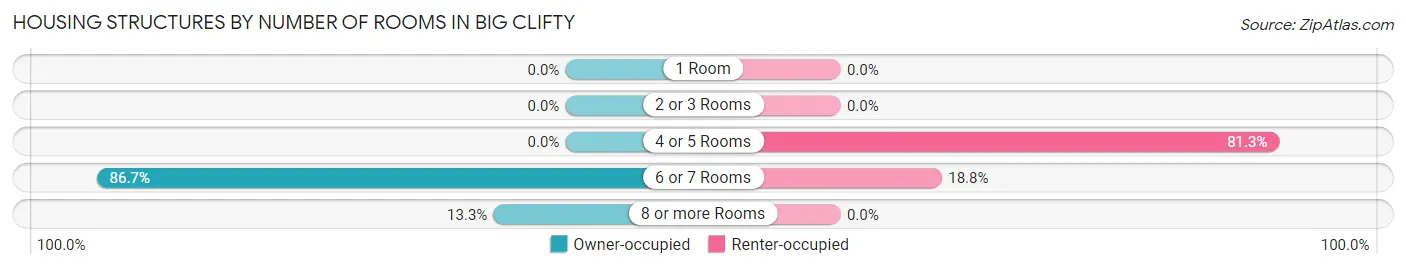
| Number of Rooms | Owner-occupied | Renter-occupied |
| 1 Room | 0 (0.0%) | 0 (0.0%) |
| 2 or 3 Rooms | 0 (0.0%) | 0 (0.0%) |
| 4 or 5 Rooms | 0 (0.0%) | 26 (81.2%) |
| 6 or 7 Rooms | 52 (86.7%) | 6 (18.8%) |
| 8 or more Rooms | 8 (13.3%) | 0 (0.0%) |
| Total | 60 (100.0%) | 32 (100.0%) |
Housing Structure by Heating Type in Big Clifty
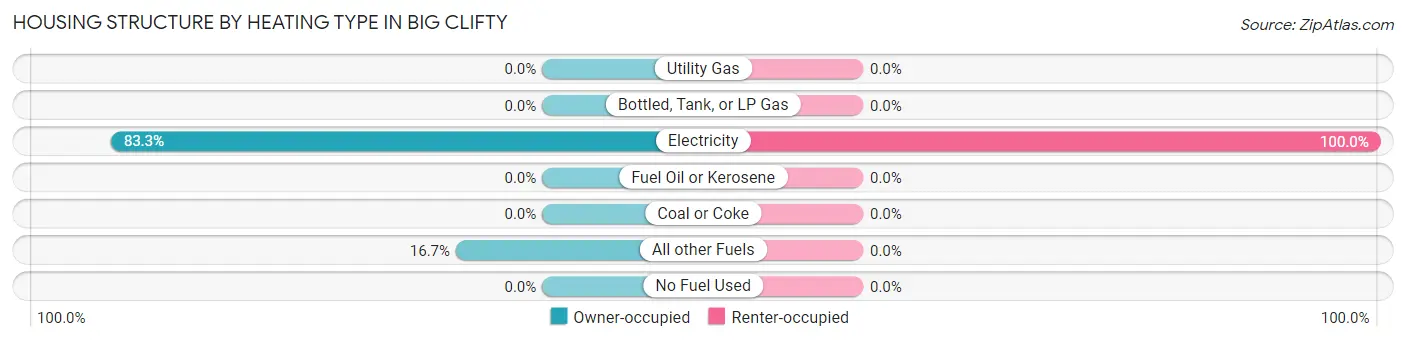
| Heating Type | Owner-occupied | Renter-occupied |
| Utility Gas | 0 (0.0%) | 0 (0.0%) |
| Bottled, Tank, or LP Gas | 0 (0.0%) | 0 (0.0%) |
| Electricity | 50 (83.3%) | 32 (100.0%) |
| Fuel Oil or Kerosene | 0 (0.0%) | 0 (0.0%) |
| Coal or Coke | 0 (0.0%) | 0 (0.0%) |
| All other Fuels | 10 (16.7%) | 0 (0.0%) |
| No Fuel Used | 0 (0.0%) | 0 (0.0%) |
| Total | 60 (100.0%) | 32 (100.0%) |
Household Vehicle Usage in Big Clifty
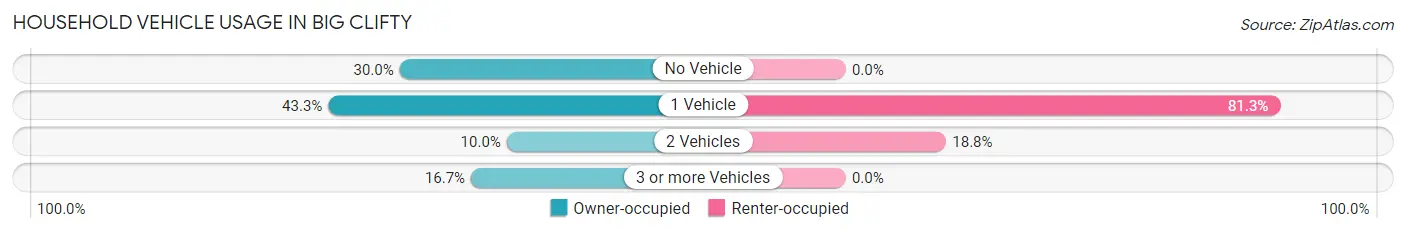
| Vehicles per Household | Owner-occupied | Renter-occupied |
| No Vehicle | 18 (30.0%) | 0 (0.0%) |
| 1 Vehicle | 26 (43.3%) | 26 (81.2%) |
| 2 Vehicles | 6 (10.0%) | 6 (18.8%) |
| 3 or more Vehicles | 10 (16.7%) | 0 (0.0%) |
| Total | 60 (100.0%) | 32 (100.0%) |
Real Estate & Mortgages in Big Clifty
Real Estate and Mortgage Overview in Big Clifty
| Characteristic | Without Mortgage | With Mortgage |
| Housing Units | 36 | 24 |
| Median Property Value | - | - |
| Median Household Income | - | - |
| Monthly Housing Costs | - | - |
| Real Estate Taxes | - | - |
Property Value by Mortgage Status in Big Clifty
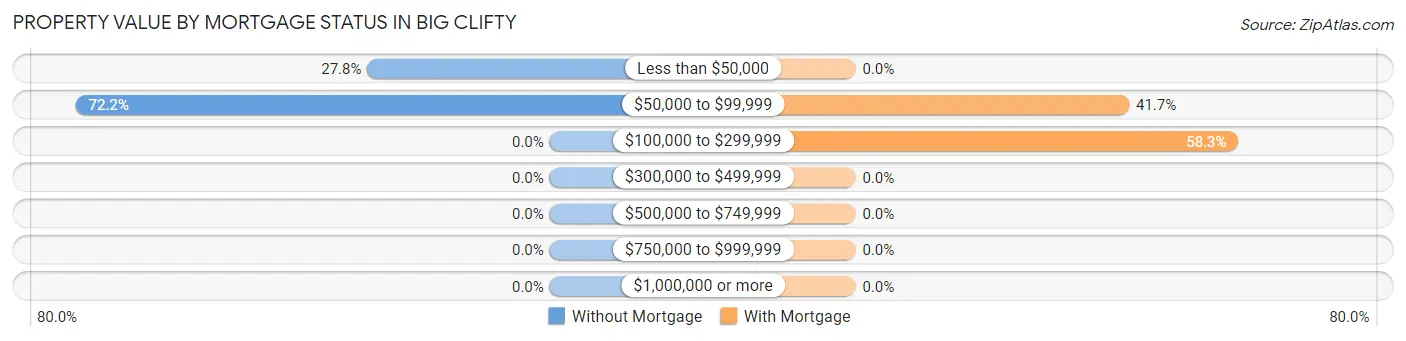
| Property Value | Without Mortgage | With Mortgage |
| Less than $50,000 | 10 (27.8%) | 0 (0.0%) |
| $50,000 to $99,999 | 26 (72.2%) | 10 (41.7%) |
| $100,000 to $299,999 | 0 (0.0%) | 14 (58.3%) |
| $300,000 to $499,999 | 0 (0.0%) | 0 (0.0%) |
| $500,000 to $749,999 | 0 (0.0%) | 0 (0.0%) |
| $750,000 to $999,999 | 0 (0.0%) | 0 (0.0%) |
| $1,000,000 or more | 0 (0.0%) | 0 (0.0%) |
| Total | 36 (100.0%) | 24 (100.0%) |
Household Income by Mortgage Status in Big Clifty
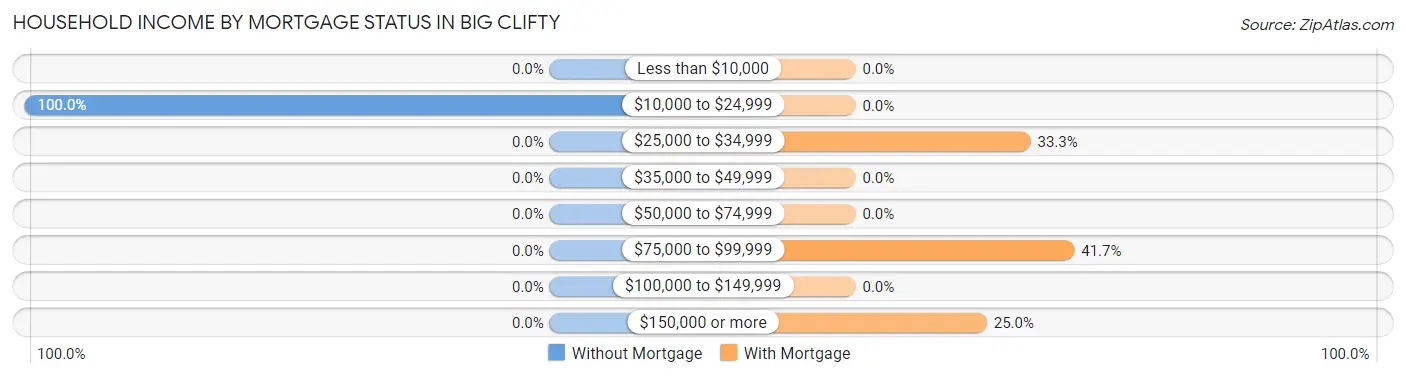
| Household Income | Without Mortgage | With Mortgage |
| Less than $10,000 | 0 (0.0%) | 0 (0.0%) |
| $10,000 to $24,999 | 36 (100.0%) | 0 (0.0%) |
| $25,000 to $34,999 | 0 (0.0%) | 8 (33.3%) |
| $35,000 to $49,999 | 0 (0.0%) | 0 (0.0%) |
| $50,000 to $74,999 | 0 (0.0%) | 0 (0.0%) |
| $75,000 to $99,999 | 0 (0.0%) | 10 (41.7%) |
| $100,000 to $149,999 | 0 (0.0%) | 0 (0.0%) |
| $150,000 or more | 0 (0.0%) | 6 (25.0%) |
| Total | 36 (100.0%) | 24 (100.0%) |
Property Value to Household Income Ratio in Big Clifty
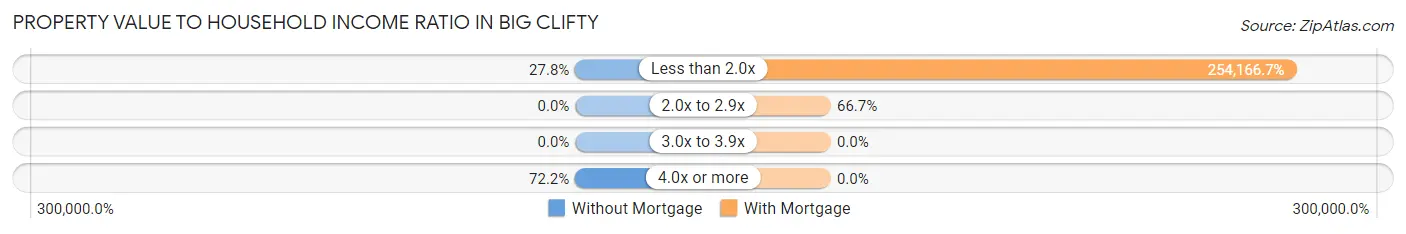
| Value-to-Income Ratio | Without Mortgage | With Mortgage |
| Less than 2.0x | 10 (27.8%) | 61,000 (254,166.7%) |
| 2.0x to 2.9x | 0 (0.0%) | 16 (66.7%) |
| 3.0x to 3.9x | 0 (0.0%) | 0 (0.0%) |
| 4.0x or more | 26 (72.2%) | 0 (0.0%) |
| Total | 36 (100.0%) | 24 (100.0%) |
Real Estate Taxes by Mortgage Status in Big Clifty
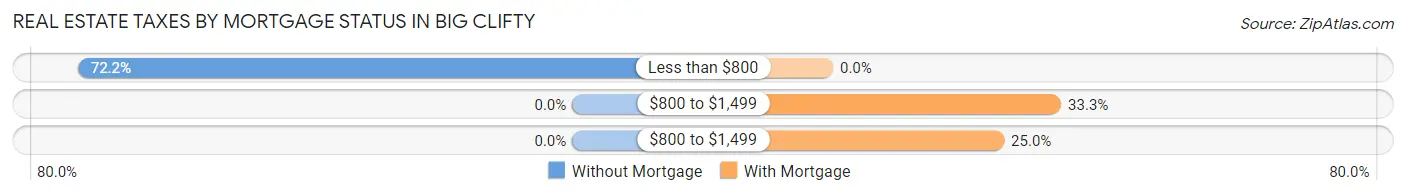
| Property Taxes | Without Mortgage | With Mortgage |
| Less than $800 | 26 (72.2%) | 0 (0.0%) |
| $800 to $1,499 | 0 (0.0%) | 8 (33.3%) |
| $800 to $1,499 | 0 (0.0%) | 6 (25.0%) |
| Total | 36 (100.0%) | 24 (100.0%) |
Health & Disability in Big Clifty
Health Insurance Coverage by Age in Big Clifty
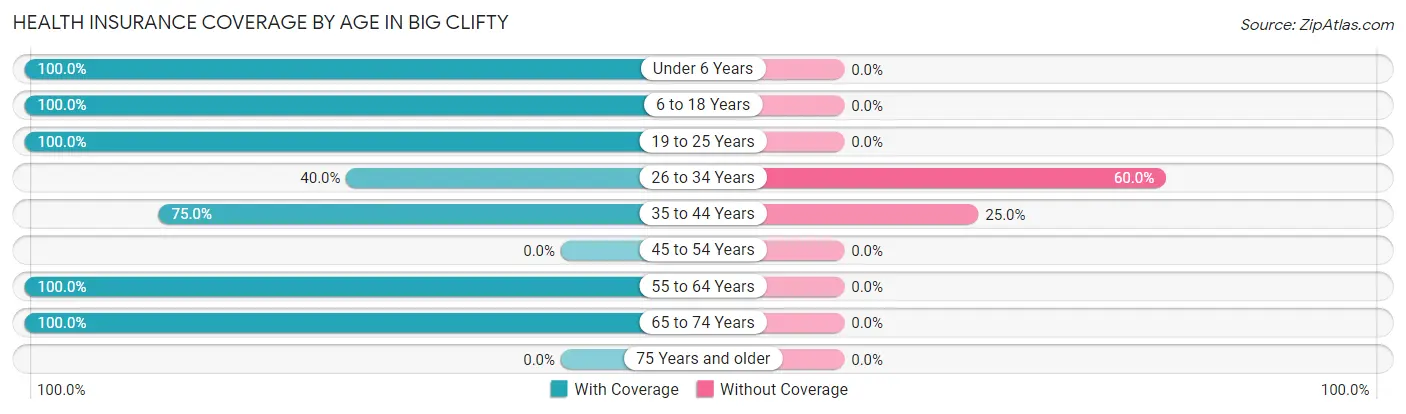
| Age Bracket | With Coverage | Without Coverage |
| Under 6 Years | 16 (100.0%) | 0 (0.0%) |
| 6 to 18 Years | 42 (100.0%) | 0 (0.0%) |
| 19 to 25 Years | 46 (100.0%) | 0 (0.0%) |
| 26 to 34 Years | 10 (40.0%) | 15 (60.0%) |
| 35 to 44 Years | 21 (75.0%) | 7 (25.0%) |
| 45 to 54 Years | 0 (0.0%) | 0 (0.0%) |
| 55 to 64 Years | 15 (100.0%) | 0 (0.0%) |
| 65 to 74 Years | 55 (100.0%) | 0 (0.0%) |
| 75 Years and older | 0 (0.0%) | 0 (0.0%) |
| Total | 205 (90.3%) | 22 (9.7%) |
Health Insurance Coverage by Citizenship Status in Big Clifty
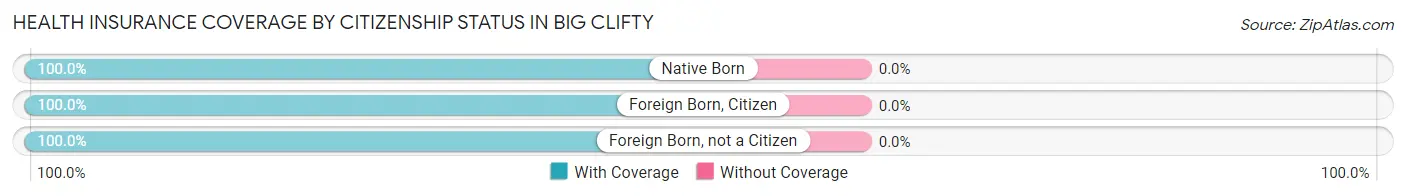
| Citizenship Status | With Coverage | Without Coverage |
| Native Born | 16 (100.0%) | 0 (0.0%) |
| Foreign Born, Citizen | 42 (100.0%) | 0 (0.0%) |
| Foreign Born, not a Citizen | 46 (100.0%) | 0 (0.0%) |
Health Insurance Coverage by Household Income in Big Clifty
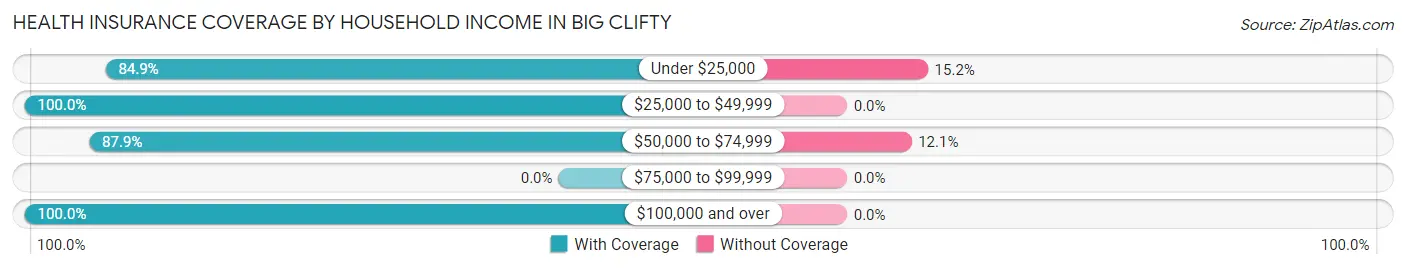
| Household Income | With Coverage | Without Coverage |
| Under $25,000 | 84 (84.9%) | 15 (15.1%) |
| $25,000 to $49,999 | 19 (100.0%) | 0 (0.0%) |
| $50,000 to $74,999 | 51 (87.9%) | 7 (12.1%) |
| $75,000 to $99,999 | 0 (0.0%) | 0 (0.0%) |
| $100,000 and over | 51 (100.0%) | 0 (0.0%) |
Public vs Private Health Insurance Coverage by Age in Big Clifty
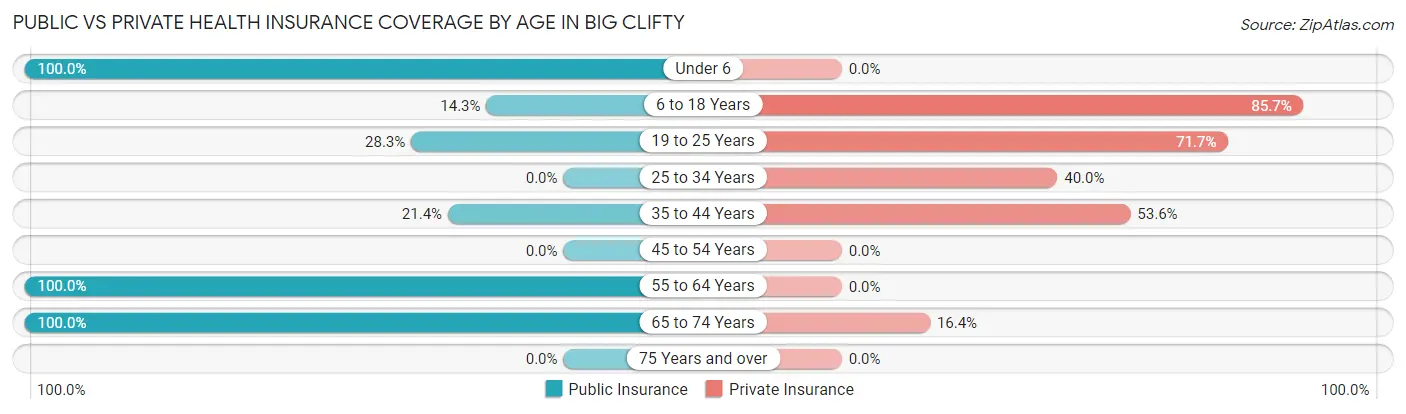
| Age Bracket | Public Insurance | Private Insurance |
| Under 6 | 16 (100.0%) | 0 (0.0%) |
| 6 to 18 Years | 6 (14.3%) | 36 (85.7%) |
| 19 to 25 Years | 13 (28.3%) | 33 (71.7%) |
| 25 to 34 Years | 0 (0.0%) | 10 (40.0%) |
| 35 to 44 Years | 6 (21.4%) | 15 (53.6%) |
| 45 to 54 Years | 0 (0.0%) | 0 (0.0%) |
| 55 to 64 Years | 15 (100.0%) | 0 (0.0%) |
| 65 to 74 Years | 55 (100.0%) | 9 (16.4%) |
| 75 Years and over | 0 (0.0%) | 0 (0.0%) |
| Total | 111 (48.9%) | 103 (45.4%) |
Disability Status by Sex by Age in Big Clifty
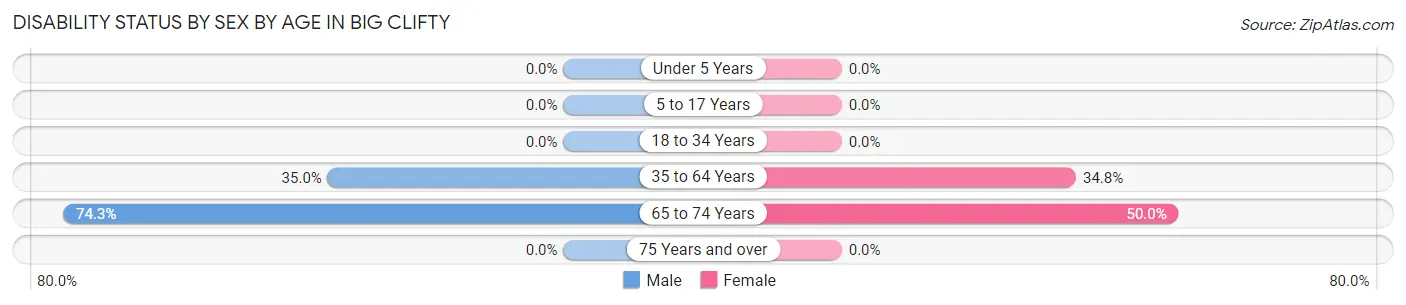
| Age Bracket | Male | Female |
| Under 5 Years | 0 (0.0%) | 0 (0.0%) |
| 5 to 17 Years | 0 (0.0%) | 0 (0.0%) |
| 18 to 34 Years | 0 (0.0%) | 0 (0.0%) |
| 35 to 64 Years | 7 (35.0%) | 8 (34.8%) |
| 65 to 74 Years | 26 (74.3%) | 10 (50.0%) |
| 75 Years and over | 0 (0.0%) | 0 (0.0%) |
Disability Class by Sex by Age in Big Clifty
Disability Class: Hearing Difficulty
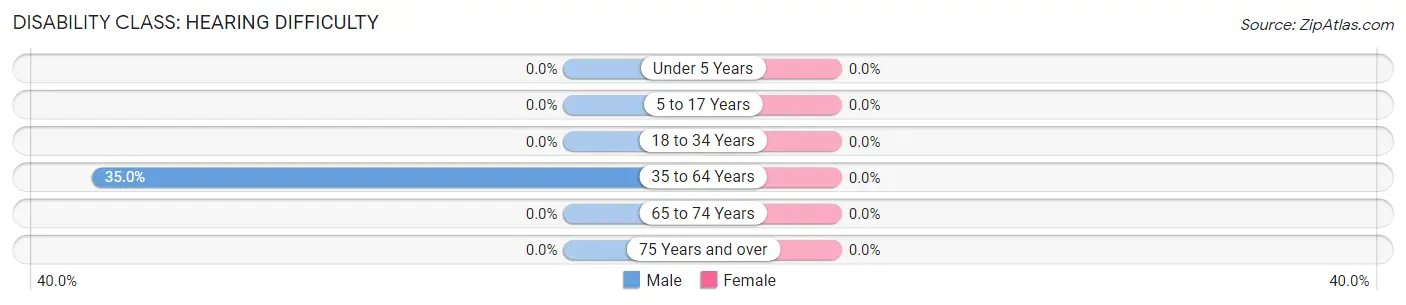
| Age Bracket | Male | Female |
| Under 5 Years | 0 (0.0%) | 0 (0.0%) |
| 5 to 17 Years | 0 (0.0%) | 0 (0.0%) |
| 18 to 34 Years | 0 (0.0%) | 0 (0.0%) |
| 35 to 64 Years | 7 (35.0%) | 0 (0.0%) |
| 65 to 74 Years | 0 (0.0%) | 0 (0.0%) |
| 75 Years and over | 0 (0.0%) | 0 (0.0%) |
Disability Class: Vision Difficulty
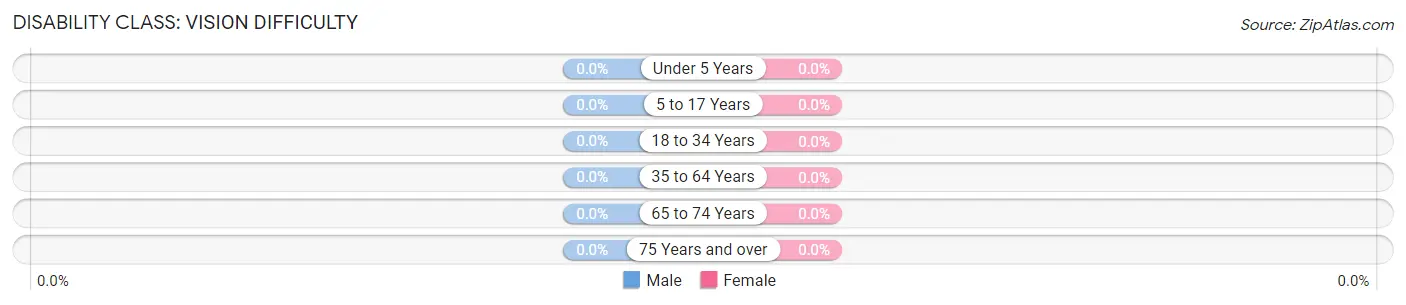
| Age Bracket | Male | Female |
| Under 5 Years | 0 (0.0%) | 0 (0.0%) |
| 5 to 17 Years | 0 (0.0%) | 0 (0.0%) |
| 18 to 34 Years | 0 (0.0%) | 0 (0.0%) |
| 35 to 64 Years | 0 (0.0%) | 0 (0.0%) |
| 65 to 74 Years | 0 (0.0%) | 0 (0.0%) |
| 75 Years and over | 0 (0.0%) | 0 (0.0%) |
Disability Class: Cognitive Difficulty
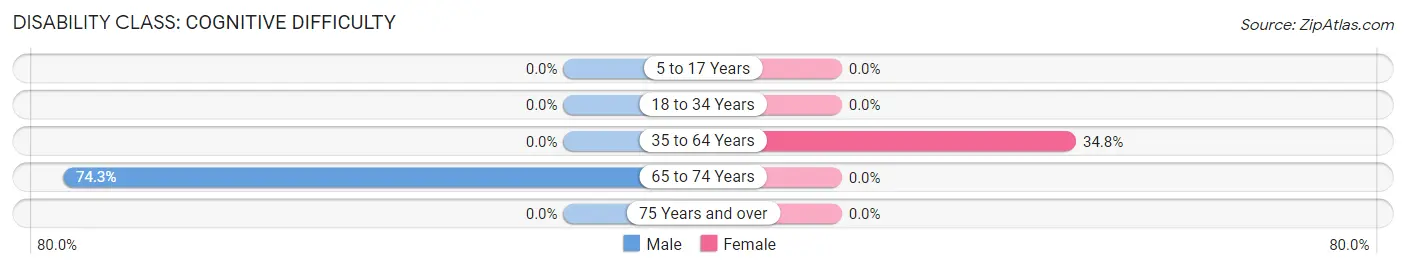
| Age Bracket | Male | Female |
| 5 to 17 Years | 0 (0.0%) | 0 (0.0%) |
| 18 to 34 Years | 0 (0.0%) | 0 (0.0%) |
| 35 to 64 Years | 0 (0.0%) | 8 (34.8%) |
| 65 to 74 Years | 26 (74.3%) | 0 (0.0%) |
| 75 Years and over | 0 (0.0%) | 0 (0.0%) |
Disability Class: Ambulatory Difficulty
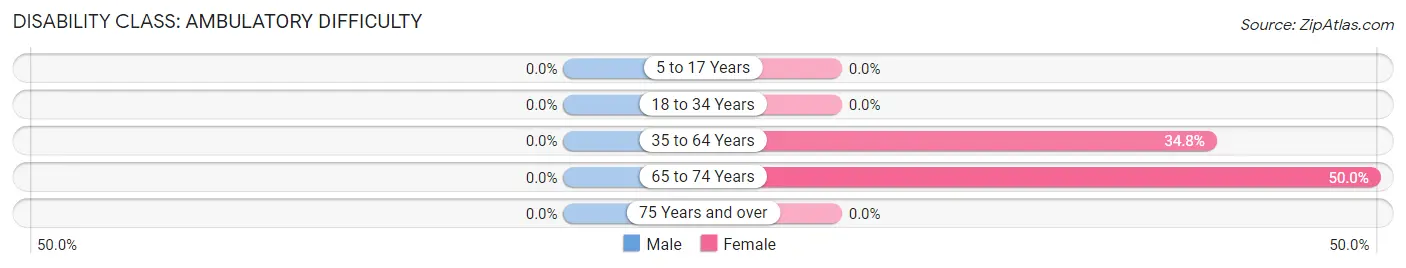
| Age Bracket | Male | Female |
| 5 to 17 Years | 0 (0.0%) | 0 (0.0%) |
| 18 to 34 Years | 0 (0.0%) | 0 (0.0%) |
| 35 to 64 Years | 0 (0.0%) | 8 (34.8%) |
| 65 to 74 Years | 0 (0.0%) | 10 (50.0%) |
| 75 Years and over | 0 (0.0%) | 0 (0.0%) |
Disability Class: Self-Care Difficulty
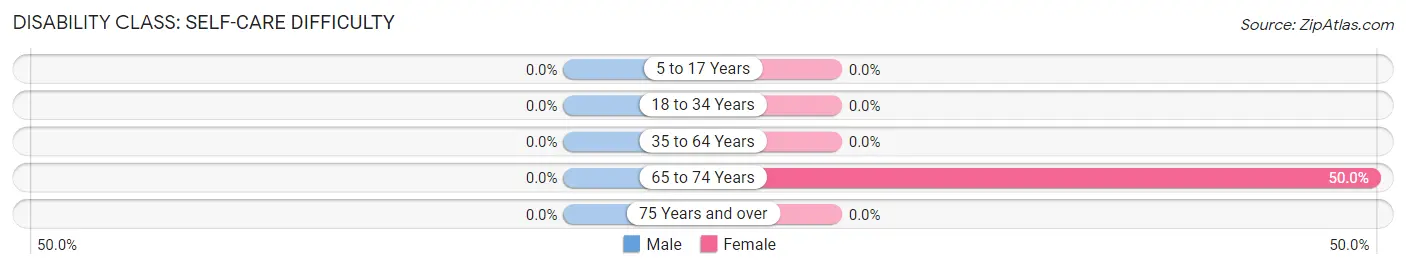
| Age Bracket | Male | Female |
| 5 to 17 Years | 0 (0.0%) | 0 (0.0%) |
| 18 to 34 Years | 0 (0.0%) | 0 (0.0%) |
| 35 to 64 Years | 0 (0.0%) | 0 (0.0%) |
| 65 to 74 Years | 0 (0.0%) | 10 (50.0%) |
| 75 Years and over | 0 (0.0%) | 0 (0.0%) |
Technology Access in Big Clifty
Computing Device Access in Big Clifty
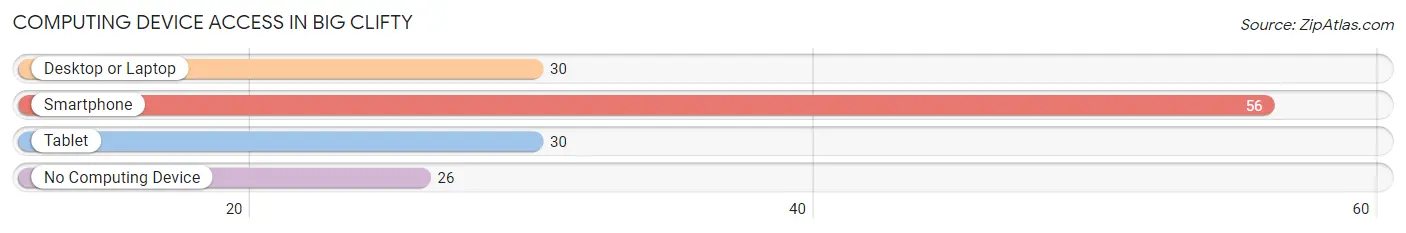
| Device Type | # Households | % Households |
| Desktop or Laptop | 30 | 32.6% |
| Smartphone | 56 | 60.9% |
| Tablet | 30 | 32.6% |
| No Computing Device | 26 | 28.3% |
| Total | 92 | 100.0% |
Internet Access in Big Clifty
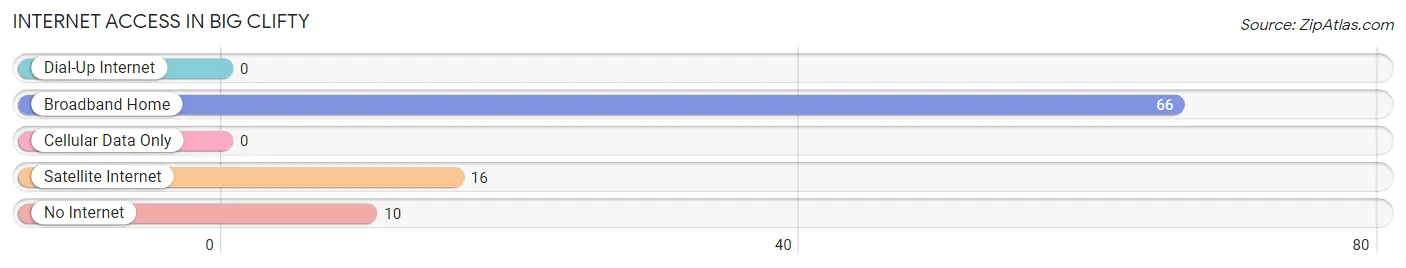
| Internet Type | # Households | % Households |
| Dial-Up Internet | 0 | 0.0% |
| Broadband Home | 66 | 71.7% |
| Cellular Data Only | 0 | 0.0% |
| Satellite Internet | 16 | 17.4% |
| No Internet | 10 | 10.9% |
| Total | 92 | 100.0% |
Big Clifty Summary
Big Clifty is a small unincorporated community located in Grayson County, Kentucky. It is situated in the western part of the state, near the border with Illinois. The population of Big Clifty was estimated to be around 500 people in 2020.
History
Big Clifty was first settled in the early 1800s by a group of settlers from Virginia. The town was originally known as Clifty, but the name was changed to Big Clifty in 1845 to distinguish it from a nearby settlement called Little Clifty. The town was incorporated in 1848 and was the county seat of Grayson County until 1876.
Big Clifty was an important stop on the Louisville and Nashville Railroad, which ran through the town from 1871 to 1971. The railroad brought economic growth to the area, and the town became a center for trade and commerce.
Geography
Big Clifty is located in western Kentucky, near the border with Illinois. It is situated in the Pennyrile region of the state, which is characterized by rolling hills and fertile farmland. The town is located on the banks of the Ohio River, which provides a natural border between Kentucky and Illinois.
The climate in Big Clifty is humid subtropical, with hot summers and mild winters. The average annual temperature is around 60 degrees Fahrenheit, and the average annual precipitation is around 45 inches.
Economy
The economy of Big Clifty is largely based on agriculture. The town is home to several farms, which produce a variety of crops, including corn, soybeans, wheat, and hay. The town also has a few small businesses, including a grocery store, a hardware store, and a few restaurants.
Demographics
The population of Big Clifty was estimated to be around 500 people in 2020. The town is predominantly white, with a small African American population. The median household income in Big Clifty is around $35,000, and the median home value is around $90,000.
Big Clifty is a small, rural community with a rich history and a strong sense of community. The town is home to a variety of businesses and farms, and the people of Big Clifty are proud of their town and its history.
Common Questions
What is Per Capita Income in Big Clifty?
Per Capita income in Big Clifty is $14,048.
What is the Median Family Income in Big Clifty?
Median Family Income in Big Clifty is $25,500.
What is the Median Household income in Big Clifty?
Median Household Income in Big Clifty is $22,813.
What is Inequality or Gini Index in Big Clifty?
Inequality or Gini Index in Big Clifty is 0.42.
What is the Total Population of Big Clifty?
Total Population of Big Clifty is 227.
What is the Total Male Population of Big Clifty?
Total Male Population of Big Clifty is 140.
What is the Total Female Population of Big Clifty?
Total Female Population of Big Clifty is 87.
What is the Ratio of Males per 100 Females in Big Clifty?
There are 160.92 Males per 100 Females in Big Clifty.
What is the Ratio of Females per 100 Males in Big Clifty?
There are 62.14 Females per 100 Males in Big Clifty.
What is the Median Population Age in Big Clifty?
Median Population Age in Big Clifty is 27.0 Years.
What is the Average Family Size in Big Clifty
Average Family Size in Big Clifty is 4.0 People.
What is the Average Household Size in Big Clifty
Average Household Size in Big Clifty is 2.5 People.
How Large is the Labor Force in Big Clifty?
There are 82 People in the Labor Forcein in Big Clifty.
What is the Percentage of People in the Labor Force in Big Clifty?
46.9% of People are in the Labor Force in Big Clifty.
What is the Unemployment Rate in Big Clifty?
Unemployment Rate in Big Clifty is 18.3%.