Hardin, KY Map & Demographics
Hardin Map
Hardin Overview
$14,801
PER CAPITA INCOME
$33,125
AVG FAMILY INCOME
$30,341
AVG HOUSEHOLD INCOME
21.2%
WAGE / INCOME GAP [ % ]
78.8¢/ $1
WAGE / INCOME GAP [ $ ]
$11,457
FAMILY INCOME DEFICIT
0.46
INEQUALITY / GINI INDEX
629
TOTAL POPULATION
266
MALE POPULATION
363
FEMALE POPULATION
73.28
MALES / 100 FEMALES
136.47
FEMALES / 100 MALES
31.2
MEDIAN AGE
2.9
AVG FAMILY SIZE
2.4
AVG HOUSEHOLD SIZE
195
LABOR FORCE [ PEOPLE ]
42.6%
PERCENT IN LABOR FORCE
8.7%
UNEMPLOYMENT RATE
Hardin Zip Codes
Hardin Area Codes
Income in Hardin
Income Overview in Hardin
Per Capita Income in Hardin is $14,801, while median incomes of families and households are $33,125 and $30,341 respectively.
| Characteristic | Number | Measure |
| Per Capita Income | 629 | $14,801 |
| Median Family Income | 159 | $33,125 |
| Mean Family Income | 159 | $41,328 |
| Median Household Income | 261 | $30,341 |
| Mean Household Income | 261 | $36,967 |
| Income Deficit | 159 | $11,457 |
| Wage / Income Gap (%) | 629 | 21.22% |
| Wage / Income Gap ($) | 629 | 78.78¢ per $1 |
| Gini / Inequality Index | 629 | 0.46 |
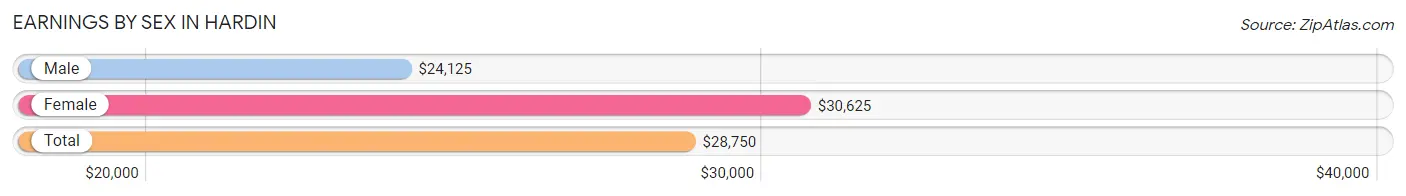
Earnings by Sex in Hardin
Average Earnings in Hardin are $28,750, $24,125 for men and $30,625 for women, a difference of 21.2%.
| Sex | Number | Average Earnings |
| Male | 121 (61.1%) | $24,125 |
| Female | 77 (38.9%) | $30,625 |
| Total | 198 (100.0%) | $28,750 |
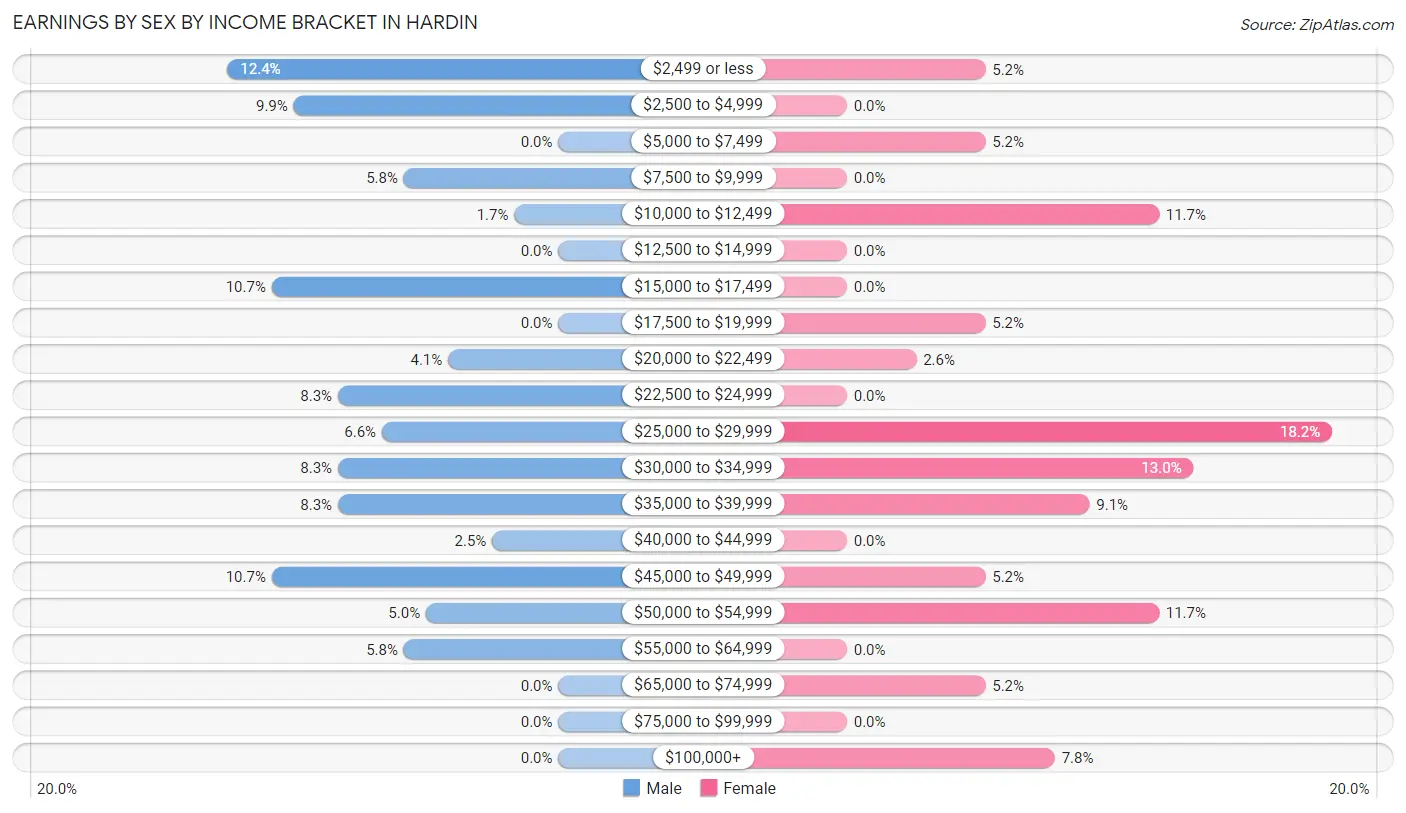
Earnings by Sex by Income Bracket in Hardin
The most common earnings brackets in Hardin are $2,499 or less for men (15 | 12.4%) and $25,000 to $29,999 for women (14 | 18.2%).
| Income | Male | Female |
| $2,499 or less | 15 (12.4%) | 4 (5.2%) |
| $2,500 to $4,999 | 12 (9.9%) | 0 (0.0%) |
| $5,000 to $7,499 | 0 (0.0%) | 4 (5.2%) |
| $7,500 to $9,999 | 7 (5.8%) | 0 (0.0%) |
| $10,000 to $12,499 | 2 (1.7%) | 9 (11.7%) |
| $12,500 to $14,999 | 0 (0.0%) | 0 (0.0%) |
| $15,000 to $17,499 | 13 (10.7%) | 0 (0.0%) |
| $17,500 to $19,999 | 0 (0.0%) | 4 (5.2%) |
| $20,000 to $22,499 | 5 (4.1%) | 2 (2.6%) |
| $22,500 to $24,999 | 10 (8.3%) | 0 (0.0%) |
| $25,000 to $29,999 | 8 (6.6%) | 14 (18.2%) |
| $30,000 to $34,999 | 10 (8.3%) | 10 (13.0%) |
| $35,000 to $39,999 | 10 (8.3%) | 7 (9.1%) |
| $40,000 to $44,999 | 3 (2.5%) | 0 (0.0%) |
| $45,000 to $49,999 | 13 (10.7%) | 4 (5.2%) |
| $50,000 to $54,999 | 6 (5.0%) | 9 (11.7%) |
| $55,000 to $64,999 | 7 (5.8%) | 0 (0.0%) |
| $65,000 to $74,999 | 0 (0.0%) | 4 (5.2%) |
| $75,000 to $99,999 | 0 (0.0%) | 0 (0.0%) |
| $100,000+ | 0 (0.0%) | 6 (7.8%) |
| Total | 121 (100.0%) | 77 (100.0%) |
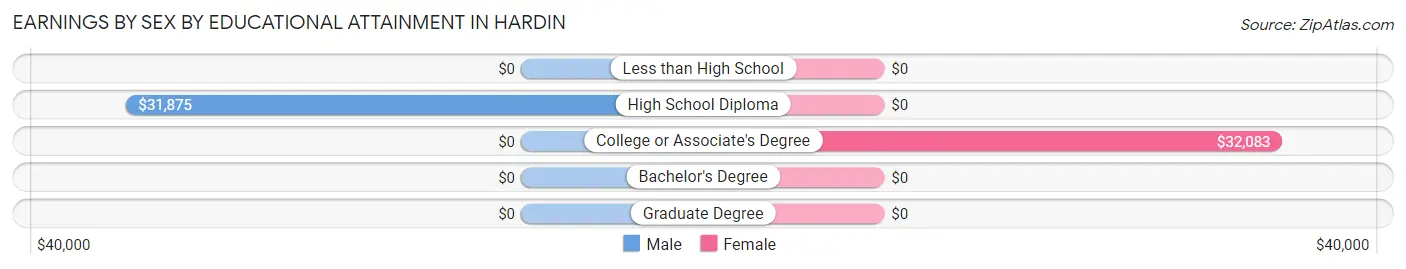
Earnings by Sex by Educational Attainment in Hardin
Average earnings in Hardin are $31,875 for men and $31,667 for women, a difference of 0.6%. Men with an educational attainment of high school diploma enjoy the highest average annual earnings of $31,875, while those with high school diploma education earn the least with $31,875. Women with an educational attainment of college or associate's degree earn the most with the average annual earnings of $32,083, while those with college or associate's degree education have the smallest earnings of $32,083.
| Educational Attainment | Male Income | Female Income |
| Less than High School | - | - |
| High School Diploma | $31,875 | $0 |
| College or Associate's Degree | - | - |
| Bachelor's Degree | - | - |
| Graduate Degree | - | - |
| Total | $31,875 | $31,667 |
Family Income in Hardin
Family Income Brackets in Hardin
According to the Hardin family income data, there are 31 families falling into the less than $10,000 income range, which is the most common income bracket and makes up 19.5% of all families.
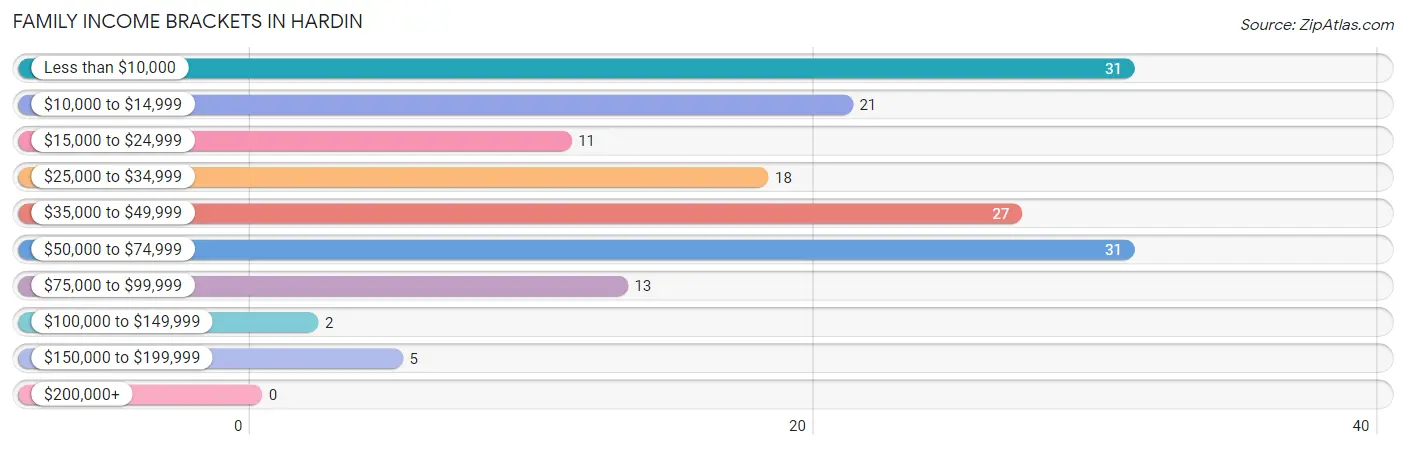
| Income Bracket | # Families | % Families |
| Less than $10,000 | 31 | 19.5% |
| $10,000 to $14,999 | 21 | 13.2% |
| $15,000 to $24,999 | 11 | 6.9% |
| $25,000 to $34,999 | 18 | 11.3% |
| $35,000 to $49,999 | 27 | 17.0% |
| $50,000 to $74,999 | 31 | 19.5% |
| $75,000 to $99,999 | 13 | 8.2% |
| $100,000 to $149,999 | 2 | 1.3% |
| $150,000 to $199,999 | 5 | 3.1% |
| $200,000+ | 0 | 0.0% |
Family Income by Famaliy Size in Hardin
2-person families (88 | 55.3%) account for the highest median family income in Hardin with $40,000 per family, while 2-person families (88 | 55.3%) have the highest median income of $20,000 per family member.
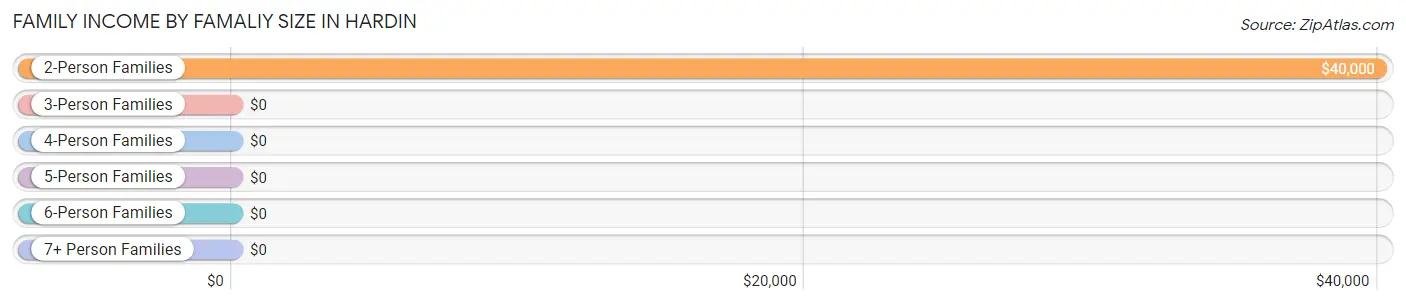
| Income Bracket | # Families | Median Income |
| 2-Person Families | 88 (55.3%) | $40,000 |
| 3-Person Families | 32 (20.1%) | $0 |
| 4-Person Families | 37 (23.3%) | $0 |
| 5-Person Families | 1 (0.6%) | $0 |
| 6-Person Families | 0 (0.0%) | $0 |
| 7+ Person Families | 1 (0.6%) | $0 |
| Total | 159 (100.0%) | $33,125 |
Family Income by Number of Earners in Hardin
The median family income in Hardin is $33,125, with families comprising 3+ earners (15) having the highest median family income of $74,583, while families with no earners (76) have the lowest median family income of $14,079, accounting for 9.4% and 47.8% of families, respectively.
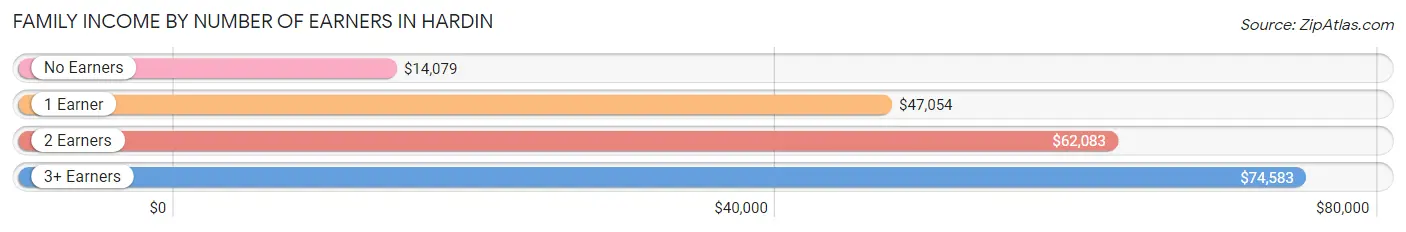
| Number of Earners | # Families | Median Income |
| No Earners | 76 (47.8%) | $14,079 |
| 1 Earner | 55 (34.6%) | $47,054 |
| 2 Earners | 13 (8.2%) | $62,083 |
| 3+ Earners | 15 (9.4%) | $74,583 |
| Total | 159 (100.0%) | $33,125 |
Household Income in Hardin
Household Income Brackets in Hardin
With 54 households falling in the category, the less than $10,000 income range is the most frequent in Hardin, accounting for 20.7% of all households.
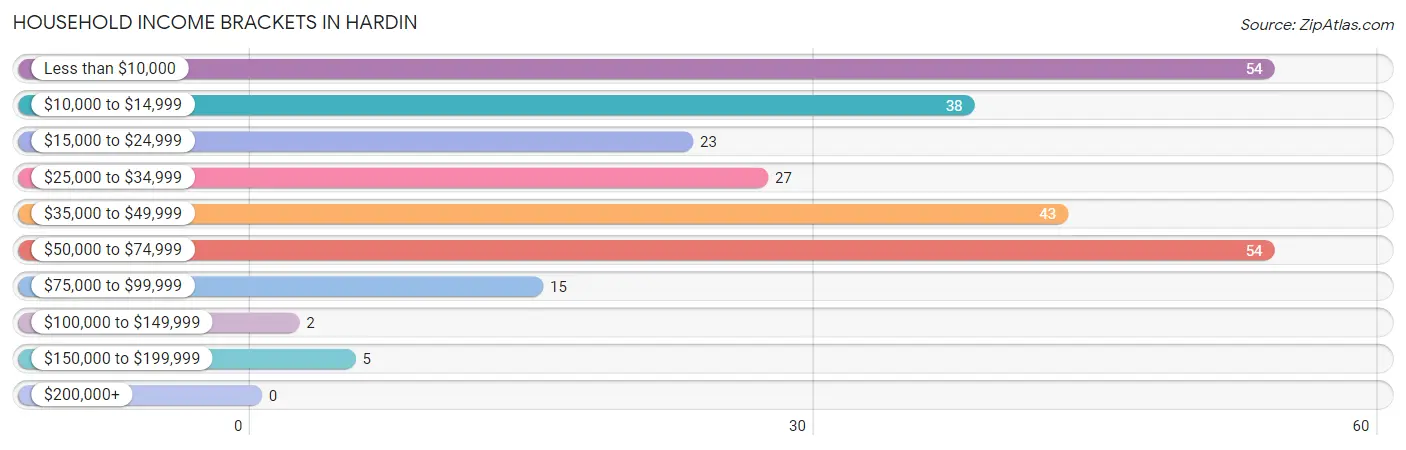
| Income Bracket | # Households | % Households |
| Less than $10,000 | 54 | 20.7% |
| $10,000 to $14,999 | 38 | 14.6% |
| $15,000 to $24,999 | 23 | 8.8% |
| $25,000 to $34,999 | 27 | 10.3% |
| $35,000 to $49,999 | 43 | 16.5% |
| $50,000 to $74,999 | 54 | 20.7% |
| $75,000 to $99,999 | 15 | 5.7% |
| $100,000 to $149,999 | 2 | 0.8% |
| $150,000 to $199,999 | 5 | 1.9% |
| $200,000+ | 0 | 0.0% |
Household Income by Householder Age in Hardin
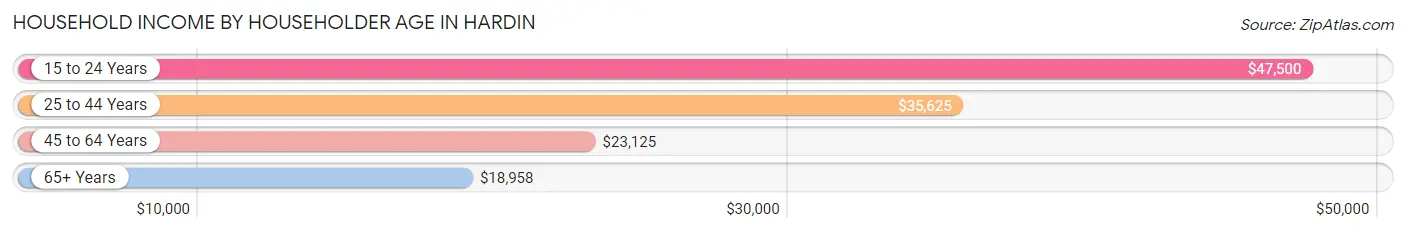
The median household income in Hardin is $30,341, with the highest median household income of $47,500 found in the 15 to 24 years age bracket for the primary householder. A total of 18 households (6.9%) fall into this category. Meanwhile, the 65+ years age bracket for the primary householder has the lowest median household income of $18,958, with 61 households (23.4%) in this group.
| Income Bracket | # Households | Median Income |
| 15 to 24 Years | 18 (6.9%) | $47,500 |
| 25 to 44 Years | 81 (31.0%) | $35,625 |
| 45 to 64 Years | 101 (38.7%) | $23,125 |
| 65+ Years | 61 (23.4%) | $18,958 |
| Total | 261 (100.0%) | $30,341 |
Poverty in Hardin
Income Below Poverty by Sex and Age in Hardin
With 33.9% poverty level for males and 53.1% for females among the residents of Hardin, 5 year old males and 12 to 14 year old females are the most vulnerable to poverty, with 1 males (100.0%) and 12 females (100.0%) in their respective age groups living below the poverty level.
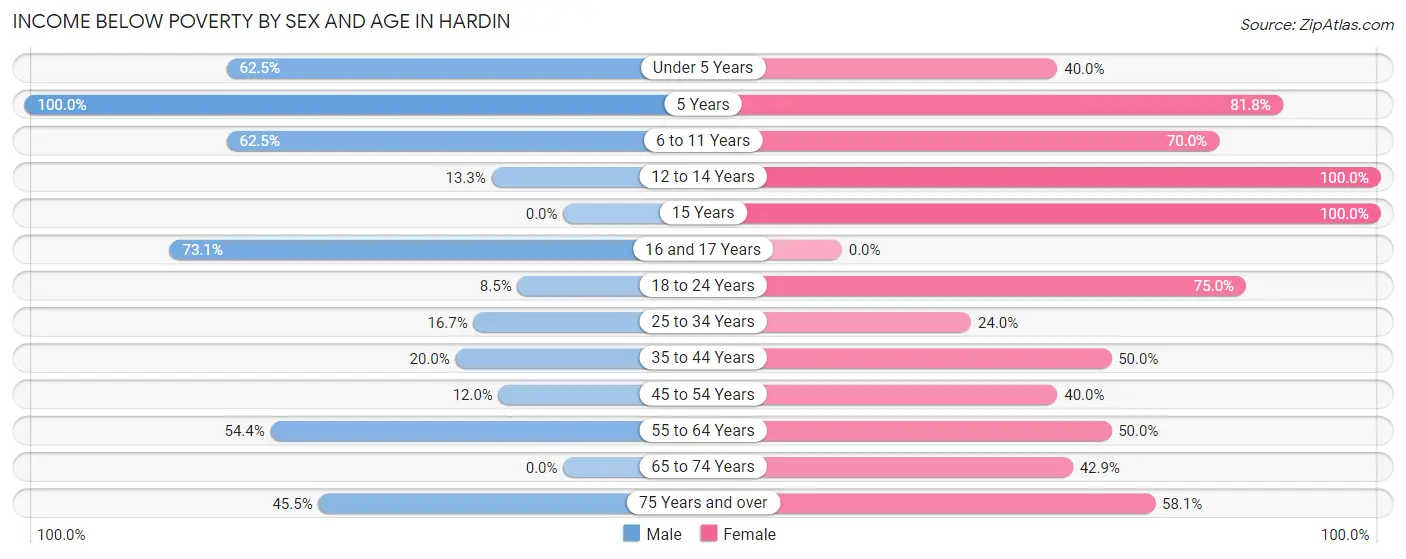
| Age Bracket | Male | Female |
| Under 5 Years | 10 (62.5%) | 10 (40.0%) |
| 5 Years | 1 (100.0%) | 9 (81.8%) |
| 6 to 11 Years | 5 (62.5%) | 28 (70.0%) |
| 12 to 14 Years | 2 (13.3%) | 12 (100.0%) |
| 15 Years | 0 (0.0%) | 12 (100.0%) |
| 16 and 17 Years | 19 (73.1%) | 0 (0.0%) |
| 18 to 24 Years | 4 (8.5%) | 12 (75.0%) |
| 25 to 34 Years | 5 (16.7%) | 12 (24.0%) |
| 35 to 44 Years | 3 (20.0%) | 21 (50.0%) |
| 45 to 54 Years | 3 (12.0%) | 16 (40.0%) |
| 55 to 64 Years | 25 (54.3%) | 18 (50.0%) |
| 65 to 74 Years | 0 (0.0%) | 6 (42.9%) |
| 75 Years and over | 10 (45.5%) | 25 (58.1%) |
| Total | 87 (33.9%) | 181 (53.1%) |
Income Above Poverty by Sex and Age in Hardin
According to the poverty statistics in Hardin, males aged 65 to 74 years and females aged 25 to 34 years are the age groups that are most secure financially, with 100.0% of males and 76.0% of females in these age groups living above the poverty line.
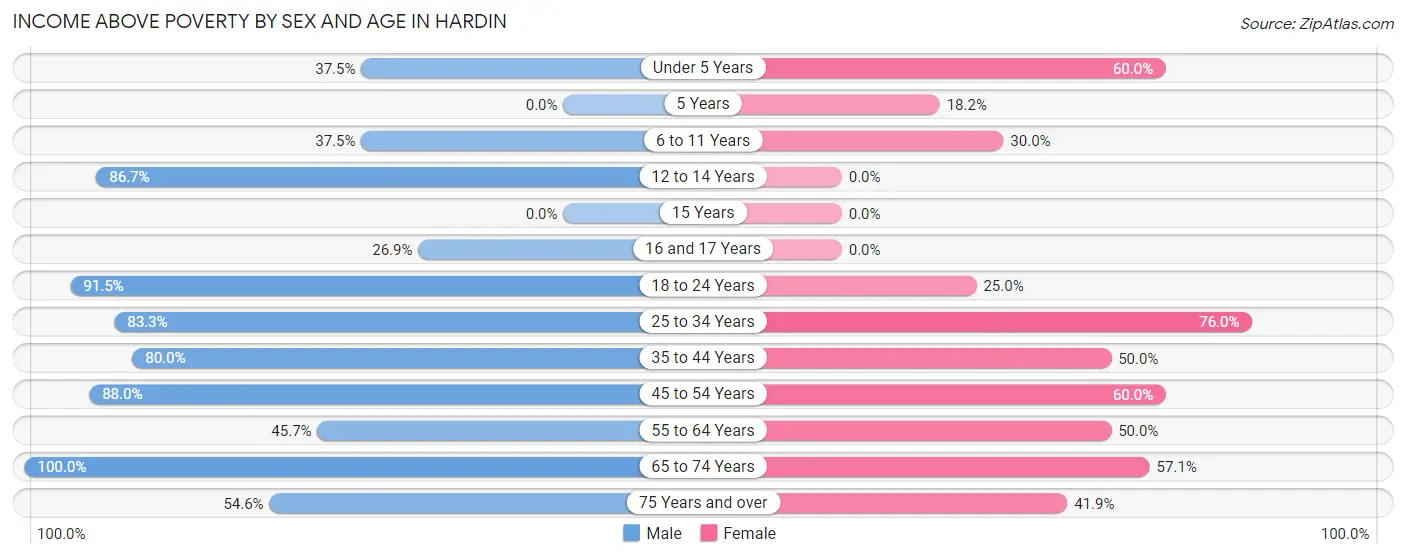
| Age Bracket | Male | Female |
| Under 5 Years | 6 (37.5%) | 15 (60.0%) |
| 5 Years | 0 (0.0%) | 2 (18.2%) |
| 6 to 11 Years | 3 (37.5%) | 12 (30.0%) |
| 12 to 14 Years | 13 (86.7%) | 0 (0.0%) |
| 15 Years | 0 (0.0%) | 0 (0.0%) |
| 16 and 17 Years | 7 (26.9%) | 0 (0.0%) |
| 18 to 24 Years | 43 (91.5%) | 4 (25.0%) |
| 25 to 34 Years | 25 (83.3%) | 38 (76.0%) |
| 35 to 44 Years | 12 (80.0%) | 21 (50.0%) |
| 45 to 54 Years | 22 (88.0%) | 24 (60.0%) |
| 55 to 64 Years | 21 (45.7%) | 18 (50.0%) |
| 65 to 74 Years | 6 (100.0%) | 8 (57.1%) |
| 75 Years and over | 12 (54.5%) | 18 (41.9%) |
| Total | 170 (66.1%) | 160 (46.9%) |
Income Below Poverty Among Married-Couple Families in Hardin
The poverty statistics for married-couple families in Hardin show that 32.2% or 29 of the total 90 families live below the poverty line. Families with 5 or more children have the highest poverty rate of 100.0%, comprising of 1 families. On the other hand, families with 3 or 4 children have the lowest poverty rate of 0.0%, which includes 0 families.
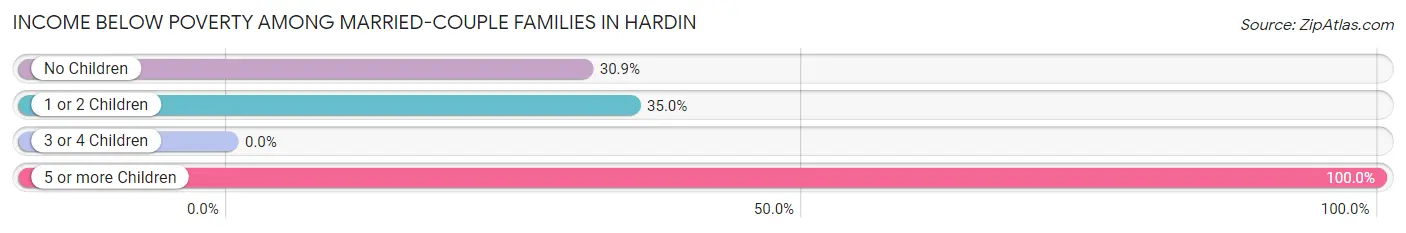
| Children | Above Poverty | Below Poverty |
| No Children | 47 (69.1%) | 21 (30.9%) |
| 1 or 2 Children | 13 (65.0%) | 7 (35.0%) |
| 3 or 4 Children | 1 (100.0%) | 0 (0.0%) |
| 5 or more Children | 0 (0.0%) | 1 (100.0%) |
| Total | 61 (67.8%) | 29 (32.2%) |
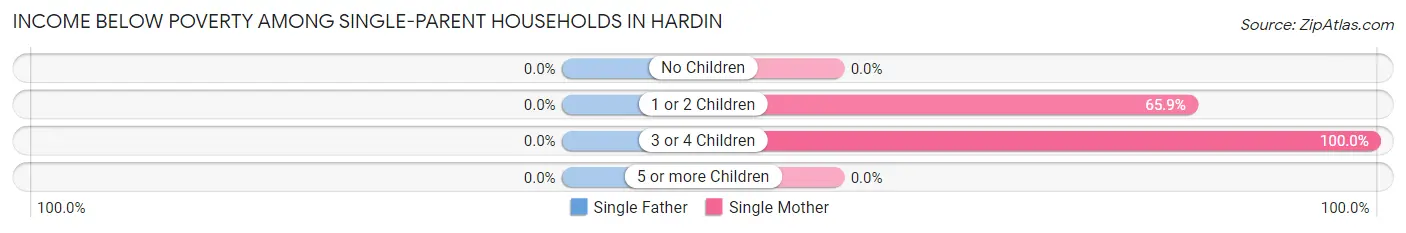
Income Below Poverty Among Single-Parent Households in Hardin
| Children | Single Father | Single Mother |
| No Children | 0 (0.0%) | 0 (0.0%) |
| 1 or 2 Children | 0 (0.0%) | 29 (65.9%) |
| 3 or 4 Children | 0 (0.0%) | 9 (100.0%) |
| 5 or more Children | 0 (0.0%) | 0 (0.0%) |
| Total | 0 (0.0%) | 38 (57.6%) |
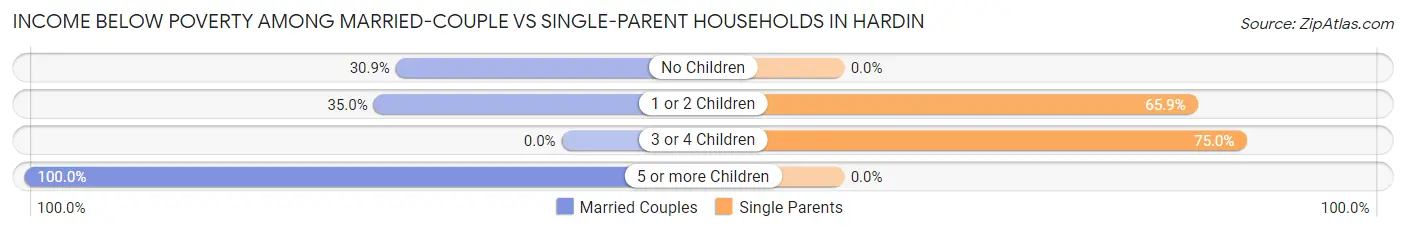
Income Below Poverty Among Married-Couple vs Single-Parent Households in Hardin
The poverty data for Hardin shows that 29 of the married-couple family households (32.2%) and 38 of the single-parent households (55.1%) are living below the poverty level. Within the married-couple family households, those with 5 or more children have the highest poverty rate, with 1 households (100.0%) falling below the poverty line. Among the single-parent households, those with 3 or 4 children have the highest poverty rate, with 9 household (75.0%) living below poverty.
| Children | Married-Couple Families | Single-Parent Households |
| No Children | 21 (30.9%) | 0 (0.0%) |
| 1 or 2 Children | 7 (35.0%) | 29 (65.9%) |
| 3 or 4 Children | 0 (0.0%) | 9 (75.0%) |
| 5 or more Children | 1 (100.0%) | 0 (0.0%) |
| Total | 29 (32.2%) | 38 (55.1%) |
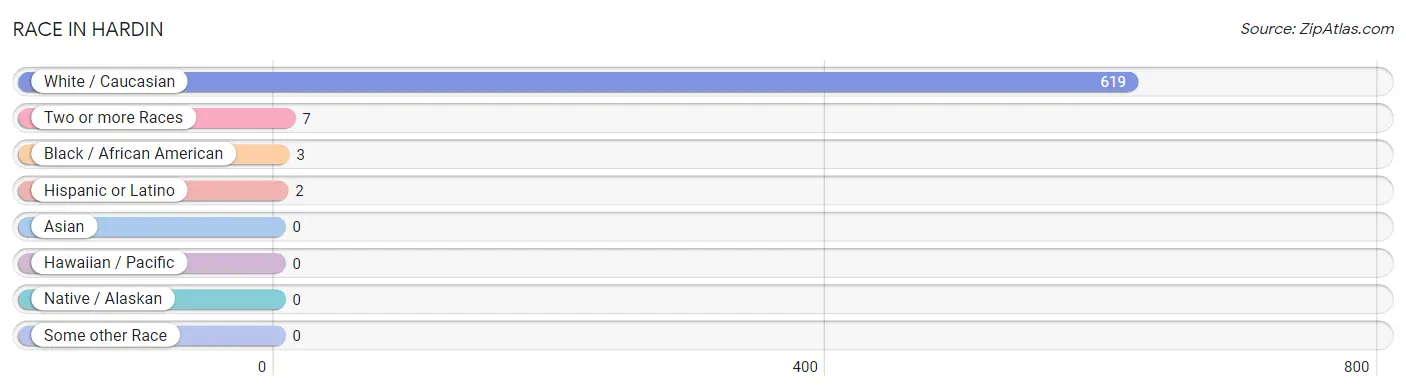
Race in Hardin
The most populous races in Hardin are White / Caucasian (619 | 98.4%), Two or more Races (7 | 1.1%), and Black / African American (3 | 0.5%).
| Race | # Population | % Population |
| Asian | 0 | 0.0% |
| Black / African American | 3 | 0.5% |
| Hawaiian / Pacific | 0 | 0.0% |
| Hispanic or Latino | 2 | 0.3% |
| Native / Alaskan | 0 | 0.0% |
| White / Caucasian | 619 | 98.4% |
| Two or more Races | 7 | 1.1% |
| Some other Race | 0 | 0.0% |
| Total | 629 | 100.0% |
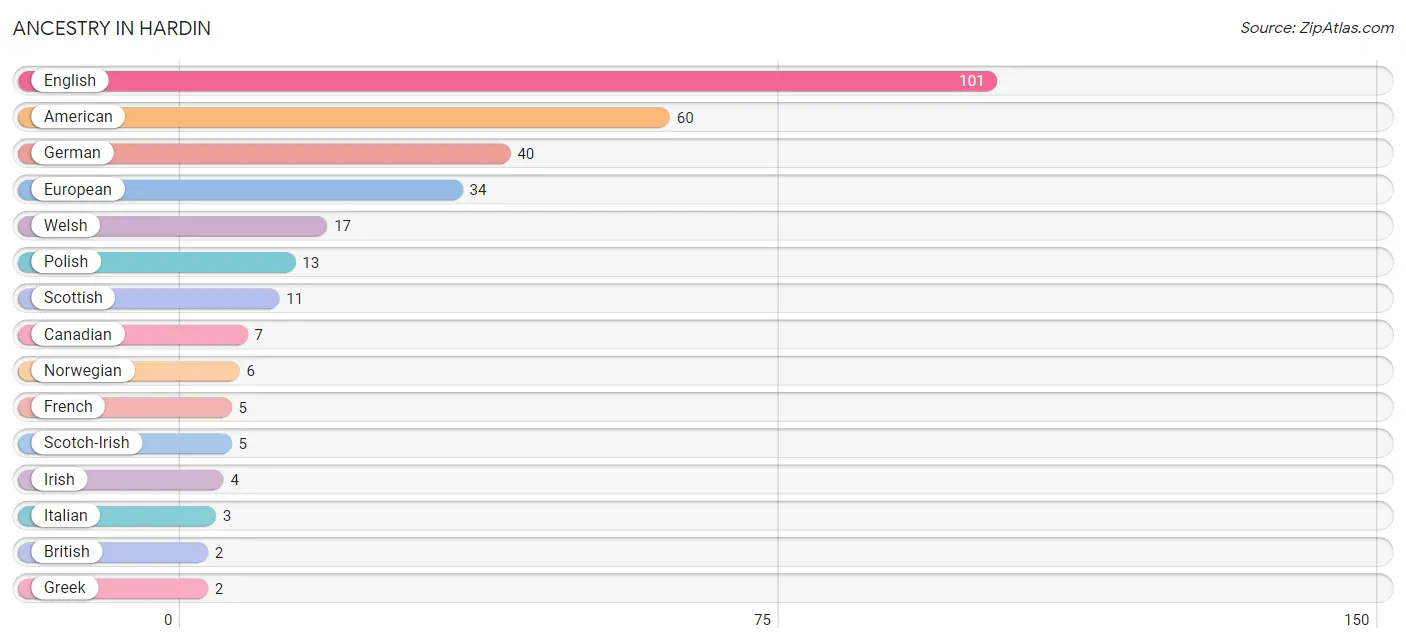
Ancestry in Hardin
The most populous ancestries reported in Hardin are English (101 | 16.1%), American (60 | 9.5%), German (40 | 6.4%), European (34 | 5.4%), and Welsh (17 | 2.7%), together accounting for 40.1% of all Hardin residents.
| Ancestry | # Population | % Population |
| American | 60 | 9.5% |
| British | 2 | 0.3% |
| Canadian | 7 | 1.1% |
| English | 101 | 16.1% |
| European | 34 | 5.4% |
| French | 5 | 0.8% |
| German | 40 | 6.4% |
| Greek | 2 | 0.3% |
| Irish | 4 | 0.6% |
| Italian | 3 | 0.5% |
| Norwegian | 6 | 0.9% |
| Polish | 13 | 2.1% |
| Portuguese | 2 | 0.3% |
| Scotch-Irish | 5 | 0.8% |
| Scottish | 11 | 1.8% |
| Swedish | 2 | 0.3% |
| Welsh | 17 | 2.7% | View All 17 Rows |
Immigrants in Hardin

| Immigration Origin | # Population | % Population | View All 0 Rows |
Sex and Age in Hardin
Sex and Age in Hardin
The most populous age groups in Hardin are 20 to 24 Years (37 | 13.9%) for men and 10 to 14 Years (45 | 12.4%) for women.
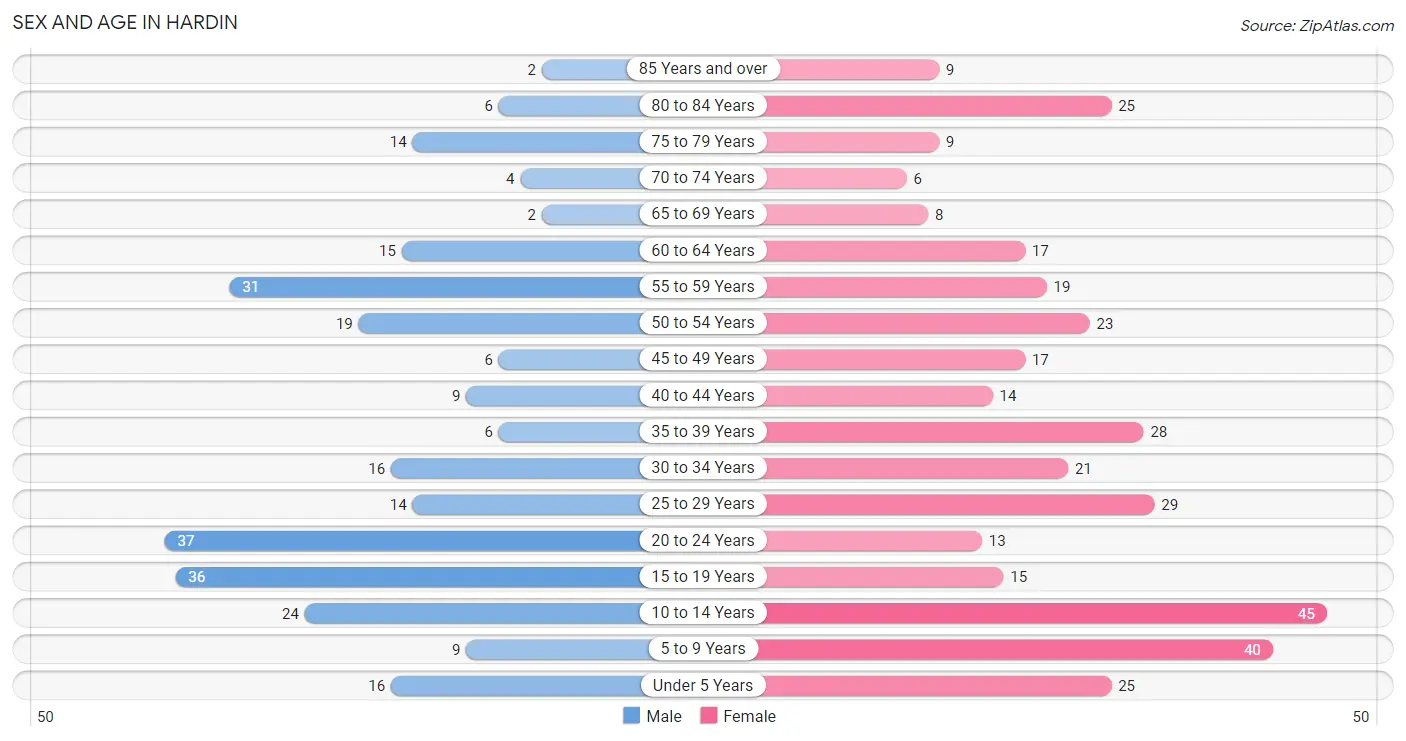
| Age Bracket | Male | Female |
| Under 5 Years | 16 (6.0%) | 25 (6.9%) |
| 5 to 9 Years | 9 (3.4%) | 40 (11.0%) |
| 10 to 14 Years | 24 (9.0%) | 45 (12.4%) |
| 15 to 19 Years | 36 (13.5%) | 15 (4.1%) |
| 20 to 24 Years | 37 (13.9%) | 13 (3.6%) |
| 25 to 29 Years | 14 (5.3%) | 29 (8.0%) |
| 30 to 34 Years | 16 (6.0%) | 21 (5.8%) |
| 35 to 39 Years | 6 (2.3%) | 28 (7.7%) |
| 40 to 44 Years | 9 (3.4%) | 14 (3.9%) |
| 45 to 49 Years | 6 (2.3%) | 17 (4.7%) |
| 50 to 54 Years | 19 (7.1%) | 23 (6.3%) |
| 55 to 59 Years | 31 (11.7%) | 19 (5.2%) |
| 60 to 64 Years | 15 (5.6%) | 17 (4.7%) |
| 65 to 69 Years | 2 (0.7%) | 8 (2.2%) |
| 70 to 74 Years | 4 (1.5%) | 6 (1.7%) |
| 75 to 79 Years | 14 (5.3%) | 9 (2.5%) |
| 80 to 84 Years | 6 (2.3%) | 25 (6.9%) |
| 85 Years and over | 2 (0.7%) | 9 (2.5%) |
| Total | 266 (100.0%) | 363 (100.0%) |
Families and Households in Hardin
Median Family Size in Hardin
The median family size in Hardin is 2.90 persons per family, with single male/father families (3 | 1.9%) accounting for the largest median family size of 5.33 persons per family. On the other hand, married-couple families (90 | 56.6%) represent the smallest median family size with 2.66 persons per family.
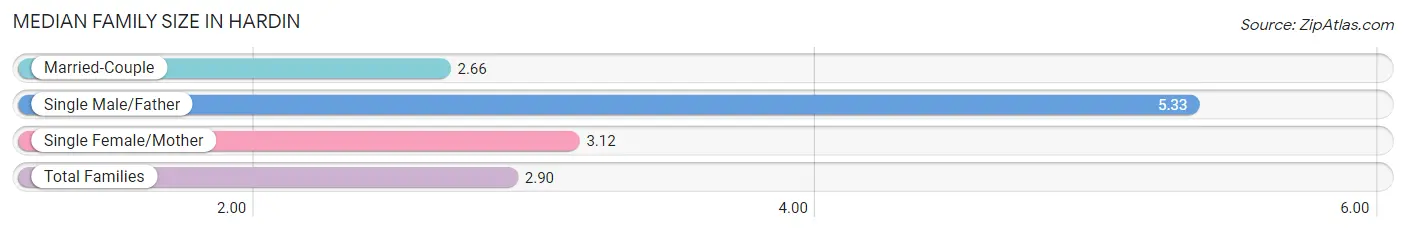
| Family Type | # Families | Family Size |
| Married-Couple | 90 (56.6%) | 2.66 |
| Single Male/Father | 3 (1.9%) | 5.33 |
| Single Female/Mother | 66 (41.5%) | 3.12 |
| Total Families | 159 (100.0%) | 2.90 |
Median Household Size in Hardin
The median household size in Hardin is 2.41 persons per household, with single male/father households (3 | 1.1%) accounting for the largest median household size of 6.33 persons per household. non-family households (102 | 39.1%) represent the smallest median household size with 1.35 persons per household.
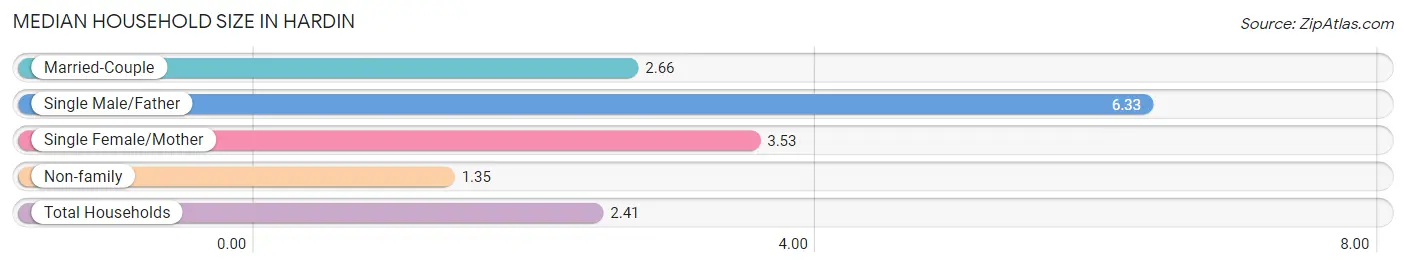
| Household Type | # Households | Household Size |
| Married-Couple | 90 (34.5%) | 2.66 |
| Single Male/Father | 3 (1.1%) | 6.33 |
| Single Female/Mother | 66 (25.3%) | 3.53 |
| Non-family | 102 (39.1%) | 1.35 |
| Total Households | 261 (100.0%) | 2.41 |
Household Size by Marriage Status in Hardin
Out of a total of 261 households in Hardin, 159 (60.9%) are family households, while 102 (39.1%) are nonfamily households. The most numerous type of family households are 2-person households, comprising 81, and the most common type of nonfamily households are 1-person households, comprising 66.
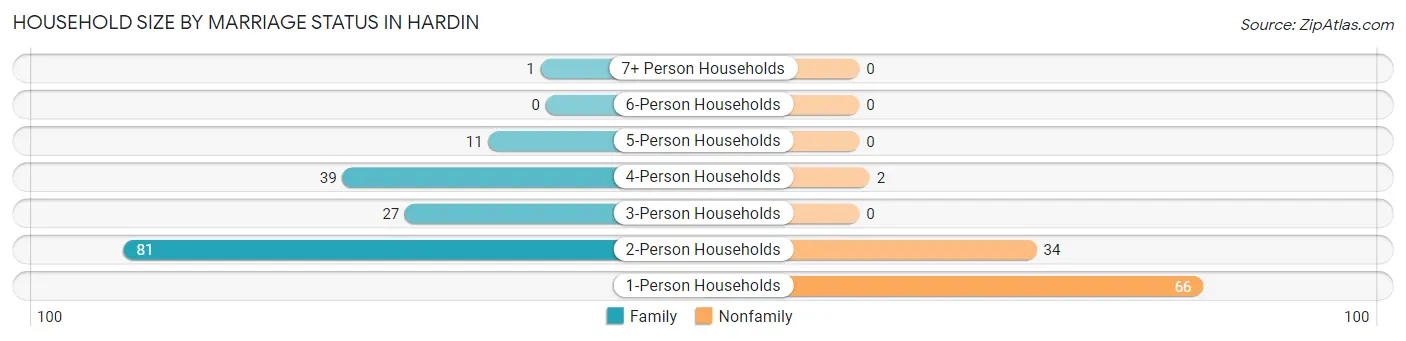
| Household Size | Family Households | Nonfamily Households |
| 1-Person Households | - | 66 (25.3%) |
| 2-Person Households | 81 (31.0%) | 34 (13.0%) |
| 3-Person Households | 27 (10.3%) | 0 (0.0%) |
| 4-Person Households | 39 (14.9%) | 2 (0.8%) |
| 5-Person Households | 11 (4.2%) | 0 (0.0%) |
| 6-Person Households | 0 (0.0%) | 0 (0.0%) |
| 7+ Person Households | 1 (0.4%) | 0 (0.0%) |
| Total | 159 (60.9%) | 102 (39.1%) |
Female Fertility in Hardin
Fertility by Age in Hardin
Average fertility rate in Hardin is 22.0 births per 1,000 women. Women in the age bracket of 35 to 50 years have the highest fertility rate with 51.0 births per 1,000 women. Women in the age bracket of 35 to 50 years acount for 100.0% of all women with births.
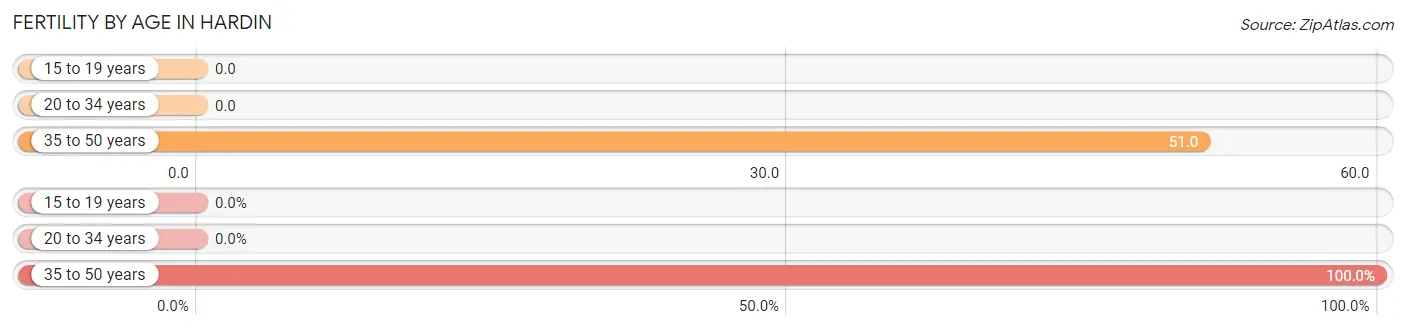
| Age Bracket | Women with Births | Births / 1,000 Women |
| 15 to 19 years | 0 (0.0%) | 0.0 |
| 20 to 34 years | 0 (0.0%) | 0.0 |
| 35 to 50 years | 3 (100.0%) | 51.0 |
| Total | 3 (100.0%) | 22.0 |
Fertility by Age by Marriage Status in Hardin
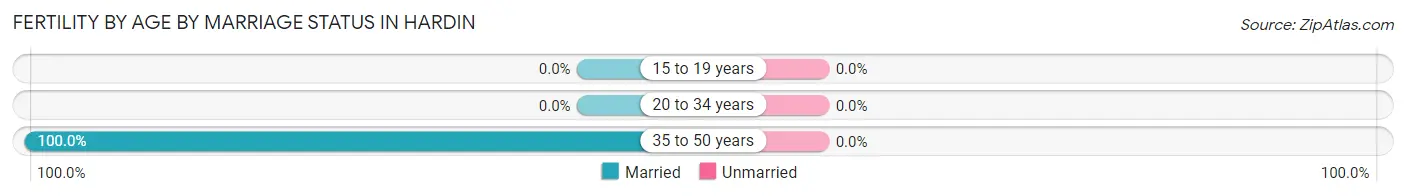
| Age Bracket | Married | Unmarried |
| 15 to 19 years | 0 (0.0%) | 0 (0.0%) |
| 20 to 34 years | 0 (0.0%) | 0 (0.0%) |
| 35 to 50 years | 3 (100.0%) | 0 (0.0%) |
| Total | 3 (100.0%) | 0 (0.0%) |
Fertility by Education in Hardin
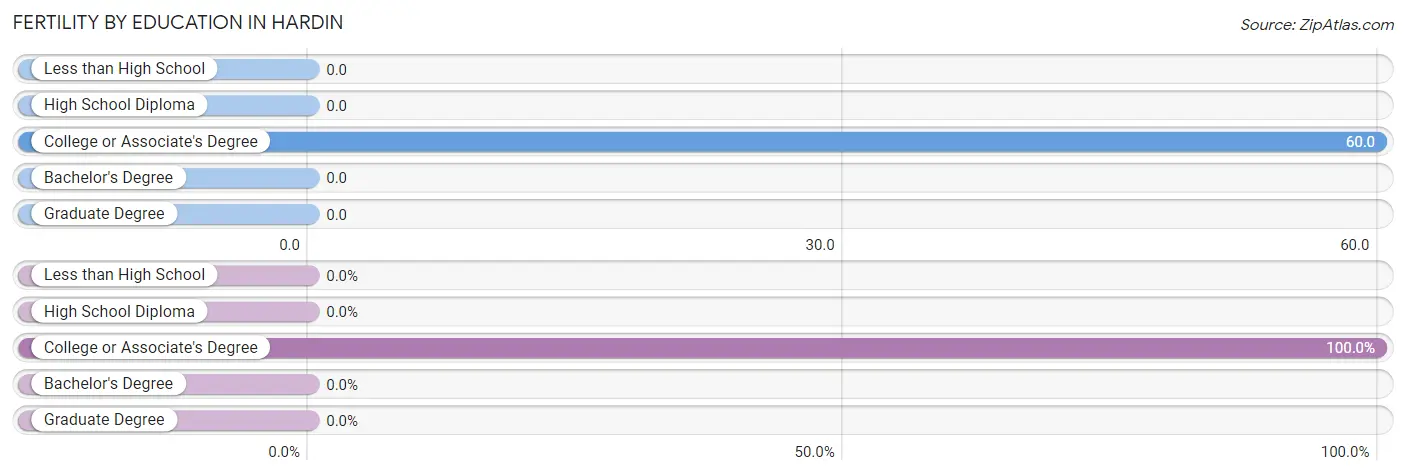
| Educational Attainment | Women with Births | Births / 1,000 Women |
| Less than High School | 0 (0.0%) | 0.0 |
| High School Diploma | 0 (0.0%) | 0.0 |
| College or Associate's Degree | 3 (100.0%) | 60.0 |
| Bachelor's Degree | 0 (0.0%) | 0.0 |
| Graduate Degree | 0 (0.0%) | 0.0 |
| Total | 3 (100.0%) | 22.0 |
Fertility by Education by Marriage Status in Hardin
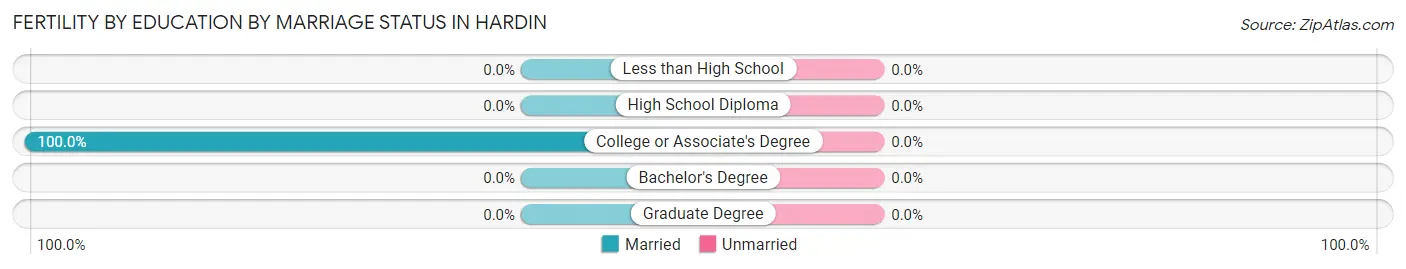
| Educational Attainment | Married | Unmarried |
| Less than High School | 0 (0.0%) | 0 (0.0%) |
| High School Diploma | 0 (0.0%) | 0 (0.0%) |
| College or Associate's Degree | 3 (100.0%) | 0 (0.0%) |
| Bachelor's Degree | 0 (0.0%) | 0 (0.0%) |
| Graduate Degree | 0 (0.0%) | 0 (0.0%) |
| Total | 3 (100.0%) | 0 (0.0%) |
Employment Characteristics in Hardin
Employment by Class of Employer in Hardin
Among the 174 employed individuals in Hardin, private company employees (108 | 62.1%), local government employees (32 | 18.4%), and self-employed (incorporated) (13 | 7.5%) make up the most common classes of employment.
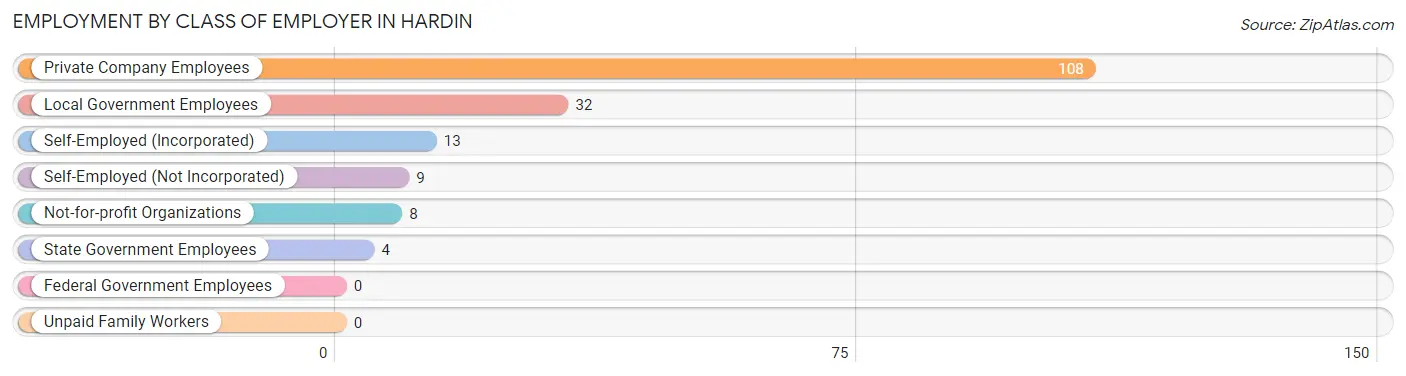
| Employer Class | # Employees | % Employees |
| Private Company Employees | 108 | 62.1% |
| Self-Employed (Incorporated) | 13 | 7.5% |
| Self-Employed (Not Incorporated) | 9 | 5.2% |
| Not-for-profit Organizations | 8 | 4.6% |
| Local Government Employees | 32 | 18.4% |
| State Government Employees | 4 | 2.3% |
| Federal Government Employees | 0 | 0.0% |
| Unpaid Family Workers | 0 | 0.0% |
| Total | 174 | 100.0% |
Employment Status by Age in Hardin
According to the labor force statistics for Hardin, out of the total population over 16 years of age (458), 42.6% or 195 individuals are in the labor force, with 8.7% or 17 of them unemployed. The age group with the highest labor force participation rate is 20 to 24 years, with 86.0% or 43 individuals in the labor force. Within the labor force, the 55 to 59 years age range has the highest percentage of unemployed individuals, with 26.7% or 4 of them being unemployed.
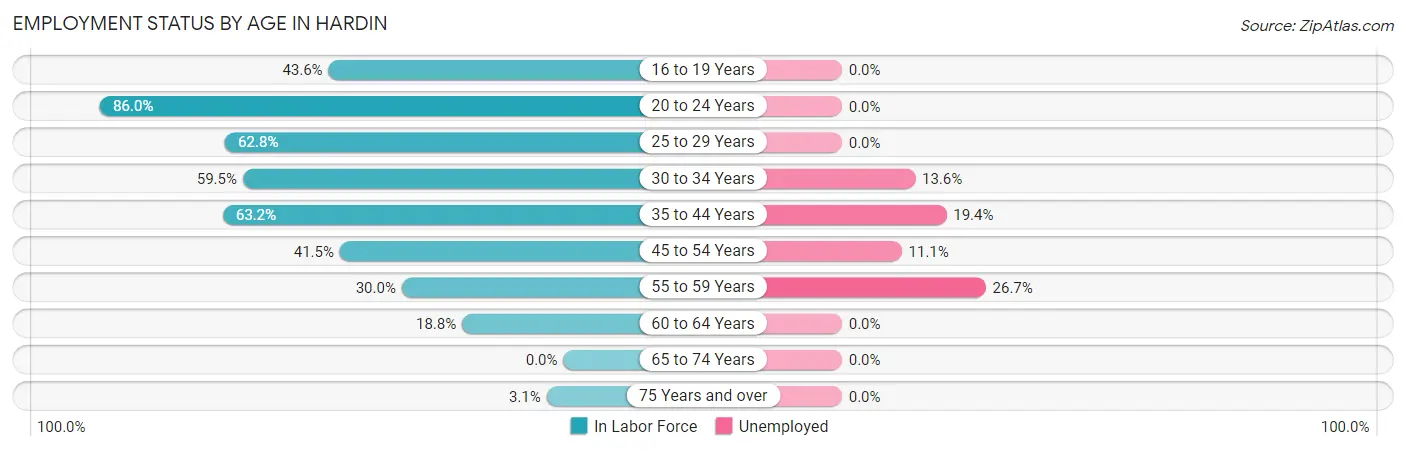
| Age Bracket | In Labor Force | Unemployed |
| 16 to 19 Years | 17 (43.6%) | 0 (0.0%) |
| 20 to 24 Years | 43 (86.0%) | 0 (0.0%) |
| 25 to 29 Years | 27 (62.8%) | 0 (0.0%) |
| 30 to 34 Years | 22 (59.5%) | 3 (13.6%) |
| 35 to 44 Years | 36 (63.2%) | 7 (19.4%) |
| 45 to 54 Years | 27 (41.5%) | 3 (11.1%) |
| 55 to 59 Years | 15 (30.0%) | 4 (26.7%) |
| 60 to 64 Years | 6 (18.8%) | 0 (0.0%) |
| 65 to 74 Years | 0 (0.0%) | 0 (0.0%) |
| 75 Years and over | 2 (3.1%) | 0 (0.0%) |
| Total | 195 (42.6%) | 17 (8.7%) |
Employment Status by Educational Attainment in Hardin
According to labor force statistics for Hardin, 46.8% of individuals (133) out of the total population between 25 and 64 years of age (284) are in the labor force, with 12.8% or 17 of them being unemployed. The group with the highest labor force participation rate are those with the educational attainment of bachelor's degree or higher, with 83.3% or 10 individuals in the labor force. Within the labor force, individuals with less than high school education have the highest percentage of unemployment, with 50.0% or 6 of them being unemployed.
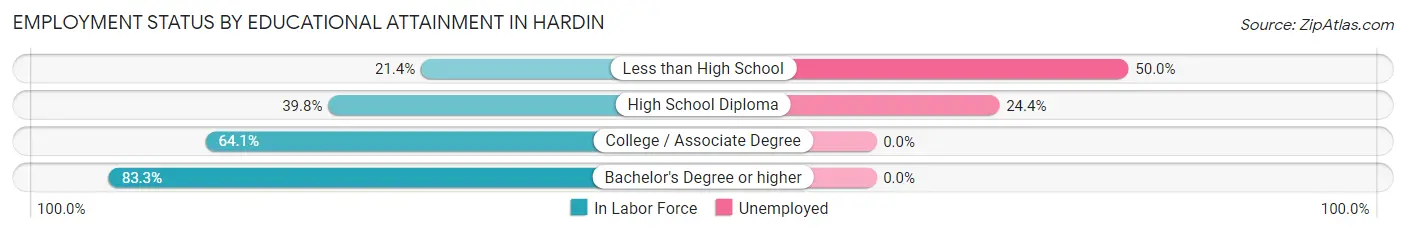
| Educational Attainment | In Labor Force | Unemployed |
| Less than High School | 12 (21.4%) | 28 (50.0%) |
| High School Diploma | 45 (39.8%) | 28 (24.4%) |
| College / Associate Degree | 66 (64.1%) | 0 (0.0%) |
| Bachelor's Degree or higher | 10 (83.3%) | 0 (0.0%) |
| Total | 133 (46.8%) | 36 (12.8%) |
Employment Occupations by Sex in Hardin
Management, Business, Science and Arts Occupations
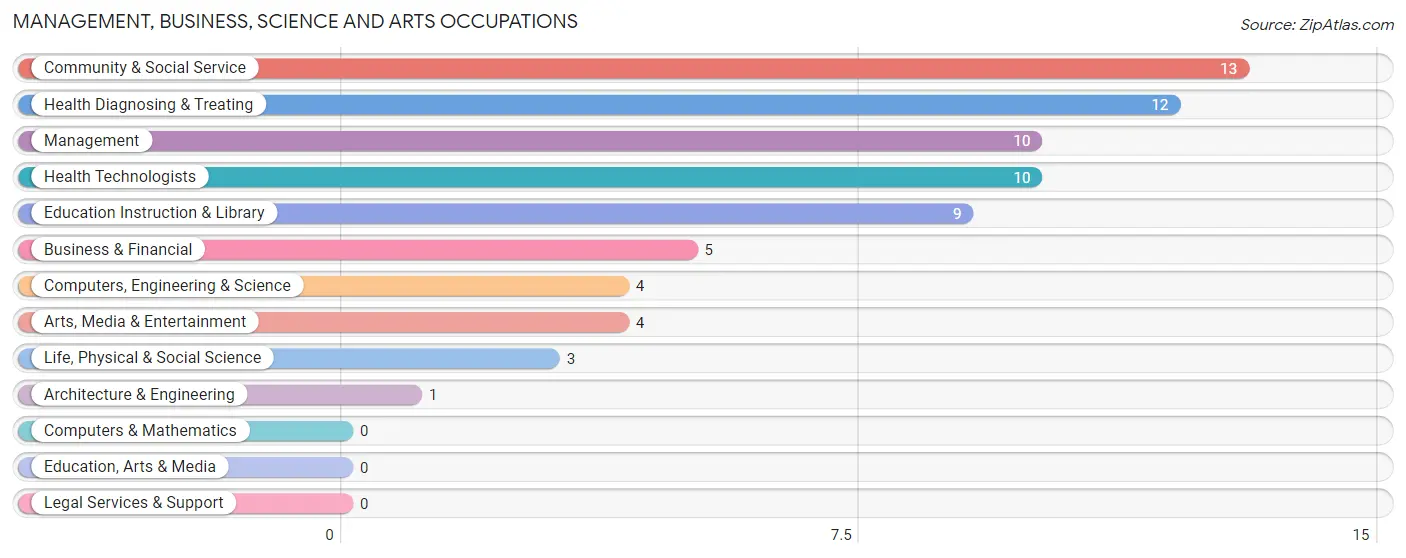
The most common Management, Business, Science and Arts occupations in Hardin are Community & Social Service (13 | 7.3%), Health Diagnosing & Treating (12 | 6.7%), Management (10 | 5.6%), Health Technologists (10 | 5.6%), and Education Instruction & Library (9 | 5.1%).
Management, Business, Science and Arts Occupations by Sex
Within the Management, Business, Science and Arts occupations in Hardin, the most male-oriented occupations are Computers, Engineering & Science (100.0%), Architecture & Engineering (100.0%), and Life, Physical & Social Science (100.0%), while the most female-oriented occupations are Health Diagnosing & Treating (100.0%), Health Technologists (100.0%), and Management (60.0%).
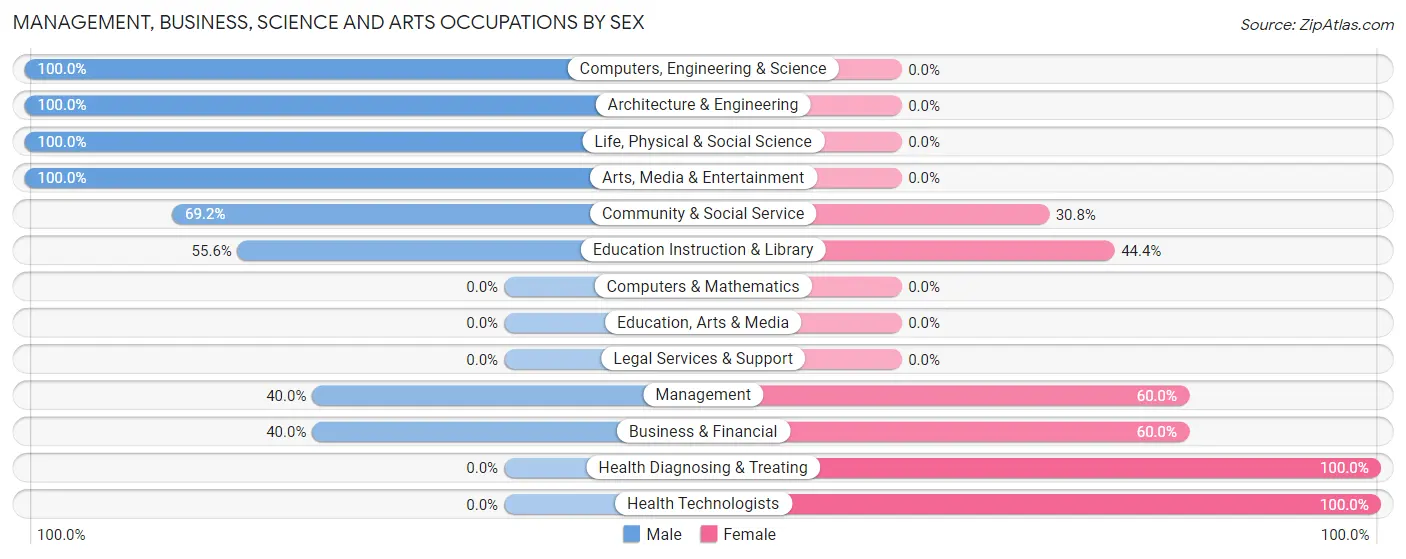
| Occupation | Male | Female |
| Management | 4 (40.0%) | 6 (60.0%) |
| Business & Financial | 2 (40.0%) | 3 (60.0%) |
| Computers, Engineering & Science | 4 (100.0%) | 0 (0.0%) |
| Computers & Mathematics | 0 (0.0%) | 0 (0.0%) |
| Architecture & Engineering | 1 (100.0%) | 0 (0.0%) |
| Life, Physical & Social Science | 3 (100.0%) | 0 (0.0%) |
| Community & Social Service | 9 (69.2%) | 4 (30.8%) |
| Education, Arts & Media | 0 (0.0%) | 0 (0.0%) |
| Legal Services & Support | 0 (0.0%) | 0 (0.0%) |
| Education Instruction & Library | 5 (55.6%) | 4 (44.4%) |
| Arts, Media & Entertainment | 4 (100.0%) | 0 (0.0%) |
| Health Diagnosing & Treating | 0 (0.0%) | 12 (100.0%) |
| Health Technologists | 0 (0.0%) | 10 (100.0%) |
| Total (Category) | 19 (43.2%) | 25 (56.8%) |
| Total (Overall) | 105 (59.0%) | 73 (41.0%) |
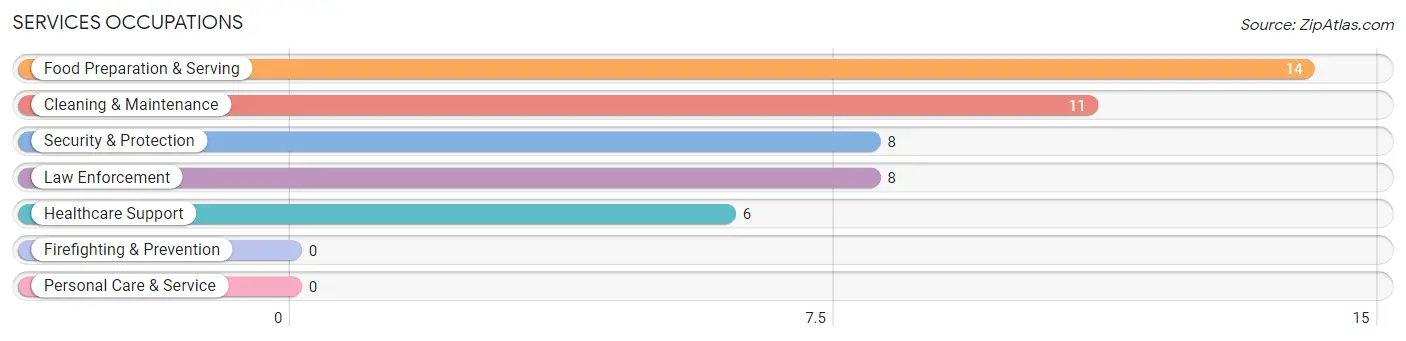
Services Occupations
The most common Services occupations in Hardin are Food Preparation & Serving (14 | 7.9%), Cleaning & Maintenance (11 | 6.2%), Security & Protection (8 | 4.5%), Law Enforcement (8 | 4.5%), and Healthcare Support (6 | 3.4%).
Services Occupations by Sex
Within the Services occupations in Hardin, the most male-oriented occupations are Security & Protection (100.0%), Law Enforcement (100.0%), and Food Preparation & Serving (85.7%), while the most female-oriented occupations are Healthcare Support (100.0%), Cleaning & Maintenance (18.2%), and Food Preparation & Serving (14.3%).
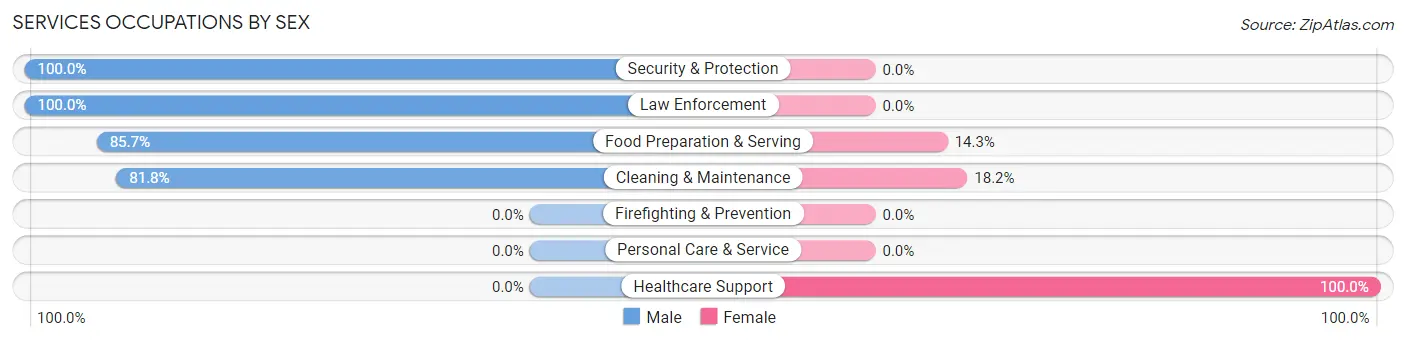
| Occupation | Male | Female |
| Healthcare Support | 0 (0.0%) | 6 (100.0%) |
| Security & Protection | 8 (100.0%) | 0 (0.0%) |
| Firefighting & Prevention | 0 (0.0%) | 0 (0.0%) |
| Law Enforcement | 8 (100.0%) | 0 (0.0%) |
| Food Preparation & Serving | 12 (85.7%) | 2 (14.3%) |
| Cleaning & Maintenance | 9 (81.8%) | 2 (18.2%) |
| Personal Care & Service | 0 (0.0%) | 0 (0.0%) |
| Total (Category) | 29 (74.4%) | 10 (25.6%) |
| Total (Overall) | 105 (59.0%) | 73 (41.0%) |
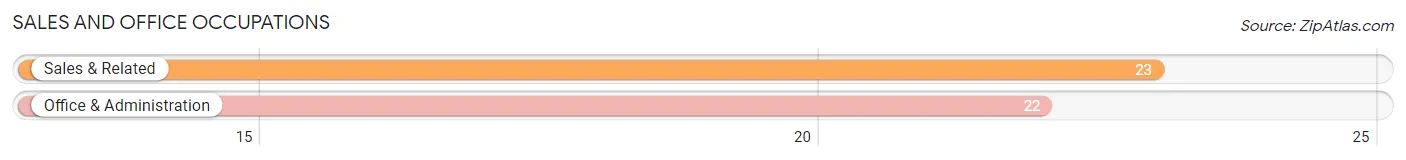
Sales and Office Occupations
The most common Sales and Office occupations in Hardin are Sales & Related (23 | 12.9%), and Office & Administration (22 | 12.4%).
Sales and Office Occupations by Sex
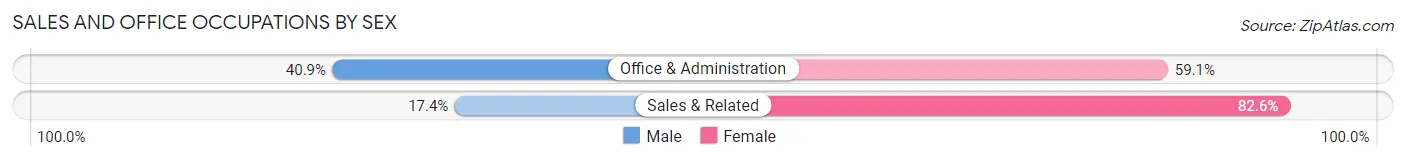
| Occupation | Male | Female |
| Sales & Related | 4 (17.4%) | 19 (82.6%) |
| Office & Administration | 9 (40.9%) | 13 (59.1%) |
| Total (Category) | 13 (28.9%) | 32 (71.1%) |
| Total (Overall) | 105 (59.0%) | 73 (41.0%) |
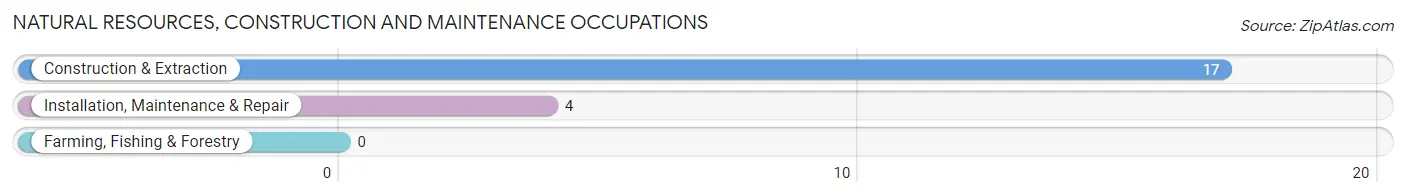
Natural Resources, Construction and Maintenance Occupations
The most common Natural Resources, Construction and Maintenance occupations in Hardin are Construction & Extraction (17 | 9.6%), and Installation, Maintenance & Repair (4 | 2.2%).
Natural Resources, Construction and Maintenance Occupations by Sex
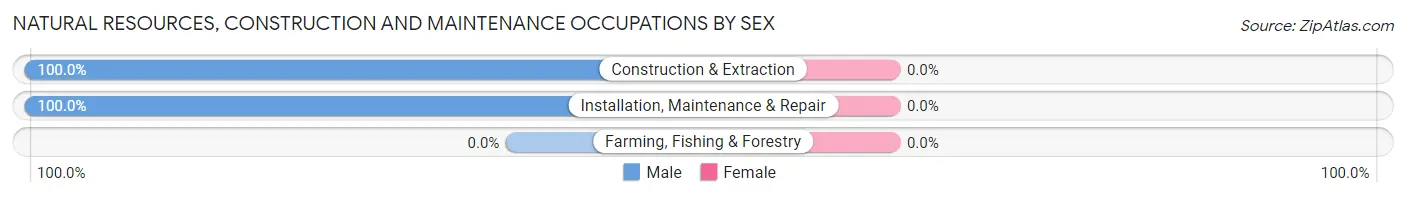
| Occupation | Male | Female |
| Farming, Fishing & Forestry | 0 (0.0%) | 0 (0.0%) |
| Construction & Extraction | 17 (100.0%) | 0 (0.0%) |
| Installation, Maintenance & Repair | 4 (100.0%) | 0 (0.0%) |
| Total (Category) | 21 (100.0%) | 0 (0.0%) |
| Total (Overall) | 105 (59.0%) | 73 (41.0%) |
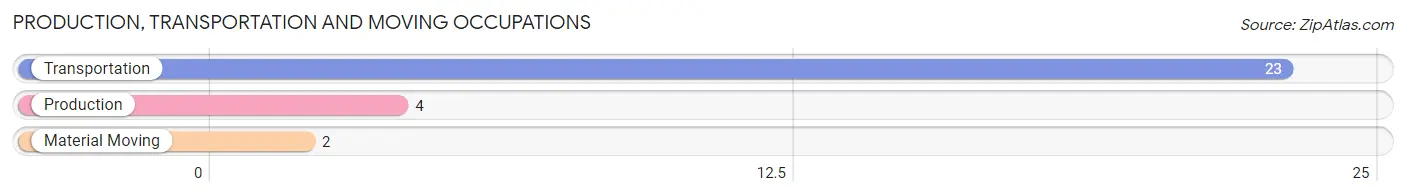
Production, Transportation and Moving Occupations
The most common Production, Transportation and Moving occupations in Hardin are Transportation (23 | 12.9%), Production (4 | 2.2%), and Material Moving (2 | 1.1%).
Production, Transportation and Moving Occupations by Sex
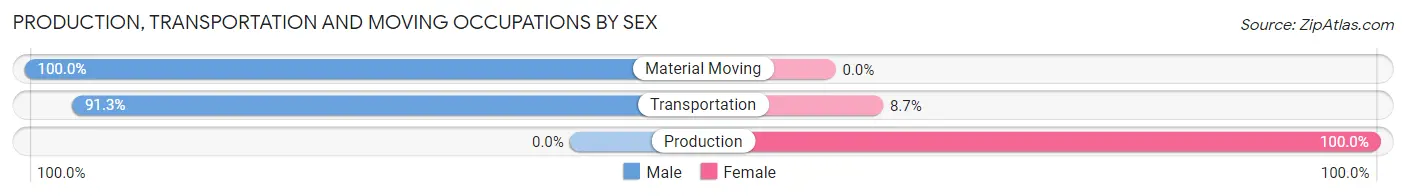
| Occupation | Male | Female |
| Production | 0 (0.0%) | 4 (100.0%) |
| Transportation | 21 (91.3%) | 2 (8.7%) |
| Material Moving | 2 (100.0%) | 0 (0.0%) |
| Total (Category) | 23 (79.3%) | 6 (20.7%) |
| Total (Overall) | 105 (59.0%) | 73 (41.0%) |
Employment Industries by Sex in Hardin
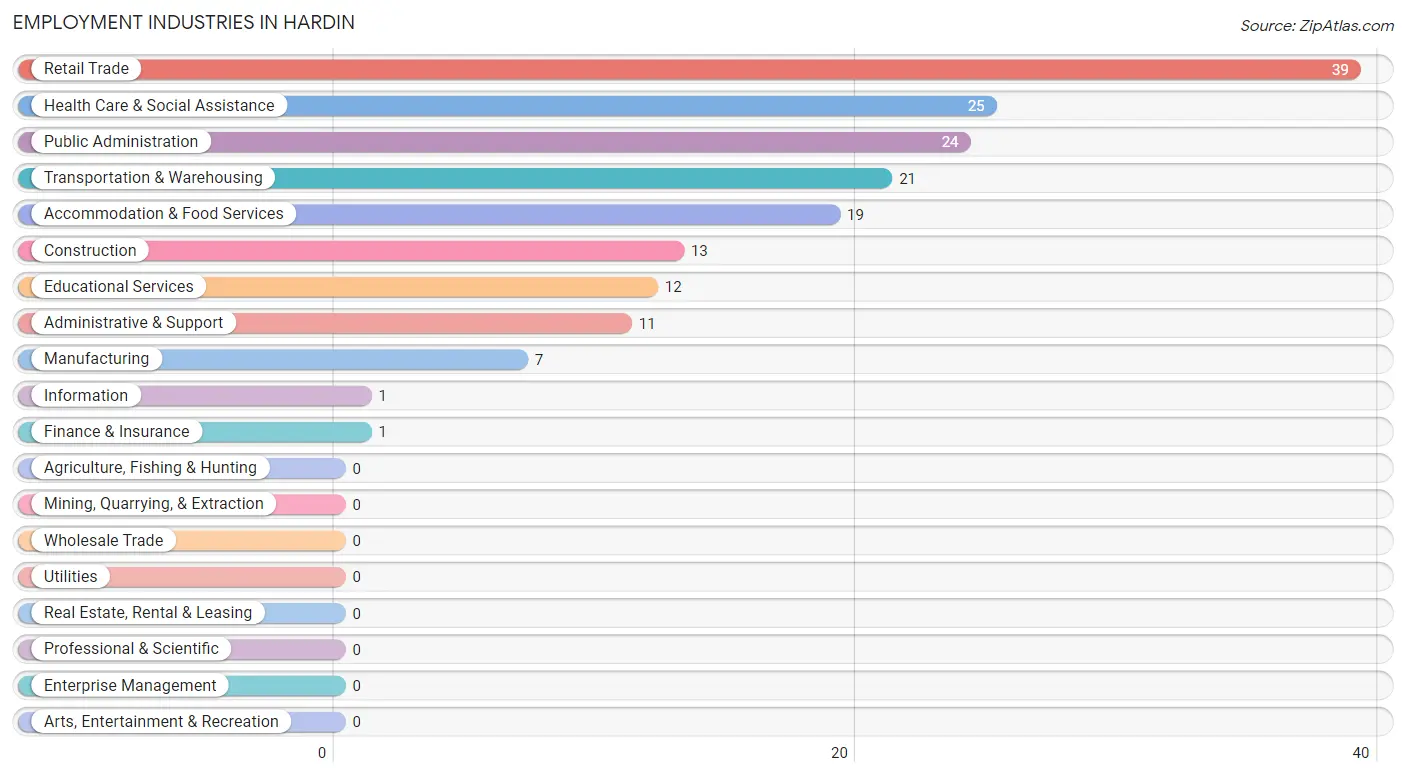
Employment Industries in Hardin
The major employment industries in Hardin include Retail Trade (39 | 21.9%), Health Care & Social Assistance (25 | 14.0%), Public Administration (24 | 13.5%), Transportation & Warehousing (21 | 11.8%), and Accommodation & Food Services (19 | 10.7%).
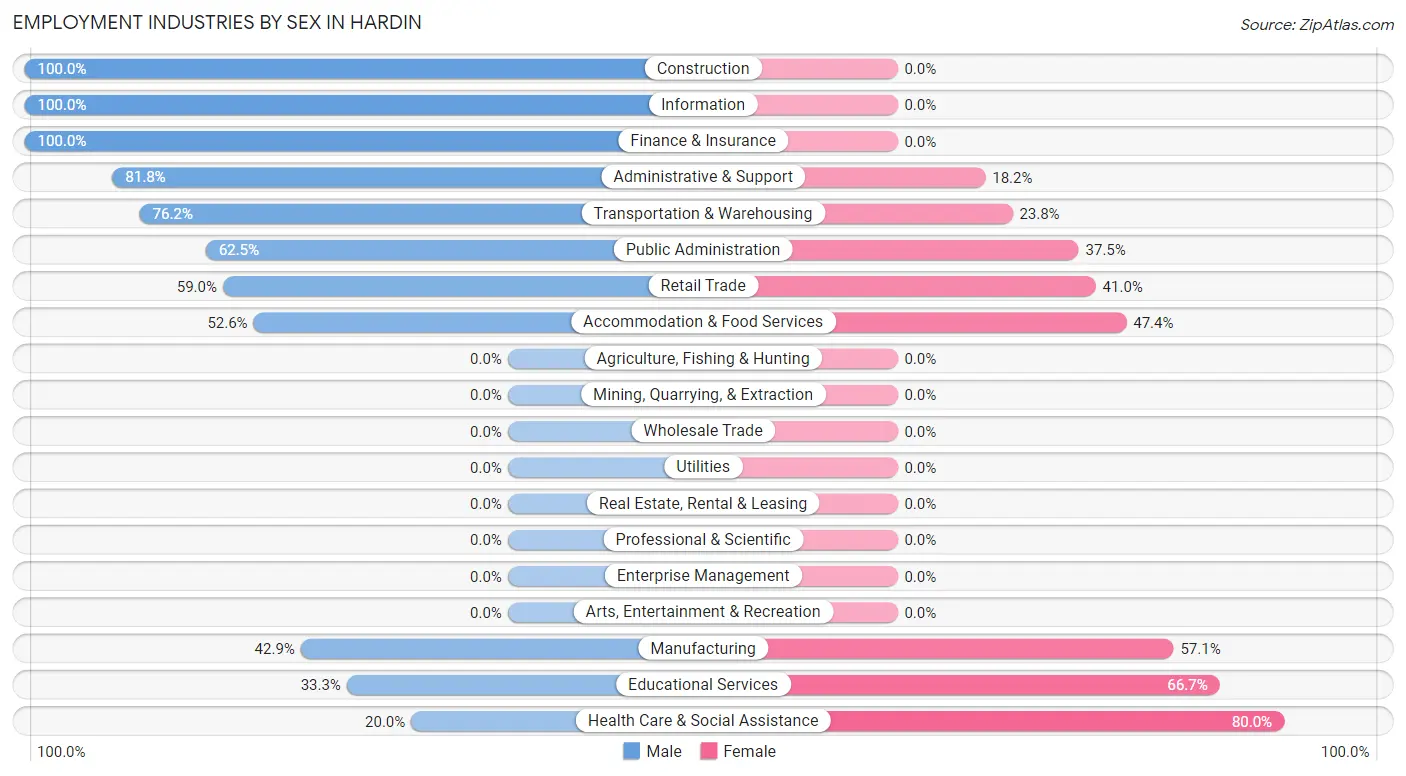
Employment Industries by Sex in Hardin
The Hardin industries that see more men than women are Construction (100.0%), Information (100.0%), and Finance & Insurance (100.0%), whereas the industries that tend to have a higher number of women are Health Care & Social Assistance (80.0%), Educational Services (66.7%), and Manufacturing (57.1%).
| Industry | Male | Female |
| Agriculture, Fishing & Hunting | 0 (0.0%) | 0 (0.0%) |
| Mining, Quarrying, & Extraction | 0 (0.0%) | 0 (0.0%) |
| Construction | 13 (100.0%) | 0 (0.0%) |
| Manufacturing | 3 (42.9%) | 4 (57.1%) |
| Wholesale Trade | 0 (0.0%) | 0 (0.0%) |
| Retail Trade | 23 (59.0%) | 16 (41.0%) |
| Transportation & Warehousing | 16 (76.2%) | 5 (23.8%) |
| Utilities | 0 (0.0%) | 0 (0.0%) |
| Information | 1 (100.0%) | 0 (0.0%) |
| Finance & Insurance | 1 (100.0%) | 0 (0.0%) |
| Real Estate, Rental & Leasing | 0 (0.0%) | 0 (0.0%) |
| Professional & Scientific | 0 (0.0%) | 0 (0.0%) |
| Enterprise Management | 0 (0.0%) | 0 (0.0%) |
| Administrative & Support | 9 (81.8%) | 2 (18.2%) |
| Educational Services | 4 (33.3%) | 8 (66.7%) |
| Health Care & Social Assistance | 5 (20.0%) | 20 (80.0%) |
| Arts, Entertainment & Recreation | 0 (0.0%) | 0 (0.0%) |
| Accommodation & Food Services | 10 (52.6%) | 9 (47.4%) |
| Public Administration | 15 (62.5%) | 9 (37.5%) |
| Total | 105 (59.0%) | 73 (41.0%) |
Education in Hardin
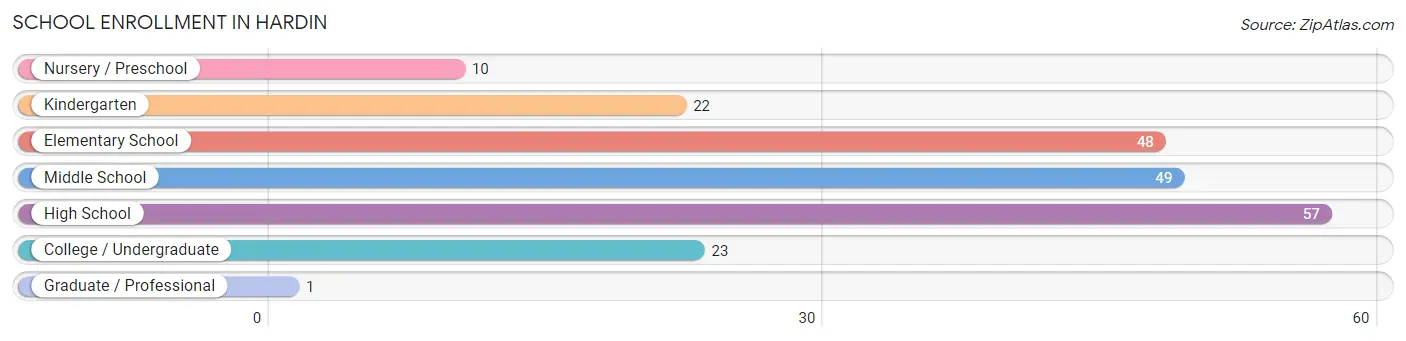
School Enrollment in Hardin
The most common levels of schooling among the 210 students in Hardin are high school (57 | 27.1%), middle school (49 | 23.3%), and elementary school (48 | 22.9%).
| School Level | # Students | % Students |
| Nursery / Preschool | 10 | 4.8% |
| Kindergarten | 22 | 10.5% |
| Elementary School | 48 | 22.9% |
| Middle School | 49 | 23.3% |
| High School | 57 | 27.1% |
| College / Undergraduate | 23 | 11.0% |
| Graduate / Professional | 1 | 0.5% |
| Total | 210 | 100.0% |
School Enrollment by Age by Funding Source in Hardin
Out of a total of 210 students who are enrolled in schools in Hardin, 16 (7.6%) attend a private institution, while the remaining 194 (92.4%) are enrolled in public schools. The age group of 5 to 9 year old has the highest likelihood of being enrolled in private schools, with 10 (20.4% in the age bracket) enrolled. Conversely, the age group of 3 to 4 year olds has the lowest likelihood of being enrolled in a private school, with 20 (100.0% in the age bracket) attending a public institution.
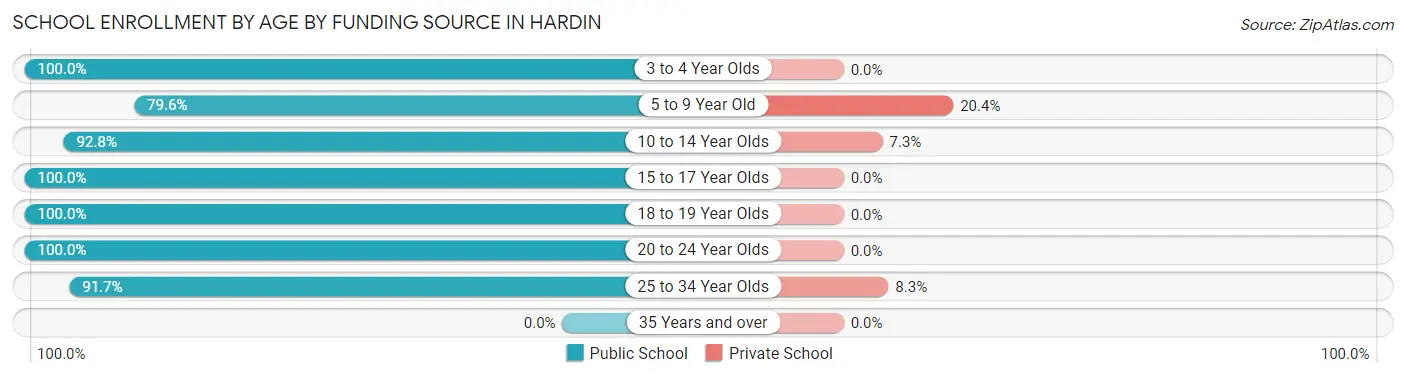
| Age Bracket | Public School | Private School |
| 3 to 4 Year Olds | 20 (100.0%) | 0 (0.0%) |
| 5 to 9 Year Old | 39 (79.6%) | 10 (20.4%) |
| 10 to 14 Year Olds | 64 (92.7%) | 5 (7.2%) |
| 15 to 17 Year Olds | 38 (100.0%) | 0 (0.0%) |
| 18 to 19 Year Olds | 10 (100.0%) | 0 (0.0%) |
| 20 to 24 Year Olds | 12 (100.0%) | 0 (0.0%) |
| 25 to 34 Year Olds | 11 (91.7%) | 1 (8.3%) |
| 35 Years and over | 0 (0.0%) | 0 (0.0%) |
| Total | 194 (92.4%) | 16 (7.6%) |
Educational Attainment by Field of Study in Hardin
Arts & humanities (5 | 23.8%), business (4 | 19.1%), education (4 | 19.1%), literature & languages (3 | 14.3%), and psychology (2 | 9.5%) are the most common fields of study among 21 individuals in Hardin who have obtained a bachelor's degree or higher.
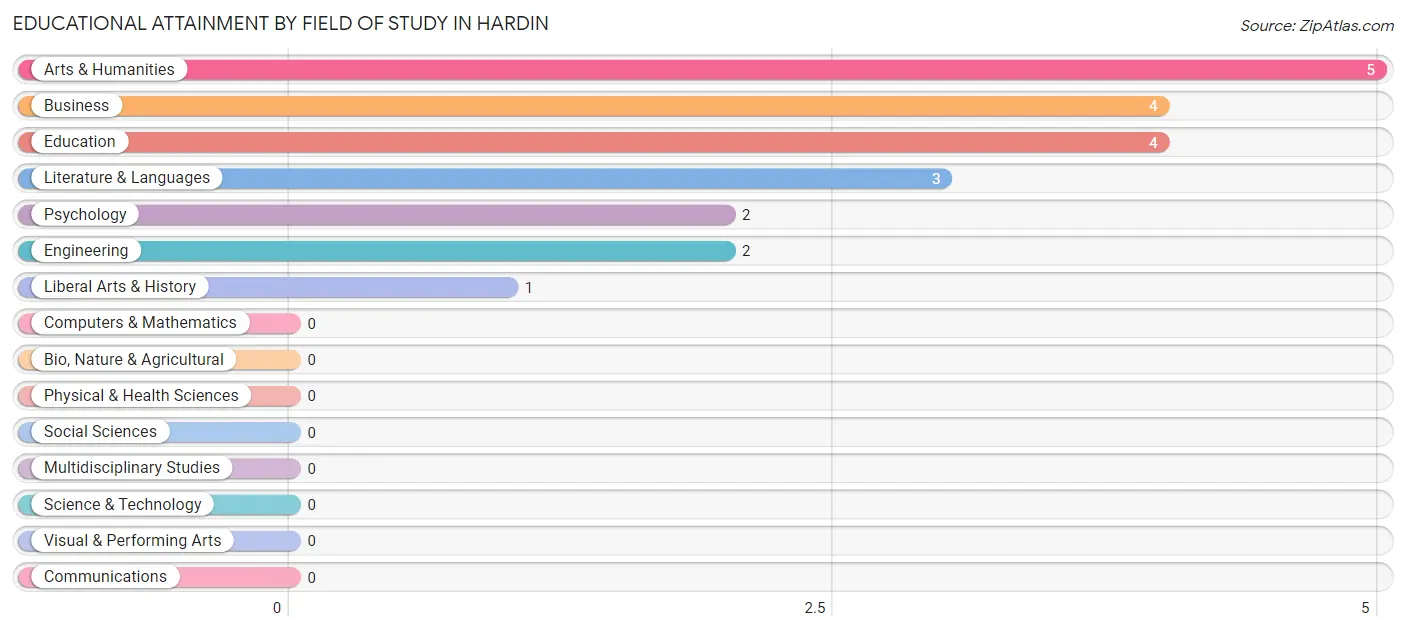
| Field of Study | # Graduates | % Graduates |
| Computers & Mathematics | 0 | 0.0% |
| Bio, Nature & Agricultural | 0 | 0.0% |
| Physical & Health Sciences | 0 | 0.0% |
| Psychology | 2 | 9.5% |
| Social Sciences | 0 | 0.0% |
| Engineering | 2 | 9.5% |
| Multidisciplinary Studies | 0 | 0.0% |
| Science & Technology | 0 | 0.0% |
| Business | 4 | 19.1% |
| Education | 4 | 19.1% |
| Literature & Languages | 3 | 14.3% |
| Liberal Arts & History | 1 | 4.8% |
| Visual & Performing Arts | 0 | 0.0% |
| Communications | 0 | 0.0% |
| Arts & Humanities | 5 | 23.8% |
| Total | 21 | 100.0% |
Transportation & Commute in Hardin
Vehicle Availability by Sex in Hardin
The most prevalent vehicle ownership categories in Hardin are males with 2 vehicles (45, accounting for 44.6%) and females with 2 vehicles (48, making up 61.6%).
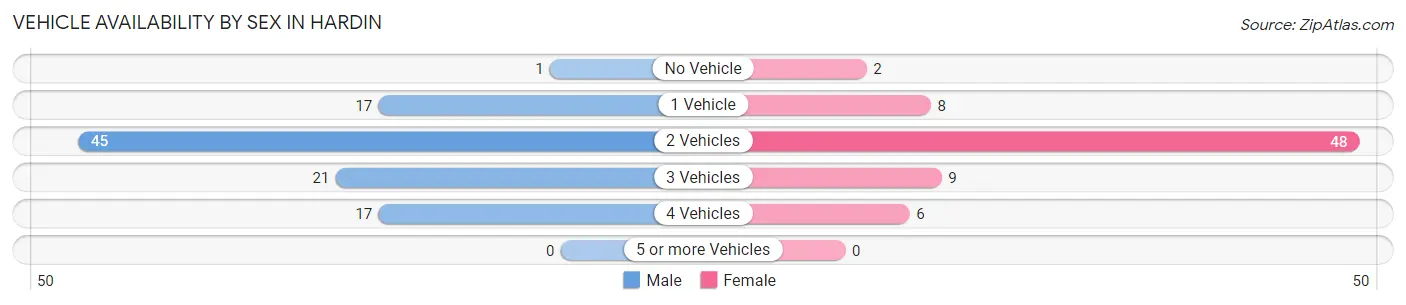
| Vehicles Available | Male | Female |
| No Vehicle | 1 (1.0%) | 2 (2.7%) |
| 1 Vehicle | 17 (16.8%) | 8 (11.0%) |
| 2 Vehicles | 45 (44.6%) | 48 (65.7%) |
| 3 Vehicles | 21 (20.8%) | 9 (12.3%) |
| 4 Vehicles | 17 (16.8%) | 6 (8.2%) |
| 5 or more Vehicles | 0 (0.0%) | 0 (0.0%) |
| Total | 101 (100.0%) | 73 (100.0%) |
Commute Time in Hardin
The most frequently occuring commute durations in Hardin are 10 to 14 minutes (49 commuters, 28.5%), 15 to 19 minutes (29 commuters, 16.9%), and 20 to 24 minutes (27 commuters, 15.7%).
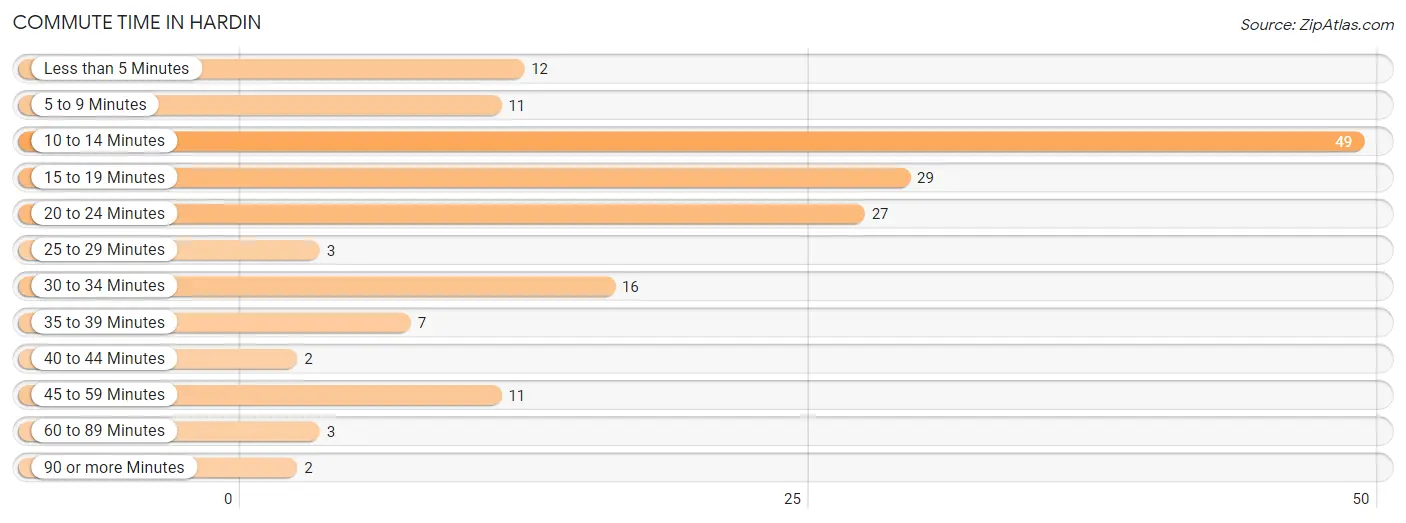
| Commute Time | # Commuters | % Commuters |
| Less than 5 Minutes | 12 | 7.0% |
| 5 to 9 Minutes | 11 | 6.4% |
| 10 to 14 Minutes | 49 | 28.5% |
| 15 to 19 Minutes | 29 | 16.9% |
| 20 to 24 Minutes | 27 | 15.7% |
| 25 to 29 Minutes | 3 | 1.7% |
| 30 to 34 Minutes | 16 | 9.3% |
| 35 to 39 Minutes | 7 | 4.1% |
| 40 to 44 Minutes | 2 | 1.2% |
| 45 to 59 Minutes | 11 | 6.4% |
| 60 to 89 Minutes | 3 | 1.7% |
| 90 or more Minutes | 2 | 1.2% |
Commute Time by Sex in Hardin
The most common commute times in Hardin are 10 to 14 minutes (38 commuters, 37.6%) for males and 20 to 24 minutes (22 commuters, 31.0%) for females.
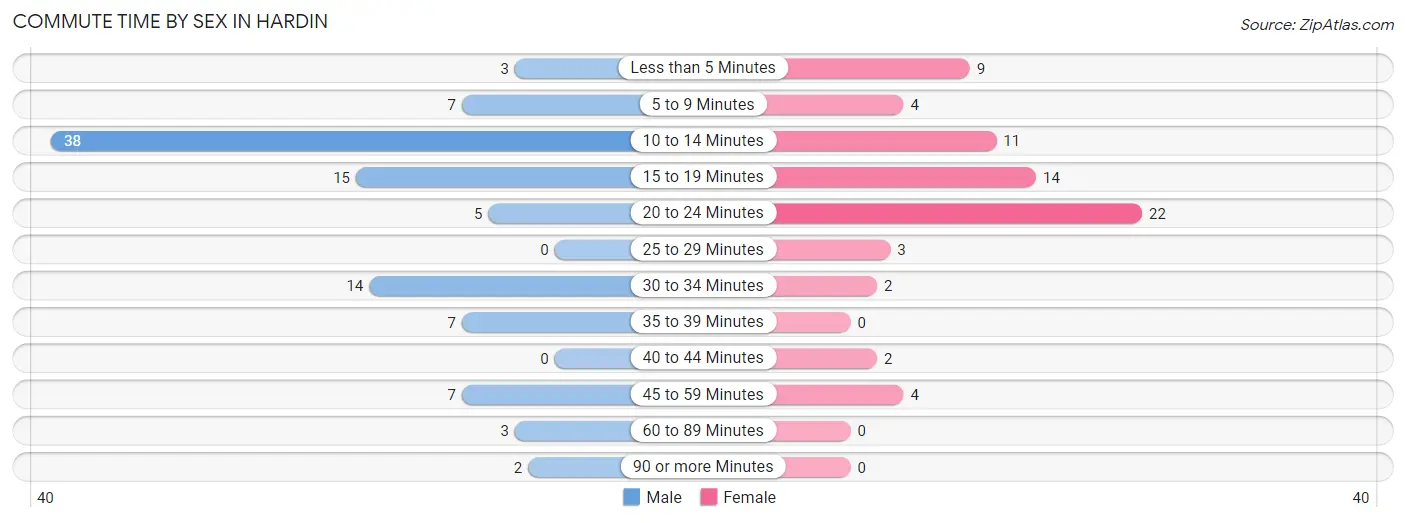
| Commute Time | Male | Female |
| Less than 5 Minutes | 3 (3.0%) | 9 (12.7%) |
| 5 to 9 Minutes | 7 (6.9%) | 4 (5.6%) |
| 10 to 14 Minutes | 38 (37.6%) | 11 (15.5%) |
| 15 to 19 Minutes | 15 (14.8%) | 14 (19.7%) |
| 20 to 24 Minutes | 5 (5.0%) | 22 (31.0%) |
| 25 to 29 Minutes | 0 (0.0%) | 3 (4.2%) |
| 30 to 34 Minutes | 14 (13.9%) | 2 (2.8%) |
| 35 to 39 Minutes | 7 (6.9%) | 0 (0.0%) |
| 40 to 44 Minutes | 0 (0.0%) | 2 (2.8%) |
| 45 to 59 Minutes | 7 (6.9%) | 4 (5.6%) |
| 60 to 89 Minutes | 3 (3.0%) | 0 (0.0%) |
| 90 or more Minutes | 2 (2.0%) | 0 (0.0%) |
Time of Departure to Work by Sex in Hardin
The most frequent times of departure to work in Hardin are 4:00 PM to 11:59 PM (18, 17.8%) for males and 9:00 AM to 9:59 AM (14, 19.7%) for females.
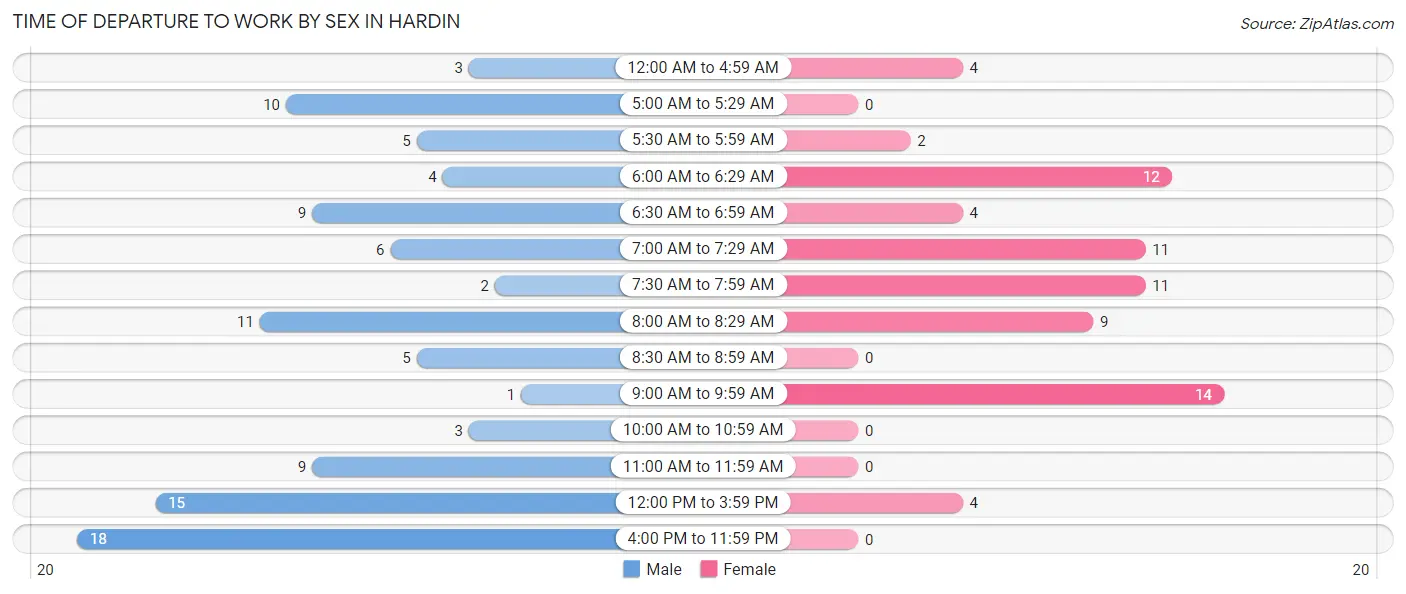
| Time of Departure | Male | Female |
| 12:00 AM to 4:59 AM | 3 (3.0%) | 4 (5.6%) |
| 5:00 AM to 5:29 AM | 10 (9.9%) | 0 (0.0%) |
| 5:30 AM to 5:59 AM | 5 (5.0%) | 2 (2.8%) |
| 6:00 AM to 6:29 AM | 4 (4.0%) | 12 (16.9%) |
| 6:30 AM to 6:59 AM | 9 (8.9%) | 4 (5.6%) |
| 7:00 AM to 7:29 AM | 6 (5.9%) | 11 (15.5%) |
| 7:30 AM to 7:59 AM | 2 (2.0%) | 11 (15.5%) |
| 8:00 AM to 8:29 AM | 11 (10.9%) | 9 (12.7%) |
| 8:30 AM to 8:59 AM | 5 (5.0%) | 0 (0.0%) |
| 9:00 AM to 9:59 AM | 1 (1.0%) | 14 (19.7%) |
| 10:00 AM to 10:59 AM | 3 (3.0%) | 0 (0.0%) |
| 11:00 AM to 11:59 AM | 9 (8.9%) | 0 (0.0%) |
| 12:00 PM to 3:59 PM | 15 (14.8%) | 4 (5.6%) |
| 4:00 PM to 11:59 PM | 18 (17.8%) | 0 (0.0%) |
| Total | 101 (100.0%) | 71 (100.0%) |
Housing Occupancy in Hardin
Occupancy by Ownership in Hardin
Of the total 261 dwellings in Hardin, owner-occupied units account for 138 (52.9%), while renter-occupied units make up 123 (47.1%).
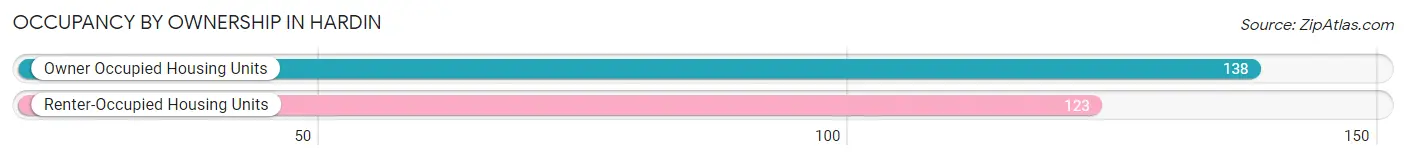
| Occupancy | # Housing Units | % Housing Units |
| Owner Occupied Housing Units | 138 | 52.9% |
| Renter-Occupied Housing Units | 123 | 47.1% |
| Total Occupied Housing Units | 261 | 100.0% |
Occupancy by Household Size in Hardin
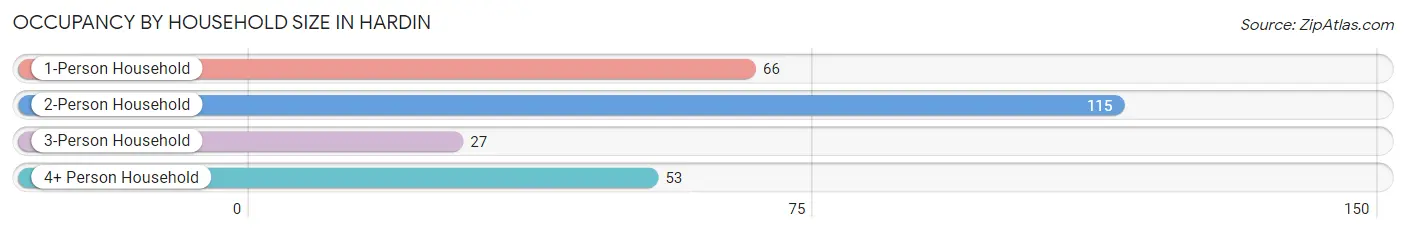
| Household Size | # Housing Units | % Housing Units |
| 1-Person Household | 66 | 25.3% |
| 2-Person Household | 115 | 44.1% |
| 3-Person Household | 27 | 10.3% |
| 4+ Person Household | 53 | 20.3% |
| Total Housing Units | 261 | 100.0% |
Occupancy by Ownership by Household Size in Hardin
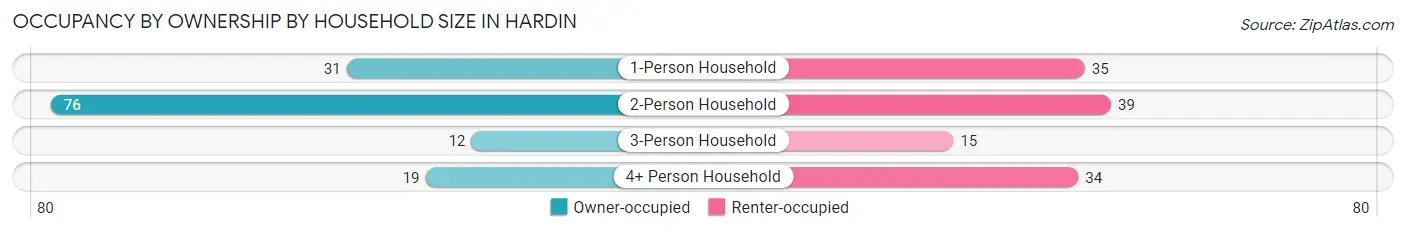
| Household Size | Owner-occupied | Renter-occupied |
| 1-Person Household | 31 (47.0%) | 35 (53.0%) |
| 2-Person Household | 76 (66.1%) | 39 (33.9%) |
| 3-Person Household | 12 (44.4%) | 15 (55.6%) |
| 4+ Person Household | 19 (35.8%) | 34 (64.1%) |
| Total Housing Units | 138 (52.9%) | 123 (47.1%) |
Occupancy by Educational Attainment in Hardin
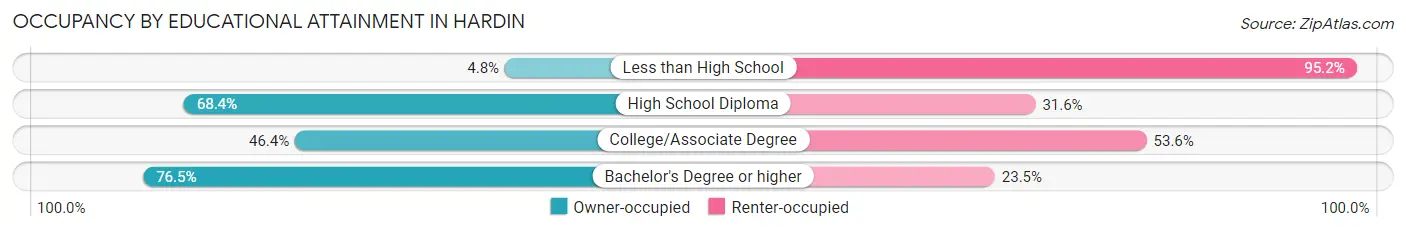
| Household Size | Owner-occupied | Renter-occupied |
| Less than High School | 2 (4.8%) | 40 (95.2%) |
| High School Diploma | 91 (68.4%) | 42 (31.6%) |
| College/Associate Degree | 32 (46.4%) | 37 (53.6%) |
| Bachelor's Degree or higher | 13 (76.5%) | 4 (23.5%) |
Occupancy by Age of Householder in Hardin
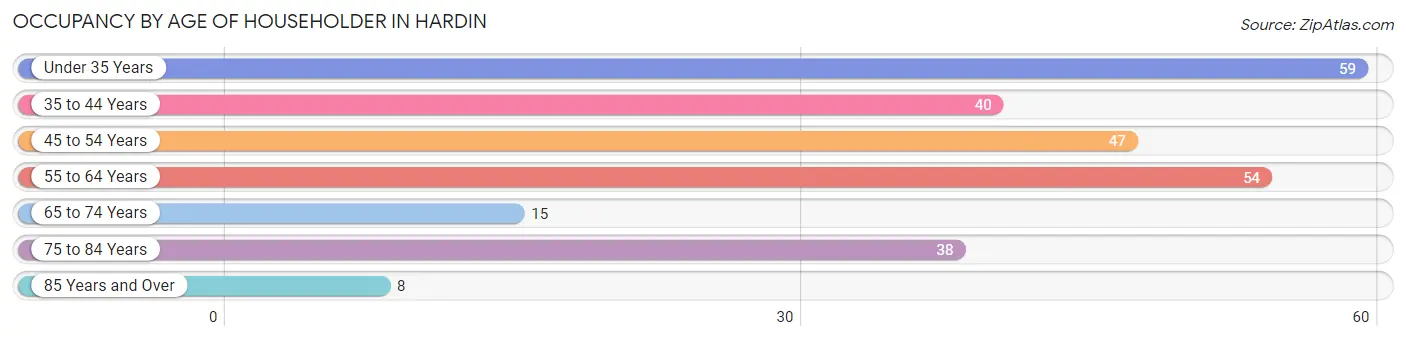
| Age Bracket | # Households | % Households |
| Under 35 Years | 59 | 22.6% |
| 35 to 44 Years | 40 | 15.3% |
| 45 to 54 Years | 47 | 18.0% |
| 55 to 64 Years | 54 | 20.7% |
| 65 to 74 Years | 15 | 5.8% |
| 75 to 84 Years | 38 | 14.6% |
| 85 Years and Over | 8 | 3.1% |
| Total | 261 | 100.0% |
Housing Finances in Hardin
Median Income by Occupancy in Hardin
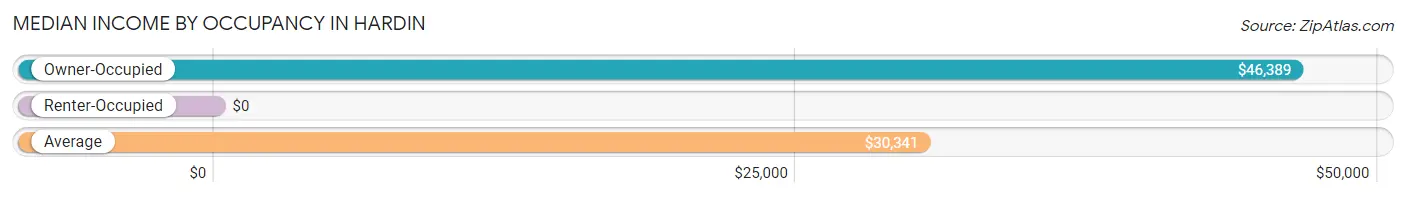
| Occupancy Type | # Households | Median Income |
| Owner-Occupied | 138 (52.9%) | $46,389 |
| Renter-Occupied | 123 (47.1%) | $0 |
| Average | 261 (100.0%) | $30,341 |
Occupancy by Householder Income Bracket in Hardin
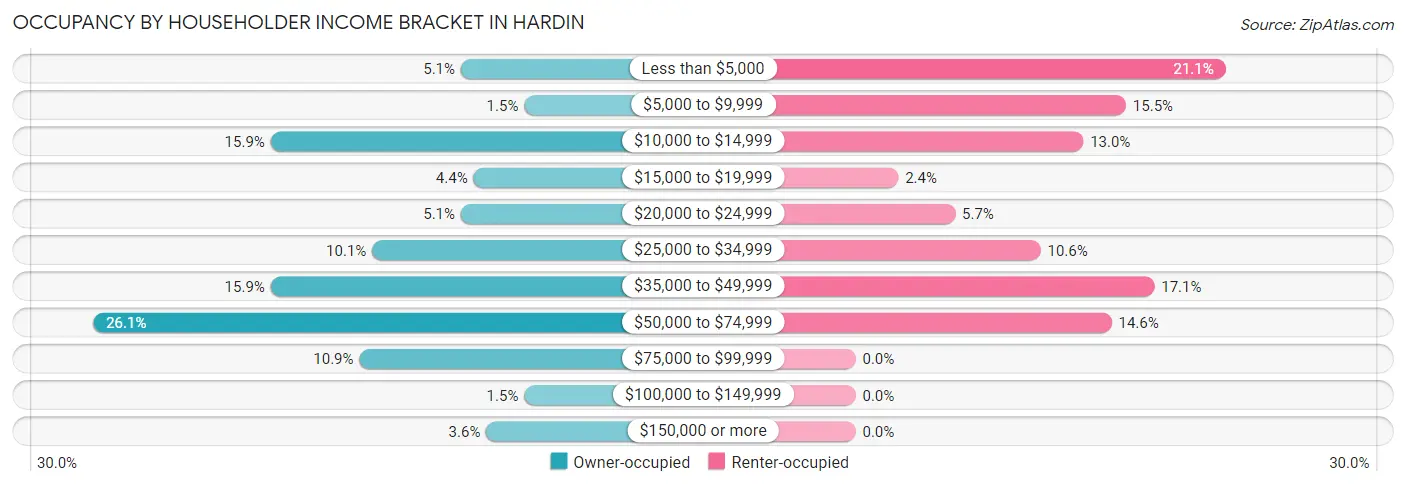
| Income Bracket | Owner-occupied | Renter-occupied |
| Less than $5,000 | 7 (5.1%) | 26 (21.1%) |
| $5,000 to $9,999 | 2 (1.5%) | 19 (15.4%) |
| $10,000 to $14,999 | 22 (15.9%) | 16 (13.0%) |
| $15,000 to $19,999 | 6 (4.3%) | 3 (2.4%) |
| $20,000 to $24,999 | 7 (5.1%) | 7 (5.7%) |
| $25,000 to $34,999 | 14 (10.1%) | 13 (10.6%) |
| $35,000 to $49,999 | 22 (15.9%) | 21 (17.1%) |
| $50,000 to $74,999 | 36 (26.1%) | 18 (14.6%) |
| $75,000 to $99,999 | 15 (10.9%) | 0 (0.0%) |
| $100,000 to $149,999 | 2 (1.5%) | 0 (0.0%) |
| $150,000 or more | 5 (3.6%) | 0 (0.0%) |
| Total | 138 (100.0%) | 123 (100.0%) |
Monthly Housing Cost Tiers in Hardin
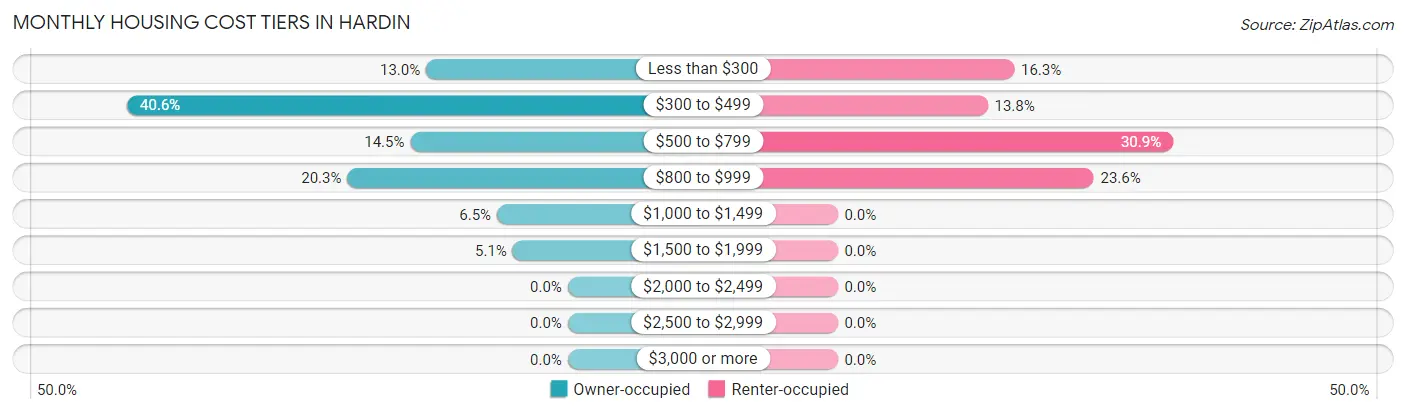
| Monthly Cost | Owner-occupied | Renter-occupied |
| Less than $300 | 18 (13.0%) | 20 (16.3%) |
| $300 to $499 | 56 (40.6%) | 17 (13.8%) |
| $500 to $799 | 20 (14.5%) | 38 (30.9%) |
| $800 to $999 | 28 (20.3%) | 29 (23.6%) |
| $1,000 to $1,499 | 9 (6.5%) | 0 (0.0%) |
| $1,500 to $1,999 | 7 (5.1%) | 0 (0.0%) |
| $2,000 to $2,499 | 0 (0.0%) | 0 (0.0%) |
| $2,500 to $2,999 | 0 (0.0%) | 0 (0.0%) |
| $3,000 or more | 0 (0.0%) | 0 (0.0%) |
| Total | 138 (100.0%) | 123 (100.0%) |
Physical Housing Characteristics in Hardin
Housing Structures in Hardin
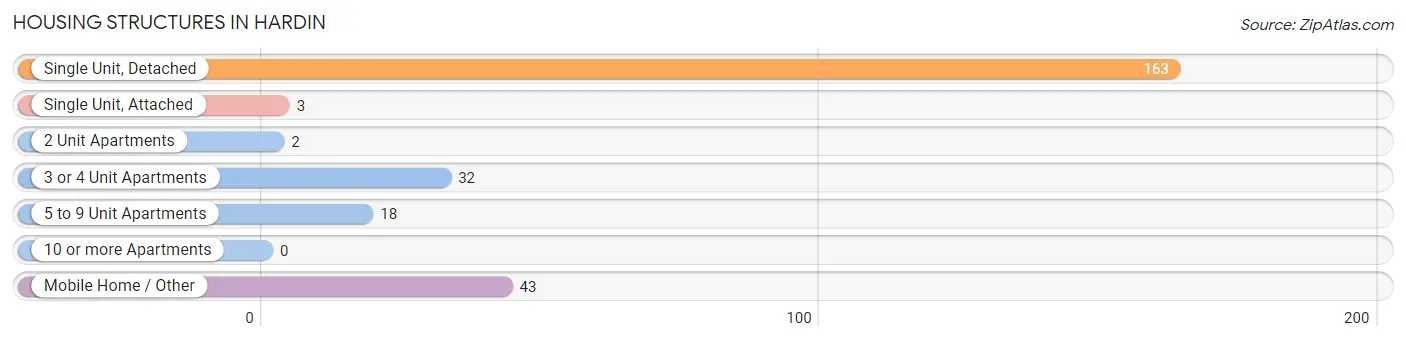
| Structure Type | # Housing Units | % Housing Units |
| Single Unit, Detached | 163 | 62.5% |
| Single Unit, Attached | 3 | 1.1% |
| 2 Unit Apartments | 2 | 0.8% |
| 3 or 4 Unit Apartments | 32 | 12.3% |
| 5 to 9 Unit Apartments | 18 | 6.9% |
| 10 or more Apartments | 0 | 0.0% |
| Mobile Home / Other | 43 | 16.5% |
| Total | 261 | 100.0% |
Housing Structures by Occupancy in Hardin
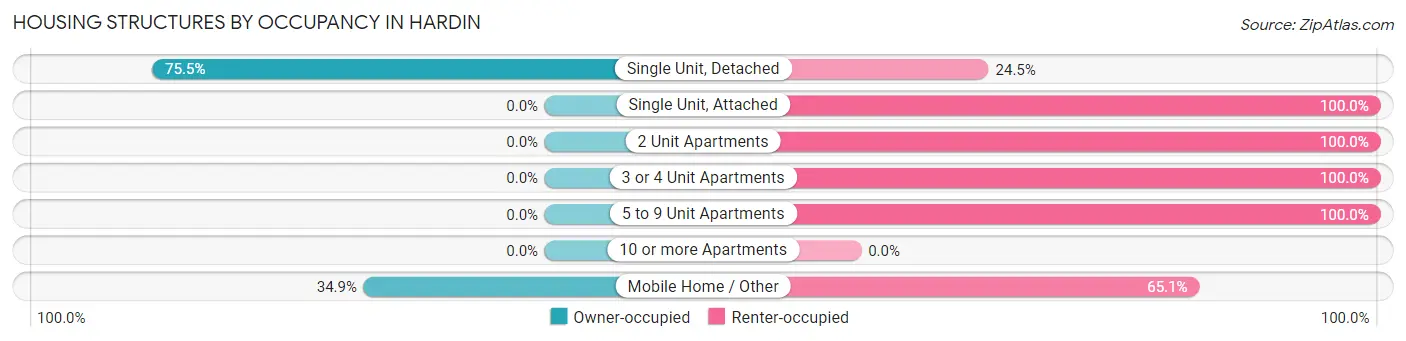
| Structure Type | Owner-occupied | Renter-occupied |
| Single Unit, Detached | 123 (75.5%) | 40 (24.5%) |
| Single Unit, Attached | 0 (0.0%) | 3 (100.0%) |
| 2 Unit Apartments | 0 (0.0%) | 2 (100.0%) |
| 3 or 4 Unit Apartments | 0 (0.0%) | 32 (100.0%) |
| 5 to 9 Unit Apartments | 0 (0.0%) | 18 (100.0%) |
| 10 or more Apartments | 0 (0.0%) | 0 (0.0%) |
| Mobile Home / Other | 15 (34.9%) | 28 (65.1%) |
| Total | 138 (52.9%) | 123 (47.1%) |
Housing Structures by Number of Rooms in Hardin
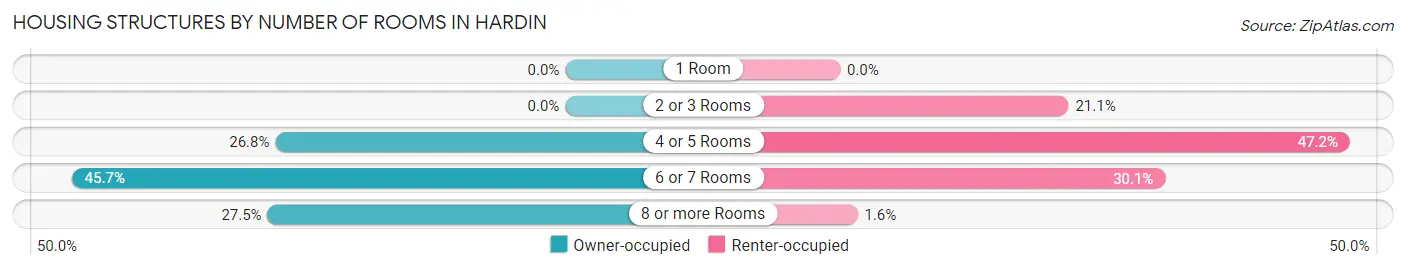
| Number of Rooms | Owner-occupied | Renter-occupied |
| 1 Room | 0 (0.0%) | 0 (0.0%) |
| 2 or 3 Rooms | 0 (0.0%) | 26 (21.1%) |
| 4 or 5 Rooms | 37 (26.8%) | 58 (47.1%) |
| 6 or 7 Rooms | 63 (45.7%) | 37 (30.1%) |
| 8 or more Rooms | 38 (27.5%) | 2 (1.6%) |
| Total | 138 (100.0%) | 123 (100.0%) |
Housing Structure by Heating Type in Hardin
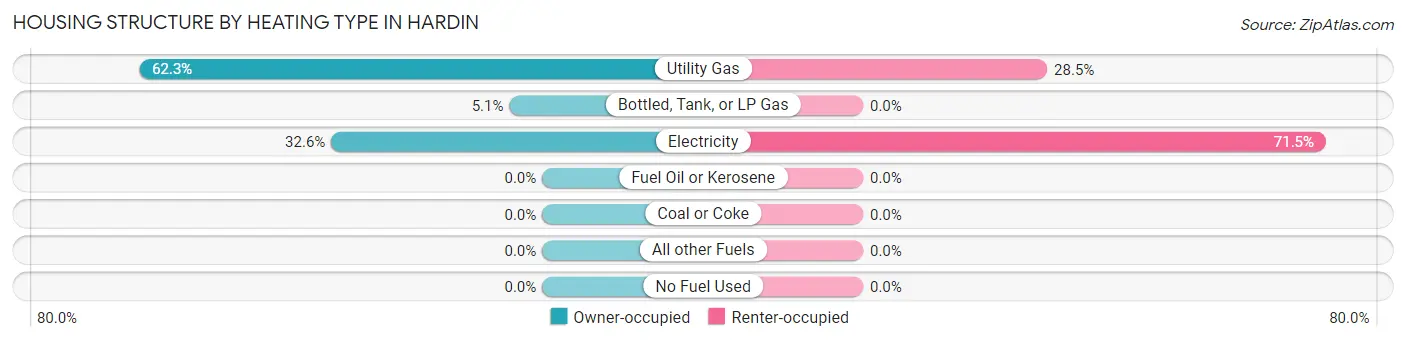
| Heating Type | Owner-occupied | Renter-occupied |
| Utility Gas | 86 (62.3%) | 35 (28.5%) |
| Bottled, Tank, or LP Gas | 7 (5.1%) | 0 (0.0%) |
| Electricity | 45 (32.6%) | 88 (71.5%) |
| Fuel Oil or Kerosene | 0 (0.0%) | 0 (0.0%) |
| Coal or Coke | 0 (0.0%) | 0 (0.0%) |
| All other Fuels | 0 (0.0%) | 0 (0.0%) |
| No Fuel Used | 0 (0.0%) | 0 (0.0%) |
| Total | 138 (100.0%) | 123 (100.0%) |
Household Vehicle Usage in Hardin
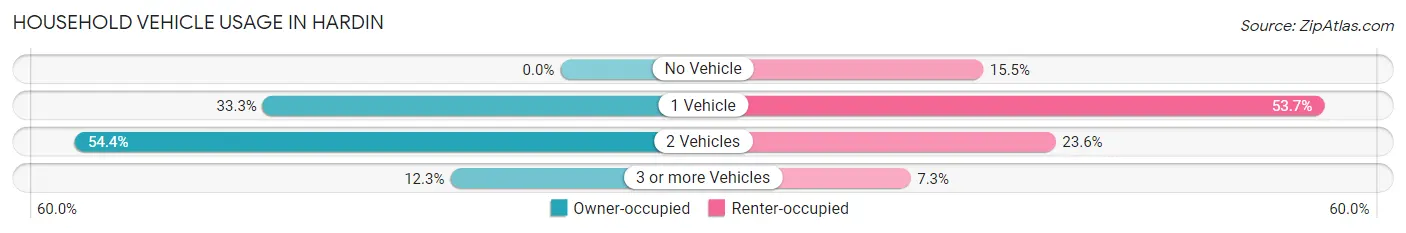
| Vehicles per Household | Owner-occupied | Renter-occupied |
| No Vehicle | 0 (0.0%) | 19 (15.4%) |
| 1 Vehicle | 46 (33.3%) | 66 (53.7%) |
| 2 Vehicles | 75 (54.3%) | 29 (23.6%) |
| 3 or more Vehicles | 17 (12.3%) | 9 (7.3%) |
| Total | 138 (100.0%) | 123 (100.0%) |
Real Estate & Mortgages in Hardin
Real Estate and Mortgage Overview in Hardin
| Characteristic | Without Mortgage | With Mortgage |
| Housing Units | 72 | 66 |
| Median Property Value | $90,000 | $95,000 |
| Median Household Income | - | - |
| Monthly Housing Costs | $365 | $0 |
| Real Estate Taxes | - | - |
Property Value by Mortgage Status in Hardin
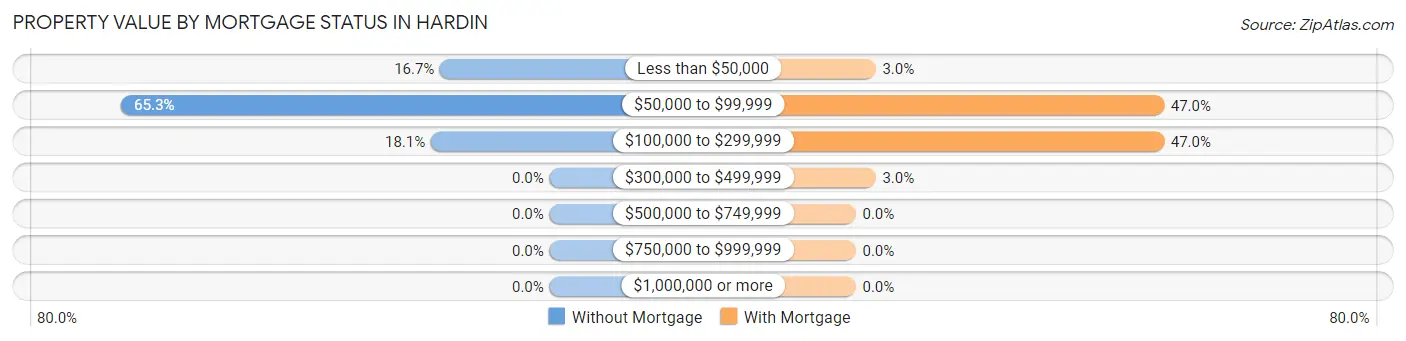
| Property Value | Without Mortgage | With Mortgage |
| Less than $50,000 | 12 (16.7%) | 2 (3.0%) |
| $50,000 to $99,999 | 47 (65.3%) | 31 (47.0%) |
| $100,000 to $299,999 | 13 (18.1%) | 31 (47.0%) |
| $300,000 to $499,999 | 0 (0.0%) | 2 (3.0%) |
| $500,000 to $749,999 | 0 (0.0%) | 0 (0.0%) |
| $750,000 to $999,999 | 0 (0.0%) | 0 (0.0%) |
| $1,000,000 or more | 0 (0.0%) | 0 (0.0%) |
| Total | 72 (100.0%) | 66 (100.0%) |
Household Income by Mortgage Status in Hardin
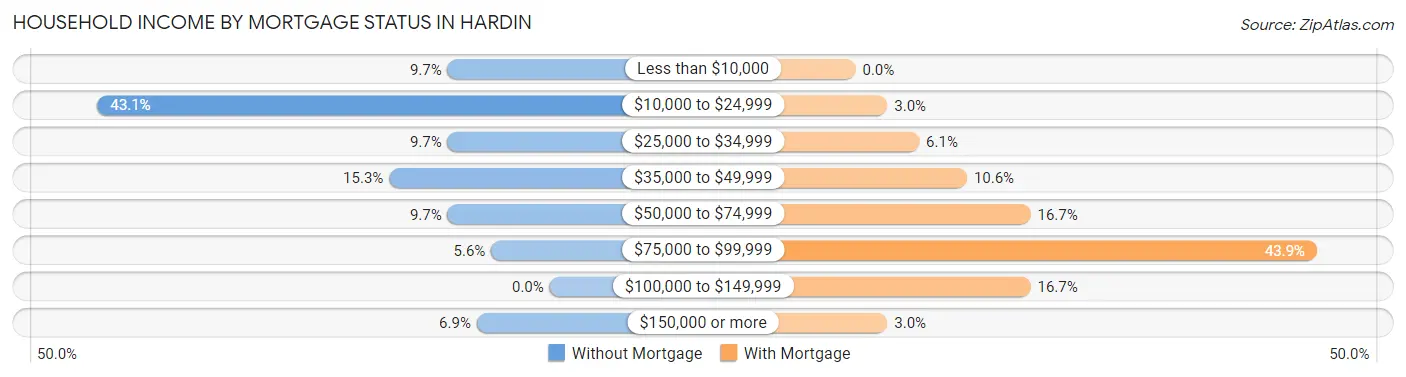
| Household Income | Without Mortgage | With Mortgage |
| Less than $10,000 | 7 (9.7%) | 0 (0.0%) |
| $10,000 to $24,999 | 31 (43.1%) | 2 (3.0%) |
| $25,000 to $34,999 | 7 (9.7%) | 4 (6.1%) |
| $35,000 to $49,999 | 11 (15.3%) | 7 (10.6%) |
| $50,000 to $74,999 | 7 (9.7%) | 11 (16.7%) |
| $75,000 to $99,999 | 4 (5.6%) | 29 (43.9%) |
| $100,000 to $149,999 | 0 (0.0%) | 11 (16.7%) |
| $150,000 or more | 5 (6.9%) | 2 (3.0%) |
| Total | 72 (100.0%) | 66 (100.0%) |
Property Value to Household Income Ratio in Hardin
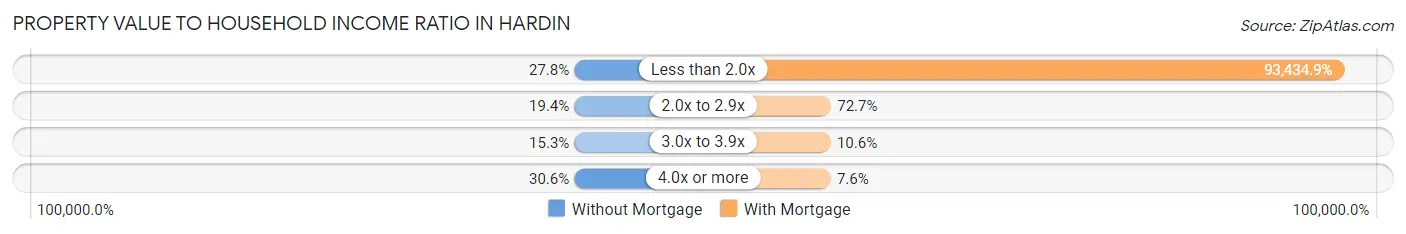
| Value-to-Income Ratio | Without Mortgage | With Mortgage |
| Less than 2.0x | 20 (27.8%) | 61,667 (93,434.8%) |
| 2.0x to 2.9x | 14 (19.4%) | 48 (72.7%) |
| 3.0x to 3.9x | 11 (15.3%) | 7 (10.6%) |
| 4.0x or more | 22 (30.6%) | 5 (7.6%) |
| Total | 72 (100.0%) | 66 (100.0%) |
Real Estate Taxes by Mortgage Status in Hardin
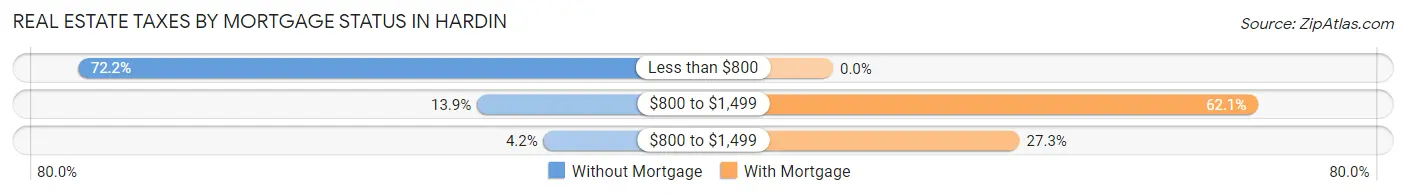
| Property Taxes | Without Mortgage | With Mortgage |
| Less than $800 | 52 (72.2%) | 0 (0.0%) |
| $800 to $1,499 | 10 (13.9%) | 41 (62.1%) |
| $800 to $1,499 | 3 (4.2%) | 18 (27.3%) |
| Total | 72 (100.0%) | 66 (100.0%) |
Health & Disability in Hardin
Health Insurance Coverage by Age in Hardin
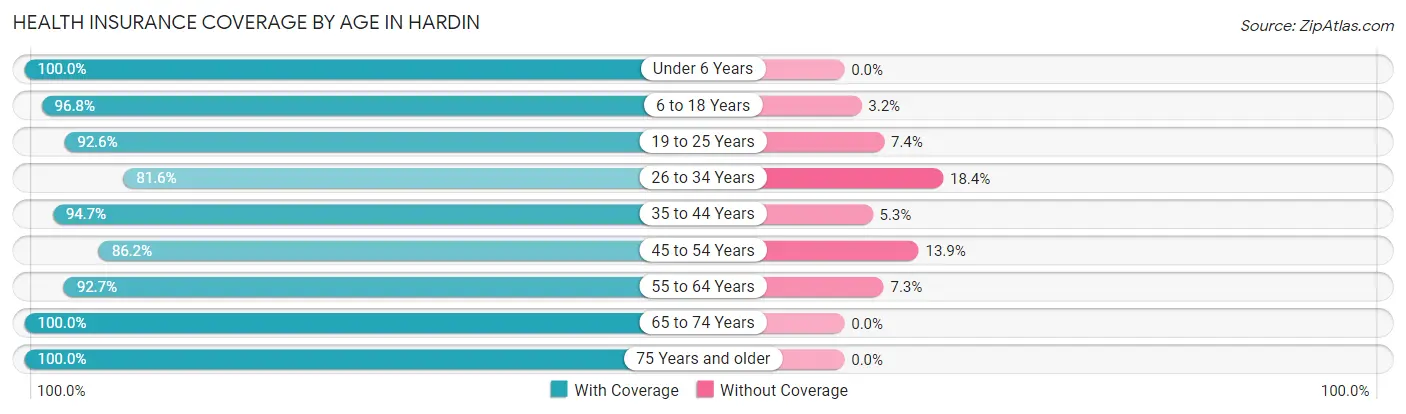
| Age Bracket | With Coverage | Without Coverage |
| Under 6 Years | 53 (100.0%) | 0 (0.0%) |
| 6 to 18 Years | 152 (96.8%) | 5 (3.2%) |
| 19 to 25 Years | 50 (92.6%) | 4 (7.4%) |
| 26 to 34 Years | 62 (81.6%) | 14 (18.4%) |
| 35 to 44 Years | 54 (94.7%) | 3 (5.3%) |
| 45 to 54 Years | 56 (86.2%) | 9 (13.9%) |
| 55 to 64 Years | 76 (92.7%) | 6 (7.3%) |
| 65 to 74 Years | 20 (100.0%) | 0 (0.0%) |
| 75 Years and older | 65 (100.0%) | 0 (0.0%) |
| Total | 588 (93.5%) | 41 (6.5%) |
Health Insurance Coverage by Citizenship Status in Hardin
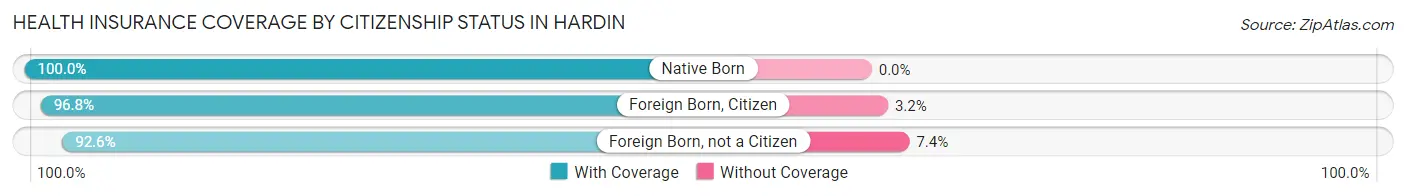
| Citizenship Status | With Coverage | Without Coverage |
| Native Born | 53 (100.0%) | 0 (0.0%) |
| Foreign Born, Citizen | 152 (96.8%) | 5 (3.2%) |
| Foreign Born, not a Citizen | 50 (92.6%) | 4 (7.4%) |
Health Insurance Coverage by Household Income in Hardin
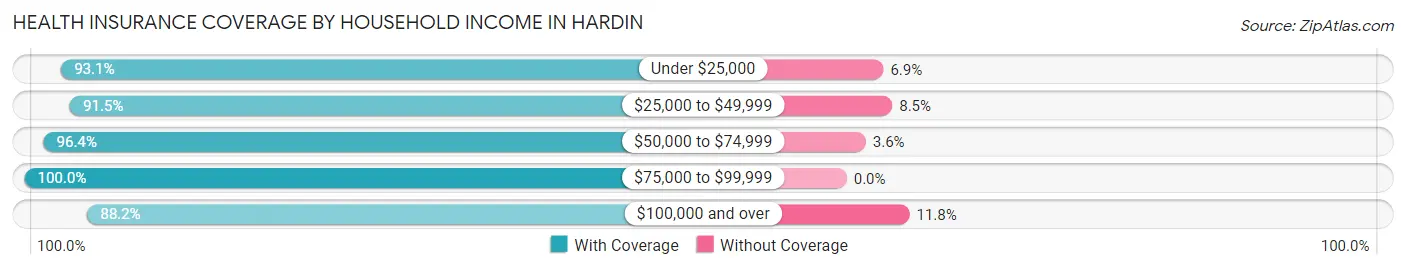
| Household Income | With Coverage | Without Coverage |
| Under $25,000 | 217 (93.1%) | 16 (6.9%) |
| $25,000 to $49,999 | 204 (91.5%) | 19 (8.5%) |
| $50,000 to $74,999 | 108 (96.4%) | 4 (3.6%) |
| $75,000 to $99,999 | 44 (100.0%) | 0 (0.0%) |
| $100,000 and over | 15 (88.2%) | 2 (11.8%) |
Public vs Private Health Insurance Coverage by Age in Hardin
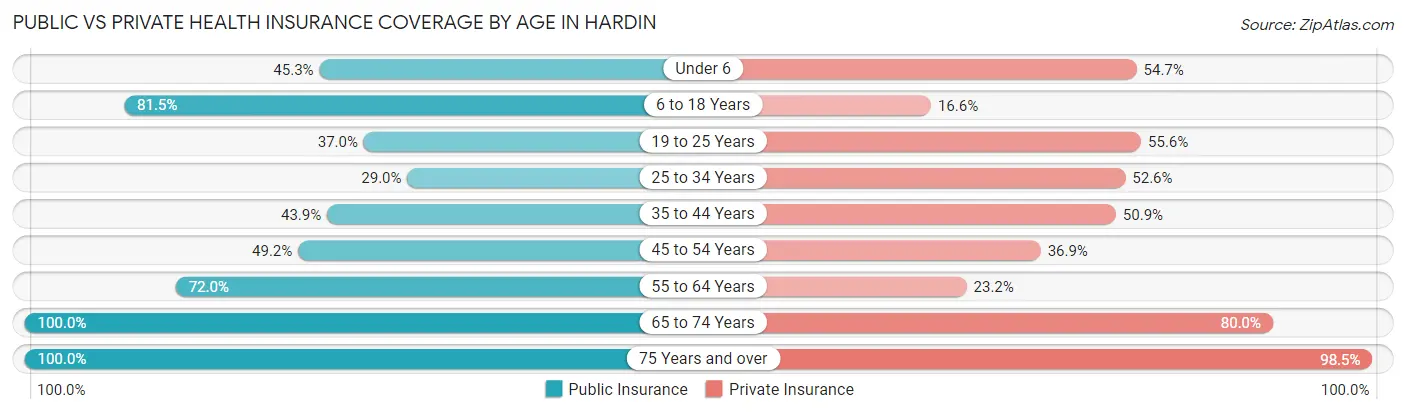
| Age Bracket | Public Insurance | Private Insurance |
| Under 6 | 24 (45.3%) | 29 (54.7%) |
| 6 to 18 Years | 128 (81.5%) | 26 (16.6%) |
| 19 to 25 Years | 20 (37.0%) | 30 (55.6%) |
| 25 to 34 Years | 22 (28.9%) | 40 (52.6%) |
| 35 to 44 Years | 25 (43.9%) | 29 (50.9%) |
| 45 to 54 Years | 32 (49.2%) | 24 (36.9%) |
| 55 to 64 Years | 59 (72.0%) | 19 (23.2%) |
| 65 to 74 Years | 20 (100.0%) | 16 (80.0%) |
| 75 Years and over | 65 (100.0%) | 64 (98.5%) |
| Total | 395 (62.8%) | 277 (44.0%) |
Disability Status by Sex by Age in Hardin
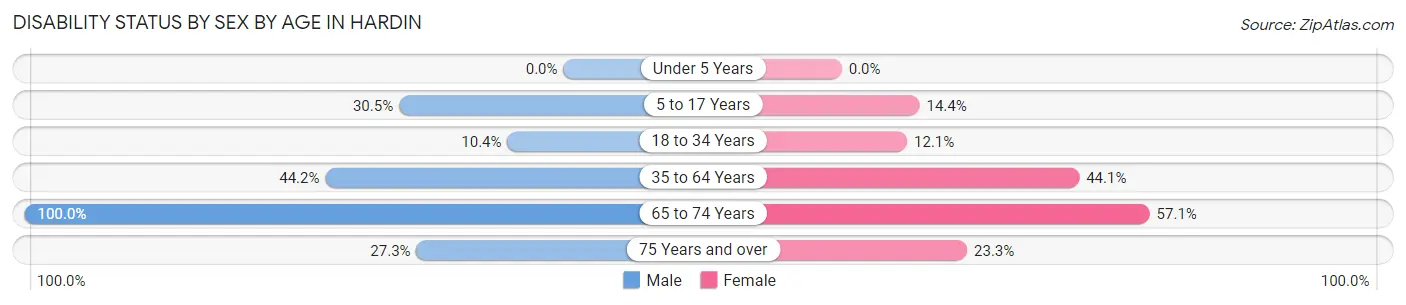
| Age Bracket | Male | Female |
| Under 5 Years | 0 (0.0%) | 0 (0.0%) |
| 5 to 17 Years | 18 (30.5%) | 14 (14.4%) |
| 18 to 34 Years | 8 (10.4%) | 8 (12.1%) |
| 35 to 64 Years | 38 (44.2%) | 52 (44.1%) |
| 65 to 74 Years | 6 (100.0%) | 8 (57.1%) |
| 75 Years and over | 6 (27.3%) | 10 (23.3%) |
Disability Class by Sex by Age in Hardin
Disability Class: Hearing Difficulty
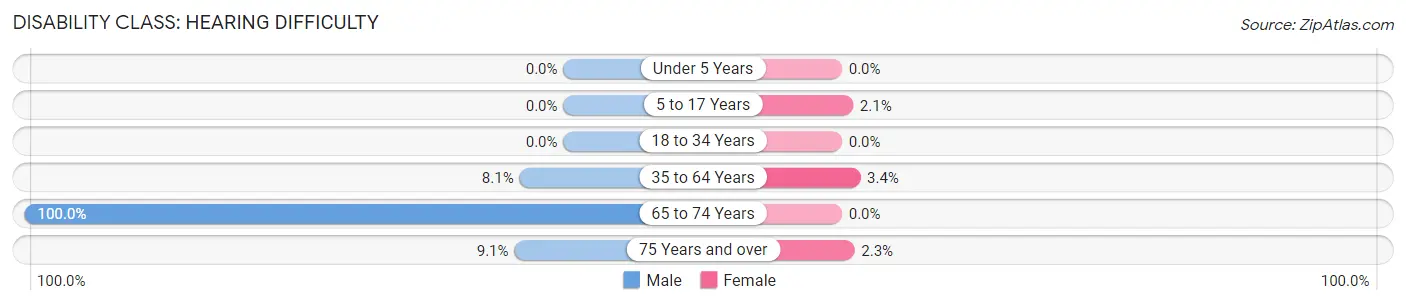
| Age Bracket | Male | Female |
| Under 5 Years | 0 (0.0%) | 0 (0.0%) |
| 5 to 17 Years | 0 (0.0%) | 2 (2.1%) |
| 18 to 34 Years | 0 (0.0%) | 0 (0.0%) |
| 35 to 64 Years | 7 (8.1%) | 4 (3.4%) |
| 65 to 74 Years | 6 (100.0%) | 0 (0.0%) |
| 75 Years and over | 2 (9.1%) | 1 (2.3%) |
Disability Class: Vision Difficulty
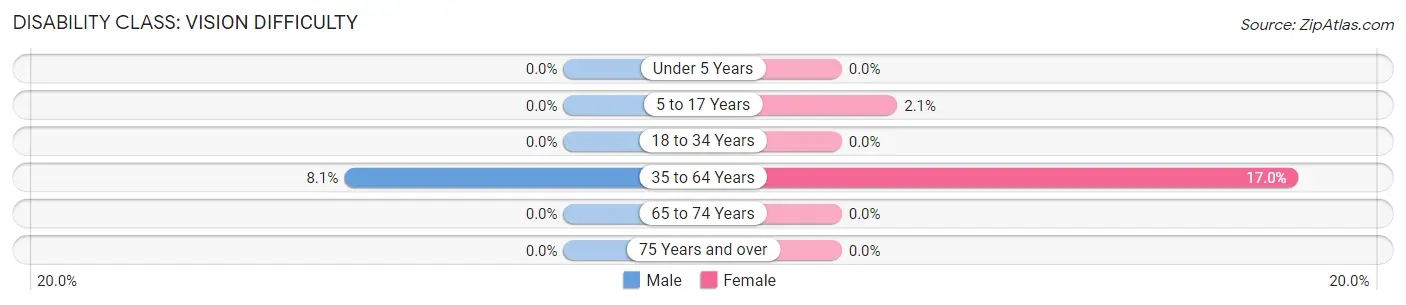
| Age Bracket | Male | Female |
| Under 5 Years | 0 (0.0%) | 0 (0.0%) |
| 5 to 17 Years | 0 (0.0%) | 2 (2.1%) |
| 18 to 34 Years | 0 (0.0%) | 0 (0.0%) |
| 35 to 64 Years | 7 (8.1%) | 20 (17.0%) |
| 65 to 74 Years | 0 (0.0%) | 0 (0.0%) |
| 75 Years and over | 0 (0.0%) | 0 (0.0%) |
Disability Class: Cognitive Difficulty
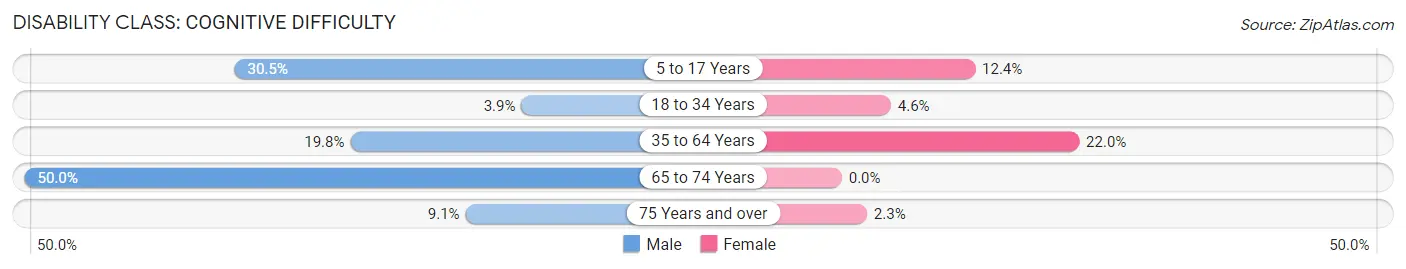
| Age Bracket | Male | Female |
| 5 to 17 Years | 18 (30.5%) | 12 (12.4%) |
| 18 to 34 Years | 3 (3.9%) | 3 (4.5%) |
| 35 to 64 Years | 17 (19.8%) | 26 (22.0%) |
| 65 to 74 Years | 3 (50.0%) | 0 (0.0%) |
| 75 Years and over | 2 (9.1%) | 1 (2.3%) |
Disability Class: Ambulatory Difficulty
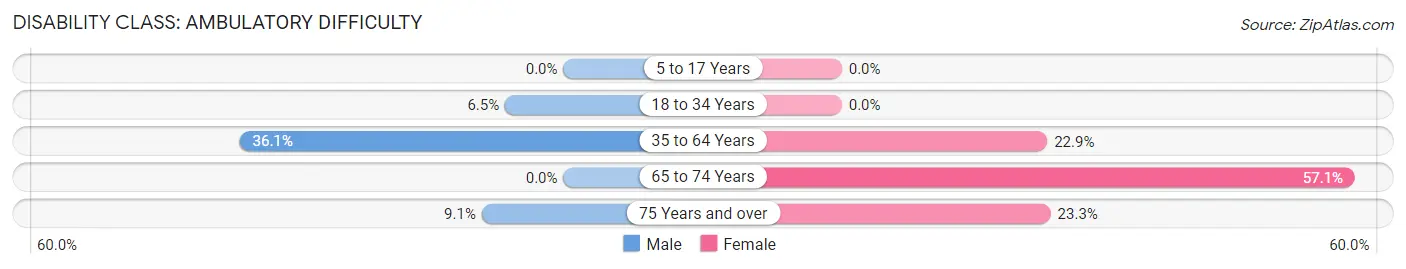
| Age Bracket | Male | Female |
| 5 to 17 Years | 0 (0.0%) | 0 (0.0%) |
| 18 to 34 Years | 5 (6.5%) | 0 (0.0%) |
| 35 to 64 Years | 31 (36.0%) | 27 (22.9%) |
| 65 to 74 Years | 0 (0.0%) | 8 (57.1%) |
| 75 Years and over | 2 (9.1%) | 10 (23.3%) |
Disability Class: Self-Care Difficulty
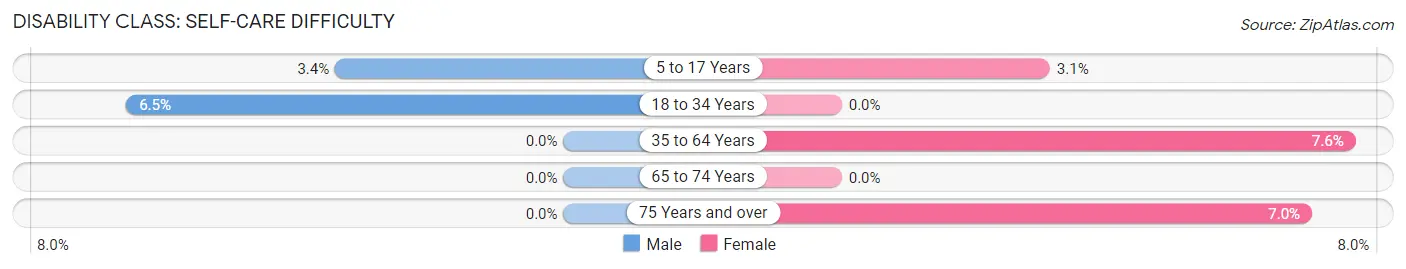
| Age Bracket | Male | Female |
| 5 to 17 Years | 2 (3.4%) | 3 (3.1%) |
| 18 to 34 Years | 5 (6.5%) | 0 (0.0%) |
| 35 to 64 Years | 0 (0.0%) | 9 (7.6%) |
| 65 to 74 Years | 0 (0.0%) | 0 (0.0%) |
| 75 Years and over | 0 (0.0%) | 3 (7.0%) |
Technology Access in Hardin
Computing Device Access in Hardin
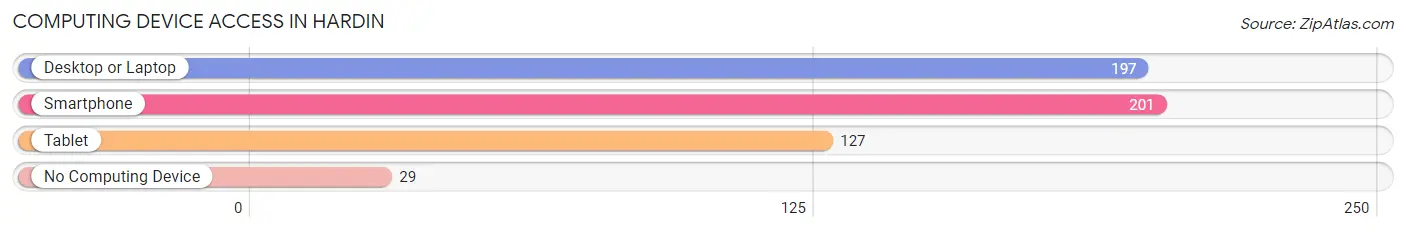
| Device Type | # Households | % Households |
| Desktop or Laptop | 197 | 75.5% |
| Smartphone | 201 | 77.0% |
| Tablet | 127 | 48.7% |
| No Computing Device | 29 | 11.1% |
| Total | 261 | 100.0% |
Internet Access in Hardin
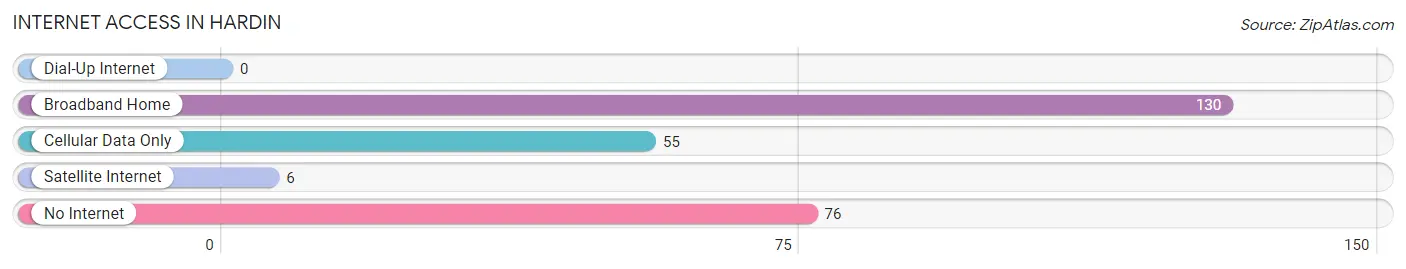
| Internet Type | # Households | % Households |
| Dial-Up Internet | 0 | 0.0% |
| Broadband Home | 130 | 49.8% |
| Cellular Data Only | 55 | 21.1% |
| Satellite Internet | 6 | 2.3% |
| No Internet | 76 | 29.1% |
| Total | 261 | 100.0% |
Hardin Summary
Hardin, Kentucky is a small town located in the western part of the state, in Hardin County. It is situated on the banks of the Ohio River, and is part of the Louisville metropolitan area. The town has a population of approximately 2,000 people, and is the county seat of Hardin County.
History
Hardin was founded in 1812 by William Hardin, a Revolutionary War veteran. He named the town after himself, and it was incorporated in 1817. The town was originally a trading post, and it quickly grew into a thriving community. In 1820, the first post office was established, and the first school was built in 1825.
The town was an important stop on the Underground Railroad, and many escaped slaves passed through Hardin on their way to freedom. During the Civil War, Hardin was a major supply center for the Union Army. After the war, the town continued to grow and prosper, and in 1883, the Louisville and Nashville Railroad was built through Hardin.
Geography
Hardin is located in western Kentucky, in Hardin County. It is situated on the banks of the Ohio River, and is part of the Louisville metropolitan area. The town has a total area of 1.3 square miles, all of which is land. The terrain is mostly flat, with some rolling hills. The climate is humid subtropical, with hot, humid summers and mild winters.
Economy
The economy of Hardin is largely based on agriculture and manufacturing. The town is home to several large farms, and the surrounding area is known for its production of tobacco, corn, and soybeans. There are also several manufacturing plants in the area, including a paper mill and a furniture factory.
The town also has a thriving tourism industry, with many visitors coming to enjoy the town’s historic sites and natural beauty. The town is home to several museums, including the Hardin County Historical Museum and the Hardin County Museum of Natural History.
Demographics
As of the 2010 census, Hardin had a population of 2,000 people. The racial makeup of the town was 95.5% White, 1.5% African American, 0.5% Native American, 0.5% Asian, and 2.0% from other races. The median household income was $35,000, and the median family income was $41,000.
Conclusion
Hardin, Kentucky is a small town with a rich history and a vibrant economy. It is situated on the banks of the Ohio River, and is part of the Louisville metropolitan area. The town has a population of approximately 2,000 people, and is the county seat of Hardin County. The economy of Hardin is largely based on agriculture and manufacturing, and the town is also a popular tourist destination. The town has a diverse population, with a median household income of $35,000 and a median family income of $41,000.
Common Questions
What is Per Capita Income in Hardin?
Per Capita income in Hardin is $14,801.
What is the Median Family Income in Hardin?
Median Family Income in Hardin is $33,125.
What is the Median Household income in Hardin?
Median Household Income in Hardin is $30,341.
What is Income or Wage Gap in Hardin?
Income or Wage Gap in Hardin is 21.2%.
Women in Hardin earn 78.8 cents for every dollar earned by a man.
What is Family Income Deficit in Hardin?
Family Income Deficit in Hardin is $11,457.
Families that are below poverty line in Hardin earn $11,457 less on average than the poverty threshold level.
What is Inequality or Gini Index in Hardin?
Inequality or Gini Index in Hardin is 0.46.
What is the Total Population of Hardin?
Total Population of Hardin is 629.
What is the Total Male Population of Hardin?
Total Male Population of Hardin is 266.
What is the Total Female Population of Hardin?
Total Female Population of Hardin is 363.
What is the Ratio of Males per 100 Females in Hardin?
There are 73.28 Males per 100 Females in Hardin.
What is the Ratio of Females per 100 Males in Hardin?
There are 136.47 Females per 100 Males in Hardin.
What is the Median Population Age in Hardin?
Median Population Age in Hardin is 31.2 Years.
What is the Average Family Size in Hardin
Average Family Size in Hardin is 2.9 People.
What is the Average Household Size in Hardin
Average Household Size in Hardin is 2.4 People.
How Large is the Labor Force in Hardin?
There are 195 People in the Labor Forcein in Hardin.
What is the Percentage of People in the Labor Force in Hardin?
42.6% of People are in the Labor Force in Hardin.
What is the Unemployment Rate in Hardin?
Unemployment Rate in Hardin is 8.7%.