Central City, KY Map & Demographics
Central City Map
Central City Overview
$33,042
PER CAPITA INCOME
$60,854
AVG FAMILY INCOME
$52,184
AVG HOUSEHOLD INCOME
28.1%
WAGE / INCOME GAP [ % ]
71.9¢/ $1
WAGE / INCOME GAP [ $ ]
0.58
INEQUALITY / GINI INDEX
5,740
TOTAL POPULATION
2,995
MALE POPULATION
2,745
FEMALE POPULATION
109.11
MALES / 100 FEMALES
91.65
FEMALES / 100 MALES
33.5
MEDIAN AGE
3.3
AVG FAMILY SIZE
2.9
AVG HOUSEHOLD SIZE
2,466
LABOR FORCE [ PEOPLE ]
55.5%
PERCENT IN LABOR FORCE
5.0%
UNEMPLOYMENT RATE
Central City Zip Codes
Central City Area Codes
Income in Central City
Income Overview in Central City
Per Capita Income in Central City is $33,042, while median incomes of families and households are $60,854 and $52,184 respectively.
| Characteristic | Number | Measure |
| Per Capita Income | 5,740 | $33,042 |
| Median Family Income | 1,414 | $60,854 |
| Mean Family Income | 1,414 | $110,589 |
| Median Household Income | 1,826 | $52,184 |
| Mean Household Income | 1,826 | $97,153 |
| Income Deficit | 1,414 | $0 |
| Wage / Income Gap (%) | 5,740 | 28.13% |
| Wage / Income Gap ($) | 5,740 | 71.87¢ per $1 |
| Gini / Inequality Index | 5,740 | 0.58 |
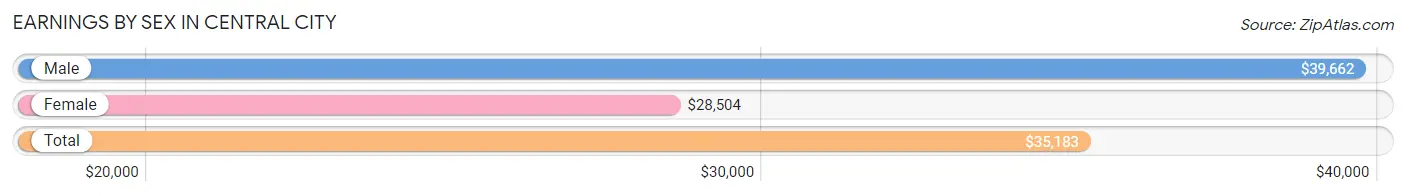
Earnings by Sex in Central City
Average Earnings in Central City are $35,183, $39,662 for men and $28,504 for women, a difference of 28.1%.
| Sex | Number | Average Earnings |
| Male | 1,501 (55.0%) | $39,662 |
| Female | 1,228 (45.0%) | $28,504 |
| Total | 2,729 (100.0%) | $35,183 |
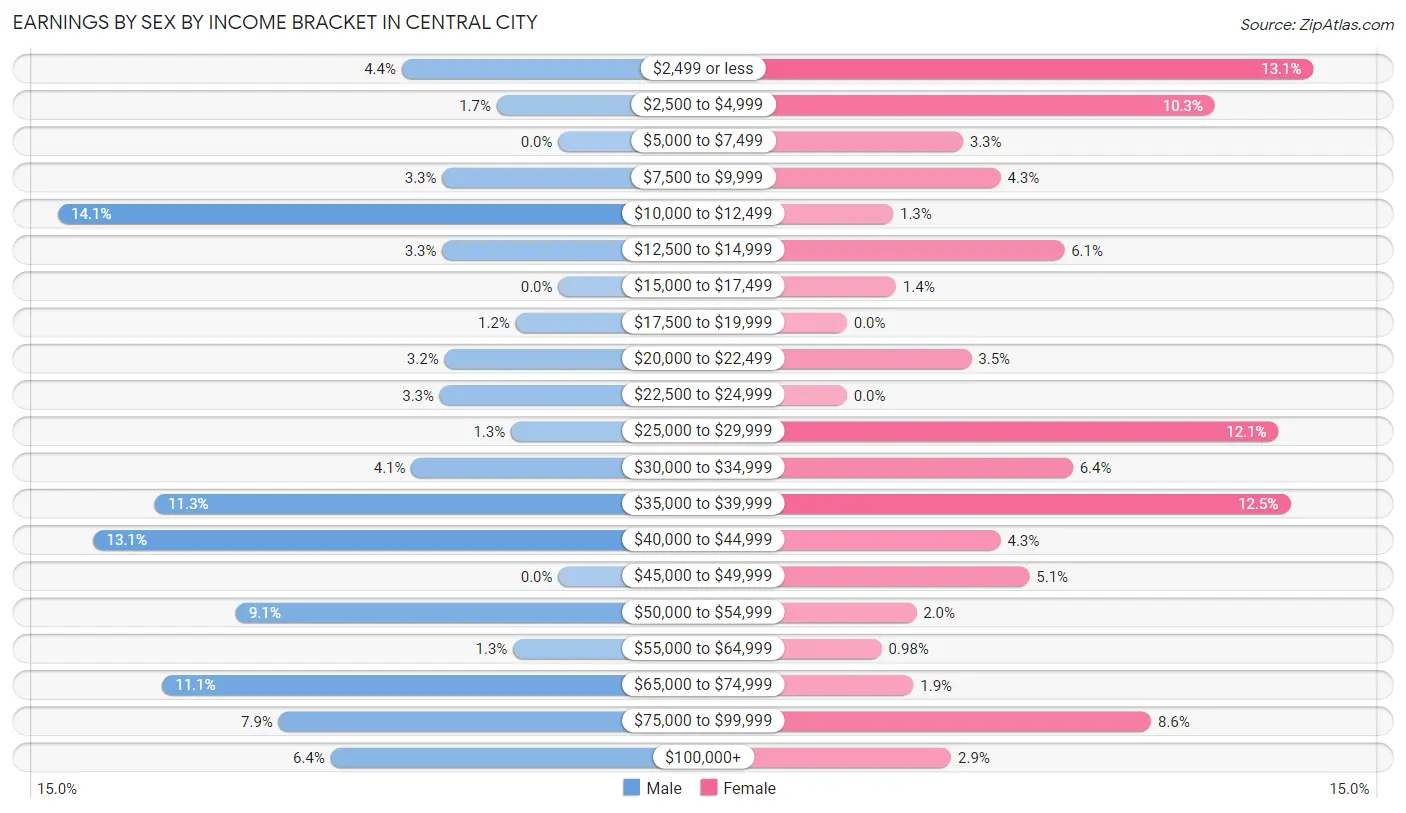
Earnings by Sex by Income Bracket in Central City
The most common earnings brackets in Central City are $10,000 to $12,499 for men (211 | 14.1%) and $2,499 or less for women (161 | 13.1%).
| Income | Male | Female |
| $2,499 or less | 66 (4.4%) | 161 (13.1%) |
| $2,500 to $4,999 | 26 (1.7%) | 127 (10.3%) |
| $5,000 to $7,499 | 0 (0.0%) | 40 (3.3%) |
| $7,500 to $9,999 | 49 (3.3%) | 53 (4.3%) |
| $10,000 to $12,499 | 211 (14.1%) | 16 (1.3%) |
| $12,500 to $14,999 | 49 (3.3%) | 75 (6.1%) |
| $15,000 to $17,499 | 0 (0.0%) | 17 (1.4%) |
| $17,500 to $19,999 | 18 (1.2%) | 0 (0.0%) |
| $20,000 to $22,499 | 48 (3.2%) | 43 (3.5%) |
| $22,500 to $24,999 | 50 (3.3%) | 0 (0.0%) |
| $25,000 to $29,999 | 20 (1.3%) | 149 (12.1%) |
| $30,000 to $34,999 | 62 (4.1%) | 78 (6.4%) |
| $35,000 to $39,999 | 170 (11.3%) | 153 (12.5%) |
| $40,000 to $44,999 | 196 (13.1%) | 53 (4.3%) |
| $45,000 to $49,999 | 0 (0.0%) | 63 (5.1%) |
| $50,000 to $54,999 | 136 (9.1%) | 24 (1.9%) |
| $55,000 to $64,999 | 19 (1.3%) | 12 (1.0%) |
| $65,000 to $74,999 | 167 (11.1%) | 23 (1.9%) |
| $75,000 to $99,999 | 118 (7.9%) | 105 (8.6%) |
| $100,000+ | 96 (6.4%) | 36 (2.9%) |
| Total | 1,501 (100.0%) | 1,228 (100.0%) |
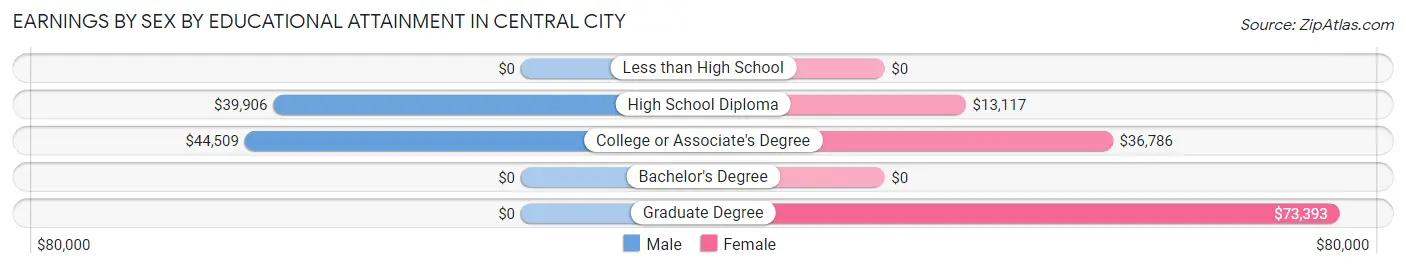
Earnings by Sex by Educational Attainment in Central City
Average earnings in Central City are $43,291 for men and $30,742 for women, a difference of 29.0%. Men with an educational attainment of college or associate's degree enjoy the highest average annual earnings of $44,509, while those with high school diploma education earn the least with $39,906. Women with an educational attainment of graduate degree earn the most with the average annual earnings of $73,393, while those with high school diploma education have the smallest earnings of $13,117.
| Educational Attainment | Male Income | Female Income |
| Less than High School | - | - |
| High School Diploma | $39,906 | $13,117 |
| College or Associate's Degree | $44,509 | $36,786 |
| Bachelor's Degree | - | - |
| Graduate Degree | - | - |
| Total | $43,291 | $30,742 |
Family Income in Central City
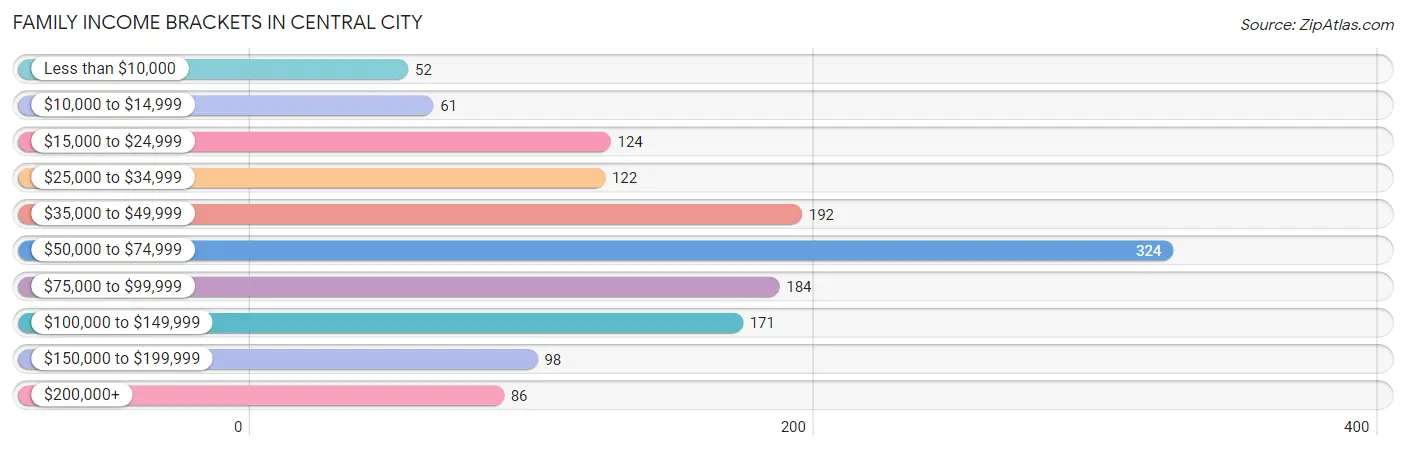
Family Income Brackets in Central City
According to the Central City family income data, there are 324 families falling into the $50,000 to $74,999 income range, which is the most common income bracket and makes up 22.9% of all families. Conversely, the less than $10,000 income bracket is the least frequent group with only 52 families (3.7%) belonging to this category.
| Income Bracket | # Families | % Families |
| Less than $10,000 | 52 | 3.7% |
| $10,000 to $14,999 | 61 | 4.3% |
| $15,000 to $24,999 | 124 | 8.8% |
| $25,000 to $34,999 | 122 | 8.6% |
| $35,000 to $49,999 | 192 | 13.6% |
| $50,000 to $74,999 | 324 | 22.9% |
| $75,000 to $99,999 | 184 | 13.0% |
| $100,000 to $149,999 | 171 | 12.1% |
| $150,000 to $199,999 | 98 | 6.9% |
| $200,000+ | 86 | 6.1% |
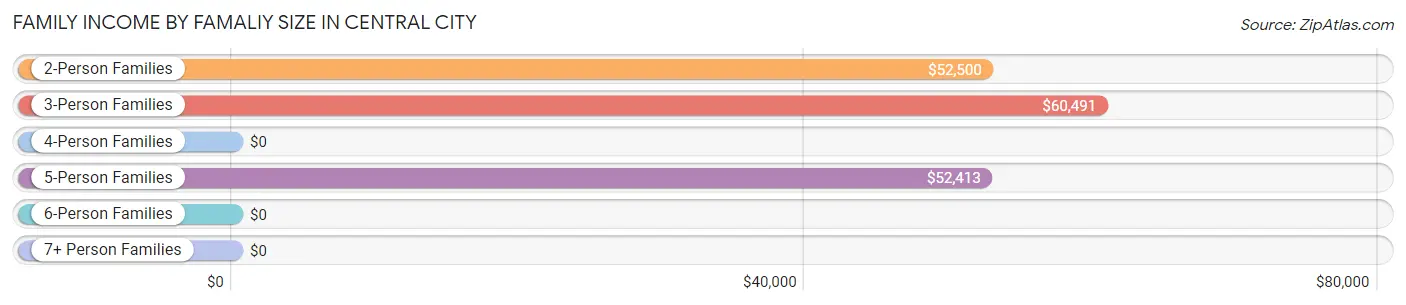
Family Income by Famaliy Size in Central City
3-person families (495 | 35.0%) account for the highest median family income in Central City with $60,491 per family, while 2-person families (530 | 37.5%) have the highest median income of $26,250 per family member.
| Income Bracket | # Families | Median Income |
| 2-Person Families | 530 (37.5%) | $52,500 |
| 3-Person Families | 495 (35.0%) | $60,491 |
| 4-Person Families | 204 (14.4%) | $0 |
| 5-Person Families | 185 (13.1%) | $52,413 |
| 6-Person Families | 0 (0.0%) | $0 |
| 7+ Person Families | 0 (0.0%) | $0 |
| Total | 1,414 (100.0%) | $60,854 |
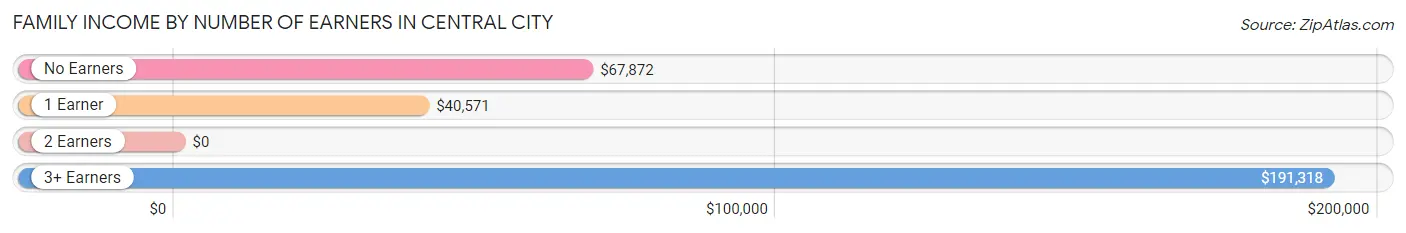
Family Income by Number of Earners in Central City
| Number of Earners | # Families | Median Income |
| No Earners | 216 (15.3%) | $67,872 |
| 1 Earner | 528 (37.3%) | $40,571 |
| 2 Earners | 523 (37.0%) | $0 |
| 3+ Earners | 147 (10.4%) | $191,318 |
| Total | 1,414 (100.0%) | $60,854 |
Household Income in Central City
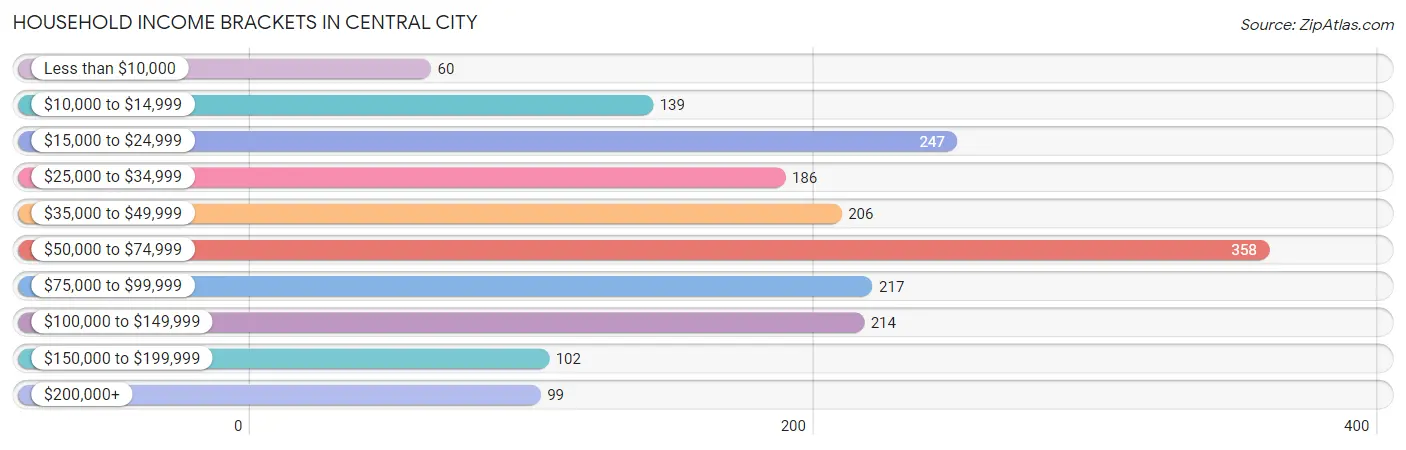
Household Income Brackets in Central City
With 358 households falling in the category, the $50,000 to $74,999 income range is the most frequent in Central City, accounting for 19.6% of all households. In contrast, only 60 households (3.3%) fall into the less than $10,000 income bracket, making it the least populous group.
| Income Bracket | # Households | % Households |
| Less than $10,000 | 60 | 3.3% |
| $10,000 to $14,999 | 139 | 7.6% |
| $15,000 to $24,999 | 247 | 13.5% |
| $25,000 to $34,999 | 186 | 10.2% |
| $35,000 to $49,999 | 206 | 11.3% |
| $50,000 to $74,999 | 358 | 19.6% |
| $75,000 to $99,999 | 217 | 11.9% |
| $100,000 to $149,999 | 214 | 11.7% |
| $150,000 to $199,999 | 102 | 5.6% |
| $200,000+ | 99 | 5.4% |
Household Income by Householder Age in Central City
The median household income in Central City is $52,184, with the highest median household income of $78,201 found in the 45 to 64 years age bracket for the primary householder. A total of 685 households (37.5%) fall into this category. Meanwhile, the 25 to 44 years age bracket for the primary householder has the lowest median household income of $40,223, with 527 households (28.9%) in this group.
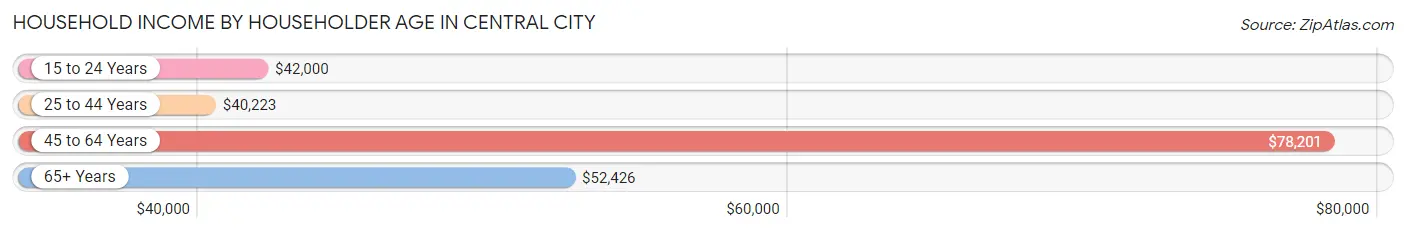
| Income Bracket | # Households | Median Income |
| 15 to 24 Years | 164 (9.0%) | $42,000 |
| 25 to 44 Years | 527 (28.9%) | $40,223 |
| 45 to 64 Years | 685 (37.5%) | $78,201 |
| 65+ Years | 450 (24.6%) | $52,426 |
| Total | 1,826 (100.0%) | $52,184 |
Poverty in Central City
Income Below Poverty by Sex and Age in Central City
With 9.4% poverty level for males and 21.3% for females among the residents of Central City, 16 and 17 year old males and 12 to 14 year old females are the most vulnerable to poverty, with 56 males (54.4%) and 55 females (45.5%) in their respective age groups living below the poverty level.
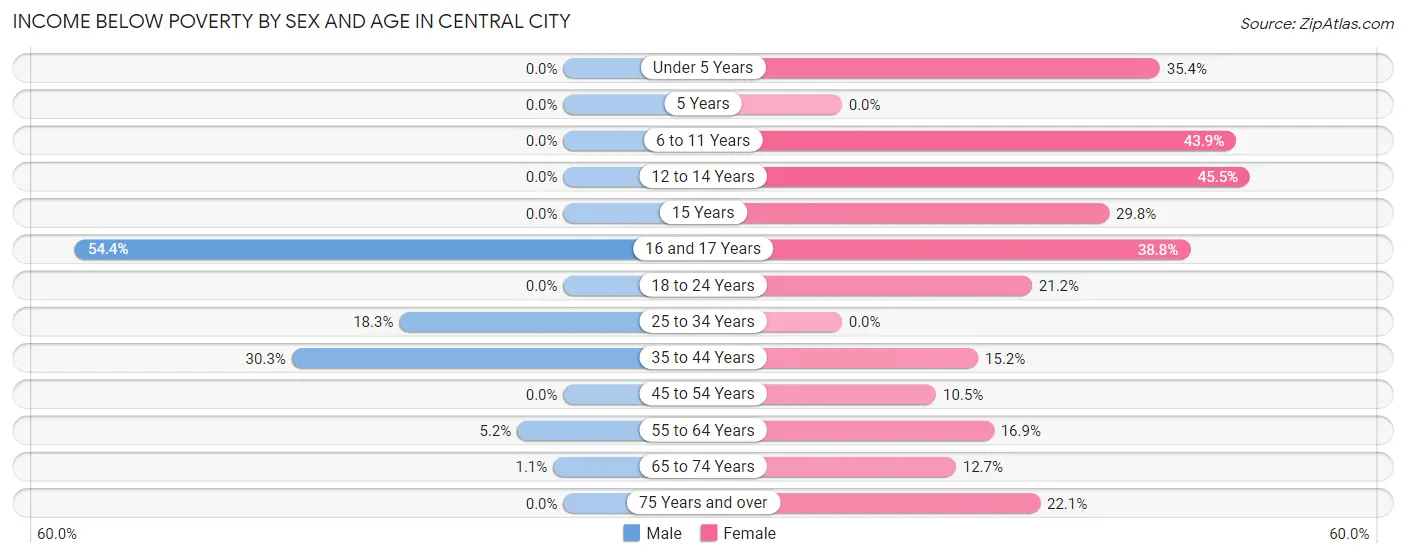
| Age Bracket | Male | Female |
| Under 5 Years | 0 (0.0%) | 113 (35.4%) |
| 5 Years | 0 (0.0%) | 0 (0.0%) |
| 6 to 11 Years | 0 (0.0%) | 108 (43.9%) |
| 12 to 14 Years | 0 (0.0%) | 55 (45.5%) |
| 15 Years | 0 (0.0%) | 39 (29.8%) |
| 16 and 17 Years | 56 (54.4%) | 19 (38.8%) |
| 18 to 24 Years | 0 (0.0%) | 47 (21.2%) |
| 25 to 34 Years | 49 (18.3%) | 0 (0.0%) |
| 35 to 44 Years | 118 (30.3%) | 68 (15.2%) |
| 45 to 54 Years | 0 (0.0%) | 27 (10.5%) |
| 55 to 64 Years | 13 (5.2%) | 45 (16.9%) |
| 65 to 74 Years | 2 (1.1%) | 31 (12.7%) |
| 75 Years and over | 0 (0.0%) | 34 (22.1%) |
| Total | 238 (9.4%) | 586 (21.3%) |
Income Above Poverty by Sex and Age in Central City
According to the poverty statistics in Central City, males aged under 5 years and females aged 25 to 34 years are the age groups that are most secure financially, with 100.0% of males and 100.0% of females in these age groups living above the poverty line.
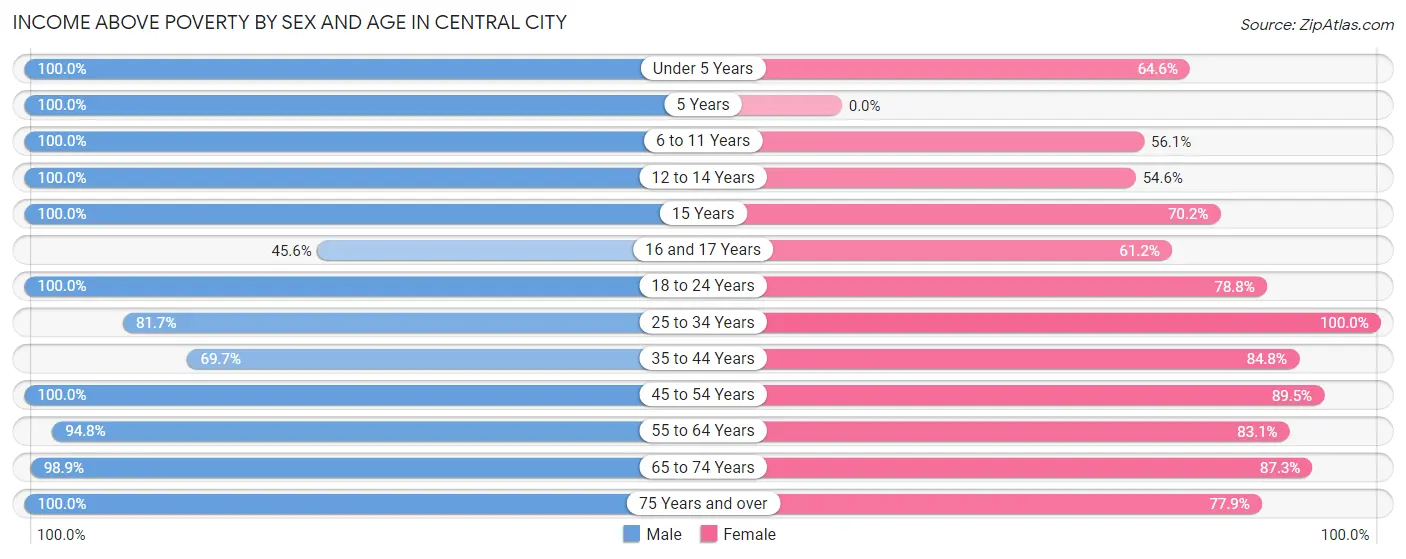
| Age Bracket | Male | Female |
| Under 5 Years | 220 (100.0%) | 206 (64.6%) |
| 5 Years | 47 (100.0%) | 0 (0.0%) |
| 6 to 11 Years | 127 (100.0%) | 138 (56.1%) |
| 12 to 14 Years | 41 (100.0%) | 66 (54.5%) |
| 15 Years | 45 (100.0%) | 92 (70.2%) |
| 16 and 17 Years | 47 (45.6%) | 30 (61.2%) |
| 18 to 24 Years | 414 (100.0%) | 175 (78.8%) |
| 25 to 34 Years | 219 (81.7%) | 288 (100.0%) |
| 35 to 44 Years | 272 (69.7%) | 380 (84.8%) |
| 45 to 54 Years | 336 (100.0%) | 230 (89.5%) |
| 55 to 64 Years | 239 (94.8%) | 221 (83.1%) |
| 65 to 74 Years | 174 (98.9%) | 213 (87.3%) |
| 75 Years and over | 107 (100.0%) | 120 (77.9%) |
| Total | 2,288 (90.6%) | 2,159 (78.6%) |
Income Below Poverty Among Married-Couple Families in Central City
The poverty statistics for married-couple families in Central City show that 5.2% or 54 of the total 1,032 families live below the poverty line. Families with 1 or 2 children have the highest poverty rate of 14.0%, comprising of 54 families. On the other hand, families with no children have the lowest poverty rate of 0.0%, which includes 0 families.
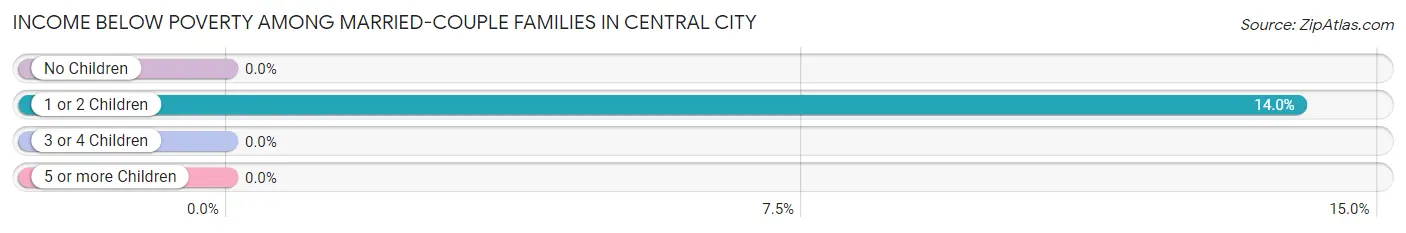
| Children | Above Poverty | Below Poverty |
| No Children | 602 (100.0%) | 0 (0.0%) |
| 1 or 2 Children | 333 (86.1%) | 54 (14.0%) |
| 3 or 4 Children | 43 (100.0%) | 0 (0.0%) |
| 5 or more Children | 0 (0.0%) | 0 (0.0%) |
| Total | 978 (94.8%) | 54 (5.2%) |
Income Below Poverty Among Single-Parent Households in Central City
According to the poverty data in Central City, 29.9% or 61 single-father households and 44.4% or 79 single-mother households are living below the poverty line. Among single-father households, those with 1 or 2 children have the highest poverty rate, with 61 households (59.2%) experiencing poverty. Likewise, among single-mother households, those with 3 or 4 children have the highest poverty rate, with 27 households (100.0%) falling below the poverty line.
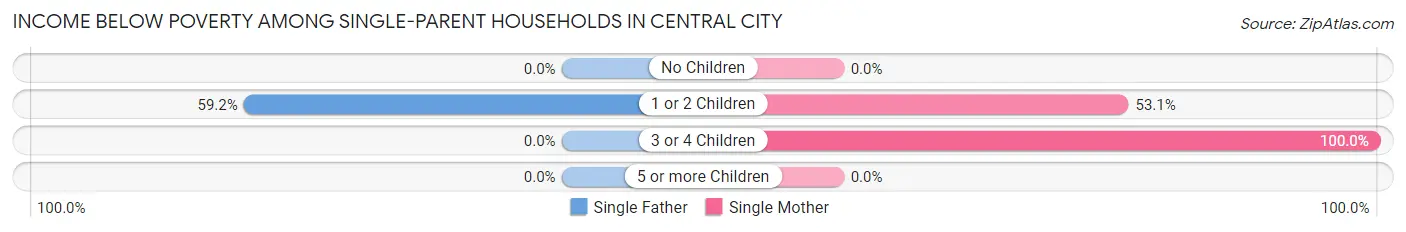
| Children | Single Father | Single Mother |
| No Children | 0 (0.0%) | 0 (0.0%) |
| 1 or 2 Children | 61 (59.2%) | 52 (53.1%) |
| 3 or 4 Children | 0 (0.0%) | 27 (100.0%) |
| 5 or more Children | 0 (0.0%) | 0 (0.0%) |
| Total | 61 (29.9%) | 79 (44.4%) |
Income Below Poverty Among Married-Couple vs Single-Parent Households in Central City
The poverty data for Central City shows that 54 of the married-couple family households (5.2%) and 140 of the single-parent households (36.6%) are living below the poverty level. Within the married-couple family households, those with 1 or 2 children have the highest poverty rate, with 54 households (14.0%) falling below the poverty line. Among the single-parent households, those with 1 or 2 children have the highest poverty rate, with 113 household (56.2%) living below poverty.
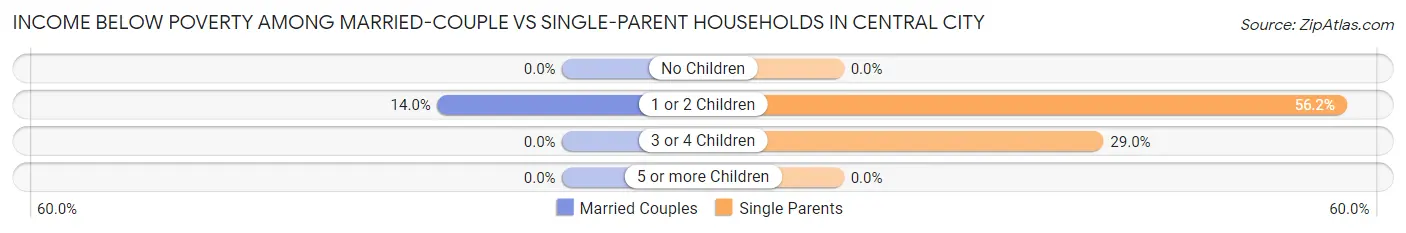
| Children | Married-Couple Families | Single-Parent Households |
| No Children | 0 (0.0%) | 0 (0.0%) |
| 1 or 2 Children | 54 (14.0%) | 113 (56.2%) |
| 3 or 4 Children | 0 (0.0%) | 27 (29.0%) |
| 5 or more Children | 0 (0.0%) | 0 (0.0%) |
| Total | 54 (5.2%) | 140 (36.6%) |
Race in Central City
The most populous races in Central City are White / Caucasian (5,118 | 89.2%), Two or more Races (335 | 5.8%), and Black / African American (171 | 3.0%).
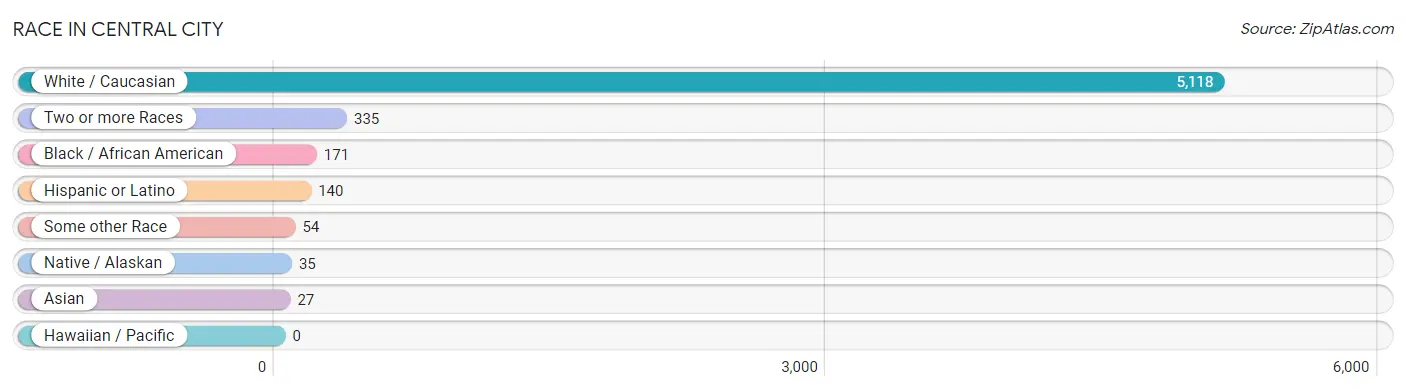
| Race | # Population | % Population |
| Asian | 27 | 0.5% |
| Black / African American | 171 | 3.0% |
| Hawaiian / Pacific | 0 | 0.0% |
| Hispanic or Latino | 140 | 2.4% |
| Native / Alaskan | 35 | 0.6% |
| White / Caucasian | 5,118 | 89.2% |
| Two or more Races | 335 | 5.8% |
| Some other Race | 54 | 0.9% |
| Total | 5,740 | 100.0% |
Ancestry in Central City
The most populous ancestries reported in Central City are American (817 | 14.2%), English (752 | 13.1%), Irish (692 | 12.1%), German (418 | 7.3%), and Scottish (143 | 2.5%), together accounting for 49.2% of all Central City residents.
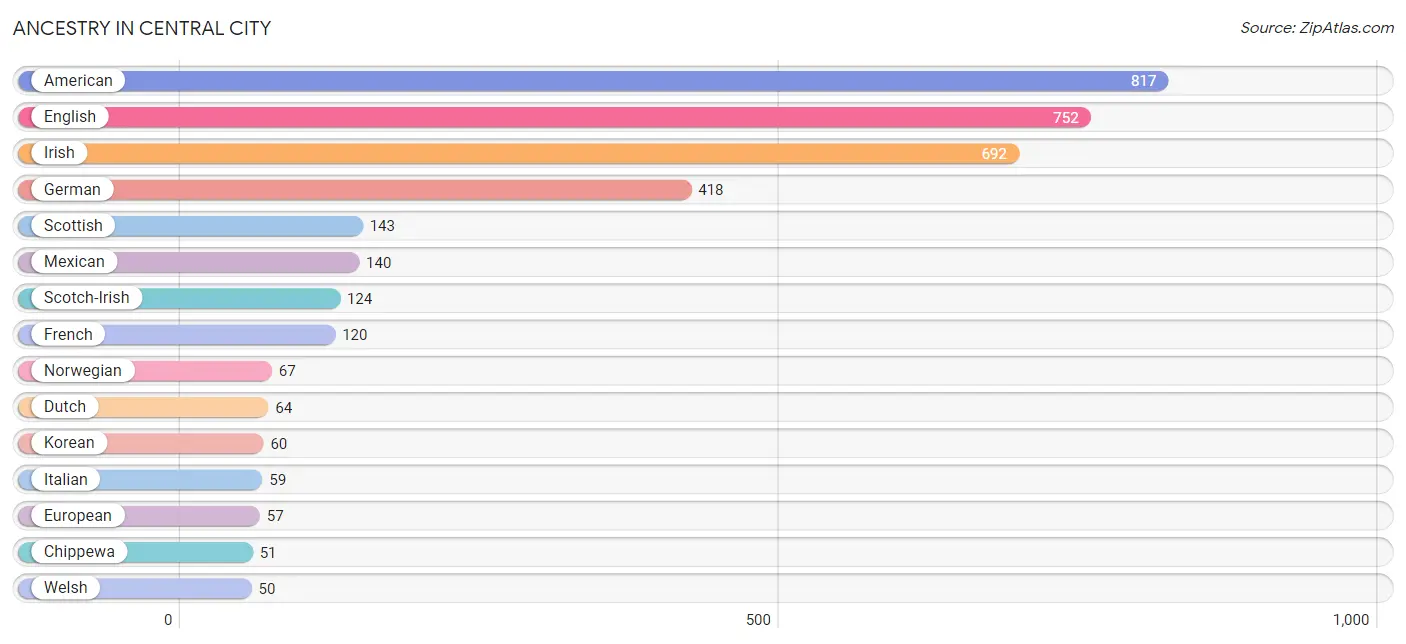
| Ancestry | # Population | % Population |
| American | 817 | 14.2% |
| Arab | 24 | 0.4% |
| Cajun | 2 | 0.0% |
| Cherokee | 35 | 0.6% |
| Chippewa | 51 | 0.9% |
| Dutch | 64 | 1.1% |
| English | 752 | 13.1% |
| European | 57 | 1.0% |
| French | 120 | 2.1% |
| German | 418 | 7.3% |
| Greek | 45 | 0.8% |
| Irish | 692 | 12.1% |
| Italian | 59 | 1.0% |
| Korean | 60 | 1.1% |
| Mexican | 140 | 2.4% |
| Norwegian | 67 | 1.2% |
| Polish | 37 | 0.6% |
| Scandinavian | 24 | 0.4% |
| Scotch-Irish | 124 | 2.2% |
| Scottish | 143 | 2.5% |
| Swedish | 34 | 0.6% |
| Welsh | 50 | 0.9% | View All 22 Rows |
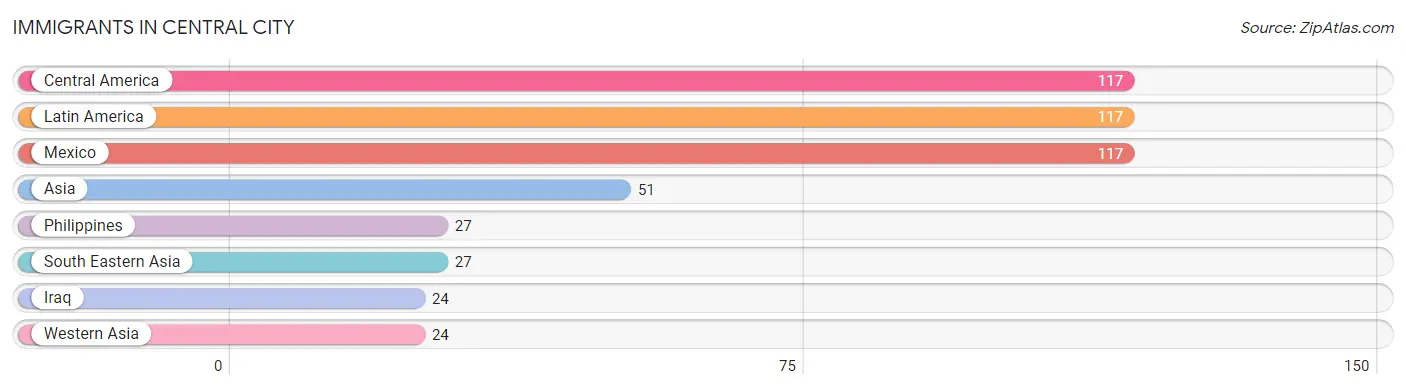
Immigrants in Central City
The most numerous immigrant groups reported in Central City came from Central America (117 | 2.0%), Latin America (117 | 2.0%), Mexico (117 | 2.0%), Asia (51 | 0.9%), and Philippines (27 | 0.5%), together accounting for 7.5% of all Central City residents.
| Immigration Origin | # Population | % Population |
| Asia | 51 | 0.9% |
| Central America | 117 | 2.0% |
| Iraq | 24 | 0.4% |
| Latin America | 117 | 2.0% |
| Mexico | 117 | 2.0% |
| Philippines | 27 | 0.5% |
| South Eastern Asia | 27 | 0.5% |
| Western Asia | 24 | 0.4% | View All 8 Rows |
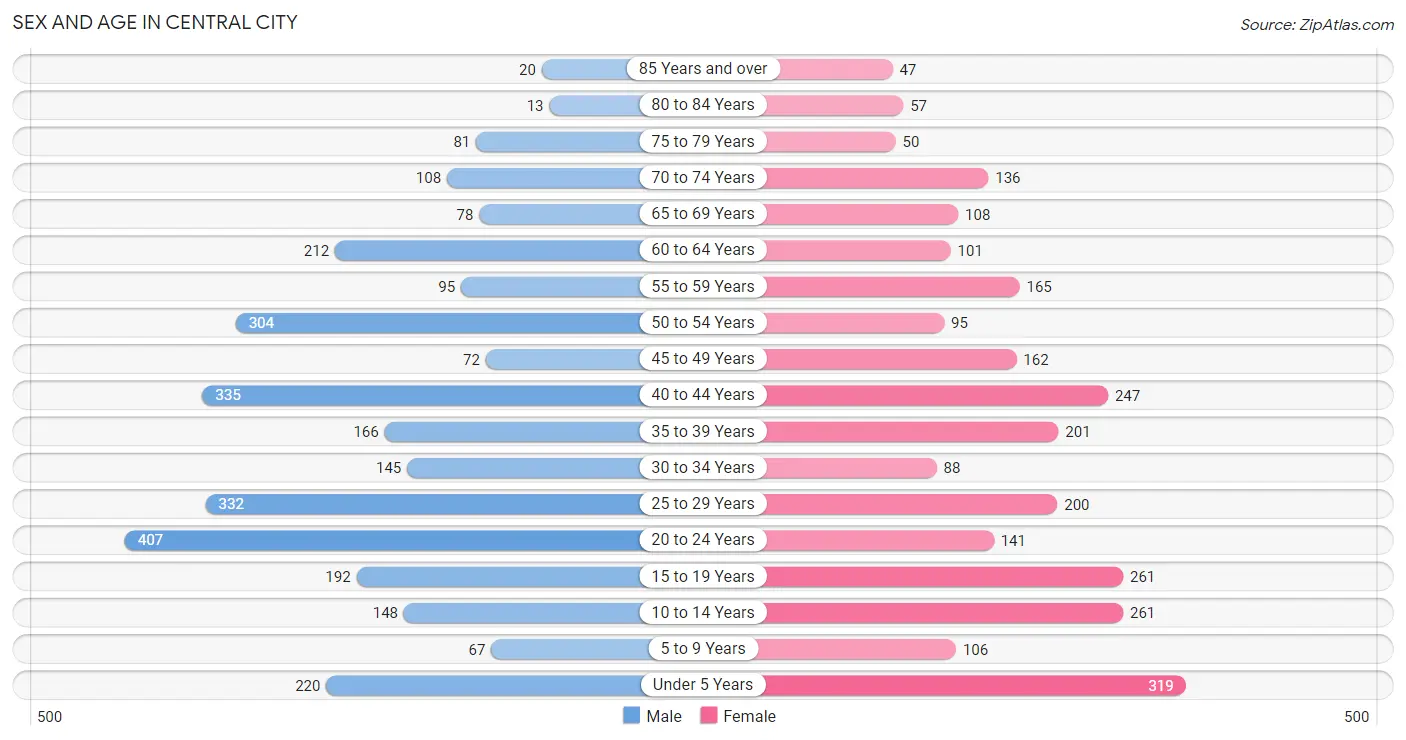
Sex and Age in Central City
Sex and Age in Central City
The most populous age groups in Central City are 20 to 24 Years (407 | 13.6%) for men and Under 5 Years (319 | 11.6%) for women.
| Age Bracket | Male | Female |
| Under 5 Years | 220 (7.3%) | 319 (11.6%) |
| 5 to 9 Years | 67 (2.2%) | 106 (3.9%) |
| 10 to 14 Years | 148 (4.9%) | 261 (9.5%) |
| 15 to 19 Years | 192 (6.4%) | 261 (9.5%) |
| 20 to 24 Years | 407 (13.6%) | 141 (5.1%) |
| 25 to 29 Years | 332 (11.1%) | 200 (7.3%) |
| 30 to 34 Years | 145 (4.8%) | 88 (3.2%) |
| 35 to 39 Years | 166 (5.5%) | 201 (7.3%) |
| 40 to 44 Years | 335 (11.2%) | 247 (9.0%) |
| 45 to 49 Years | 72 (2.4%) | 162 (5.9%) |
| 50 to 54 Years | 304 (10.2%) | 95 (3.5%) |
| 55 to 59 Years | 95 (3.2%) | 165 (6.0%) |
| 60 to 64 Years | 212 (7.1%) | 101 (3.7%) |
| 65 to 69 Years | 78 (2.6%) | 108 (3.9%) |
| 70 to 74 Years | 108 (3.6%) | 136 (5.0%) |
| 75 to 79 Years | 81 (2.7%) | 50 (1.8%) |
| 80 to 84 Years | 13 (0.4%) | 57 (2.1%) |
| 85 Years and over | 20 (0.7%) | 47 (1.7%) |
| Total | 2,995 (100.0%) | 2,745 (100.0%) |
Families and Households in Central City
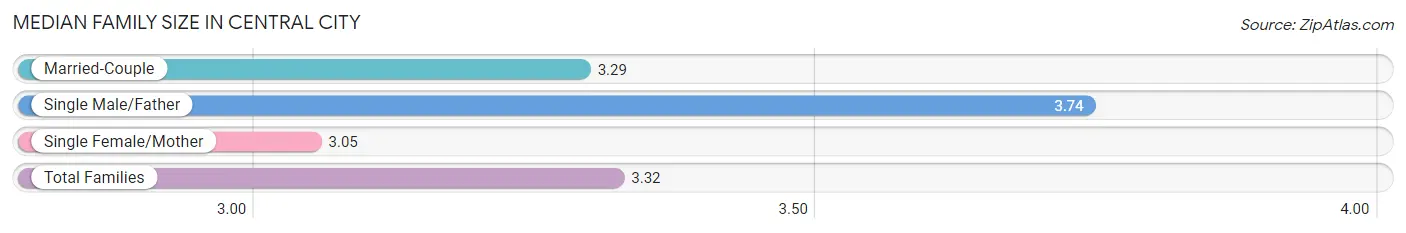
Median Family Size in Central City
The median family size in Central City is 3.32 persons per family, with single male/father families (204 | 14.4%) accounting for the largest median family size of 3.74 persons per family. On the other hand, single female/mother families (178 | 12.6%) represent the smallest median family size with 3.05 persons per family.
| Family Type | # Families | Family Size |
| Married-Couple | 1,032 (73.0%) | 3.29 |
| Single Male/Father | 204 (14.4%) | 3.74 |
| Single Female/Mother | 178 (12.6%) | 3.05 |
| Total Families | 1,414 (100.0%) | 3.32 |
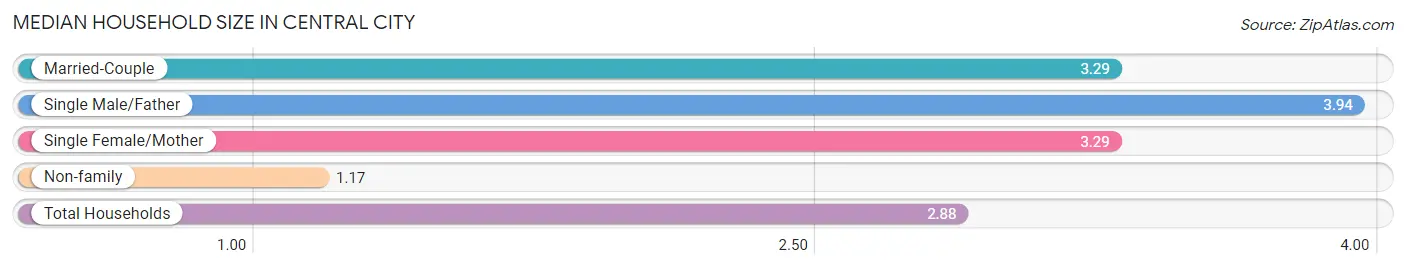
Median Household Size in Central City
The median household size in Central City is 2.88 persons per household, with single male/father households (204 | 11.2%) accounting for the largest median household size of 3.94 persons per household. non-family households (412 | 22.6%) represent the smallest median household size with 1.17 persons per household.
| Household Type | # Households | Household Size |
| Married-Couple | 1,032 (56.5%) | 3.29 |
| Single Male/Father | 204 (11.2%) | 3.94 |
| Single Female/Mother | 178 (9.8%) | 3.29 |
| Non-family | 412 (22.6%) | 1.17 |
| Total Households | 1,826 (100.0%) | 2.88 |
Household Size by Marriage Status in Central City
Out of a total of 1,826 households in Central City, 1,414 (77.4%) are family households, while 412 (22.6%) are nonfamily households. The most numerous type of family households are 2-person households, comprising 518, and the most common type of nonfamily households are 1-person households, comprising 336.
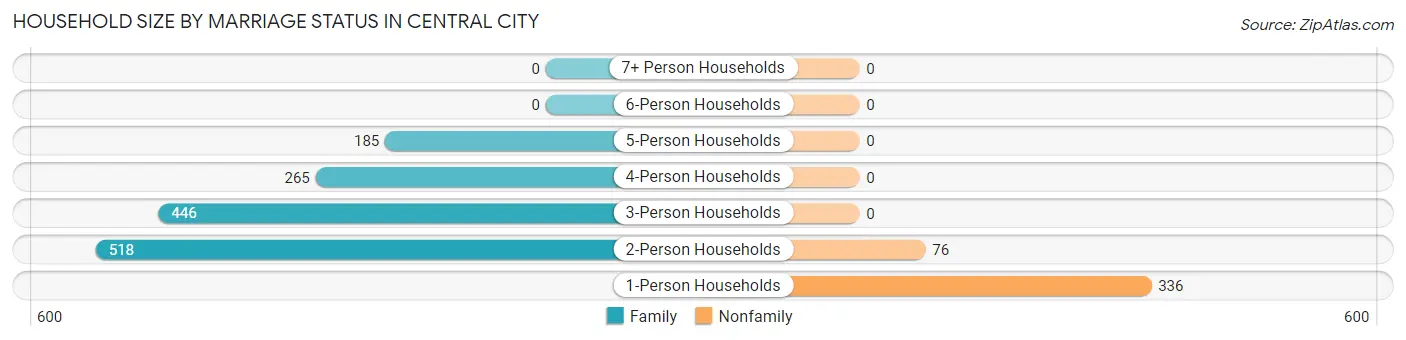
| Household Size | Family Households | Nonfamily Households |
| 1-Person Households | - | 336 (18.4%) |
| 2-Person Households | 518 (28.4%) | 76 (4.2%) |
| 3-Person Households | 446 (24.4%) | 0 (0.0%) |
| 4-Person Households | 265 (14.5%) | 0 (0.0%) |
| 5-Person Households | 185 (10.1%) | 0 (0.0%) |
| 6-Person Households | 0 (0.0%) | 0 (0.0%) |
| 7+ Person Households | 0 (0.0%) | 0 (0.0%) |
| Total | 1,414 (77.4%) | 412 (22.6%) |
Female Fertility in Central City
Fertility by Age in Central City
Average fertility rate in Central City is 144.0 births per 1,000 women. Women in the age bracket of 20 to 34 years have the highest fertility rate with 417.0 births per 1,000 women. Women in the age bracket of 20 to 34 years acount for 92.7% of all women with births.
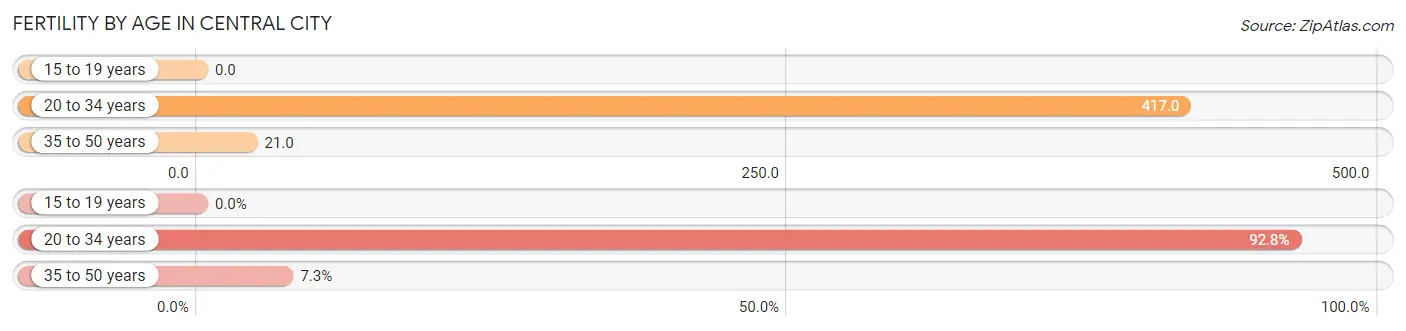
| Age Bracket | Women with Births | Births / 1,000 Women |
| 15 to 19 years | 0 (0.0%) | 0.0 |
| 20 to 34 years | 179 (92.7%) | 417.0 |
| 35 to 50 years | 14 (7.2%) | 21.0 |
| Total | 193 (100.0%) | 144.0 |
Fertility by Age by Marriage Status in Central City
67.9% of women with births (193) in Central City are married. The highest percentage of unmarried women with births falls into 35 to 50 years age bracket with 100.0% of them unmarried at the time of birth, while the lowest percentage of unmarried women with births belong to 20 to 34 years age bracket with 26.8% of them unmarried.
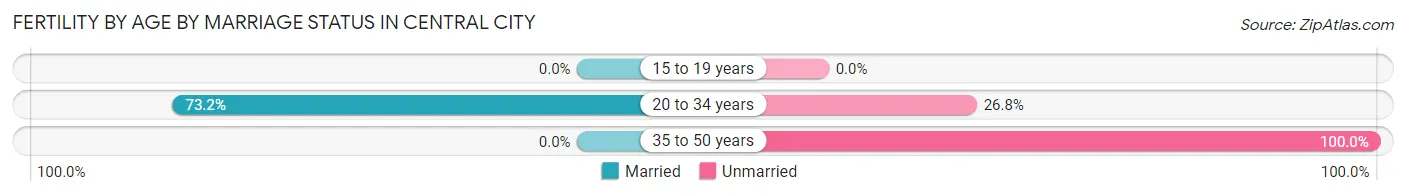
| Age Bracket | Married | Unmarried |
| 15 to 19 years | 0 (0.0%) | 0 (0.0%) |
| 20 to 34 years | 131 (73.2%) | 48 (26.8%) |
| 35 to 50 years | 0 (0.0%) | 14 (100.0%) |
| Total | 131 (67.9%) | 62 (32.1%) |
Fertility by Education in Central City
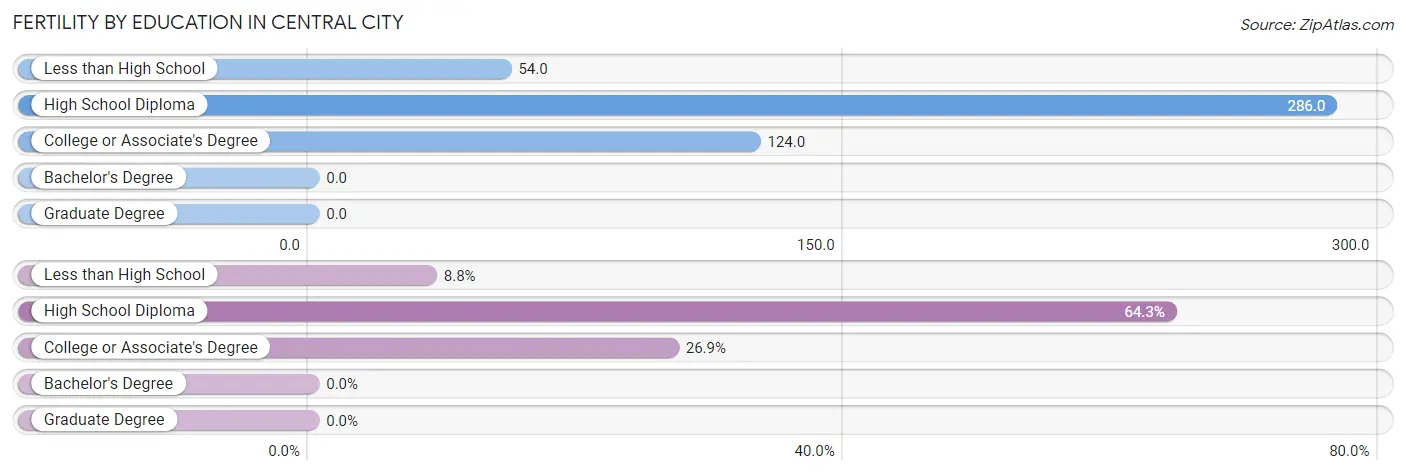
| Educational Attainment | Women with Births | Births / 1,000 Women |
| Less than High School | 17 (8.8%) | 54.0 |
| High School Diploma | 124 (64.2%) | 286.0 |
| College or Associate's Degree | 52 (26.9%) | 124.0 |
| Bachelor's Degree | 0 (0.0%) | 0.0 |
| Graduate Degree | 0 (0.0%) | 0.0 |
| Total | 193 (100.0%) | 144.0 |
Fertility by Education by Marriage Status in Central City
32.1% of women with births in Central City are unmarried. Women with the educational attainment of high school diploma are most likely to be married with 79.0% of them married at childbirth, while women with the educational attainment of less than high school are least likely to be married with 100.0% of them unmarried at childbirth.
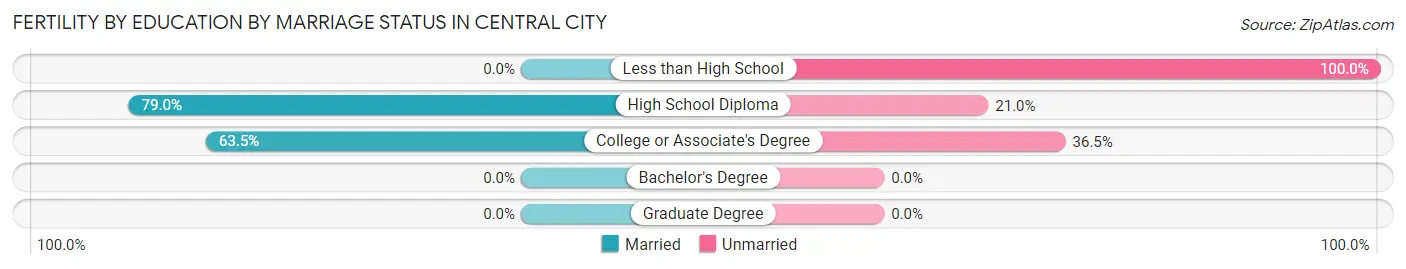
| Educational Attainment | Married | Unmarried |
| Less than High School | 0 (0.0%) | 17 (100.0%) |
| High School Diploma | 98 (79.0%) | 26 (21.0%) |
| College or Associate's Degree | 33 (63.5%) | 19 (36.5%) |
| Bachelor's Degree | 0 (0.0%) | 0 (0.0%) |
| Graduate Degree | 0 (0.0%) | 0 (0.0%) |
| Total | 131 (67.9%) | 62 (32.1%) |
Employment Characteristics in Central City
Employment by Class of Employer in Central City
Among the 2,291 employed individuals in Central City, private company employees (1,594 | 69.6%), local government employees (207 | 9.0%), and self-employed (incorporated) (181 | 7.9%) make up the most common classes of employment.
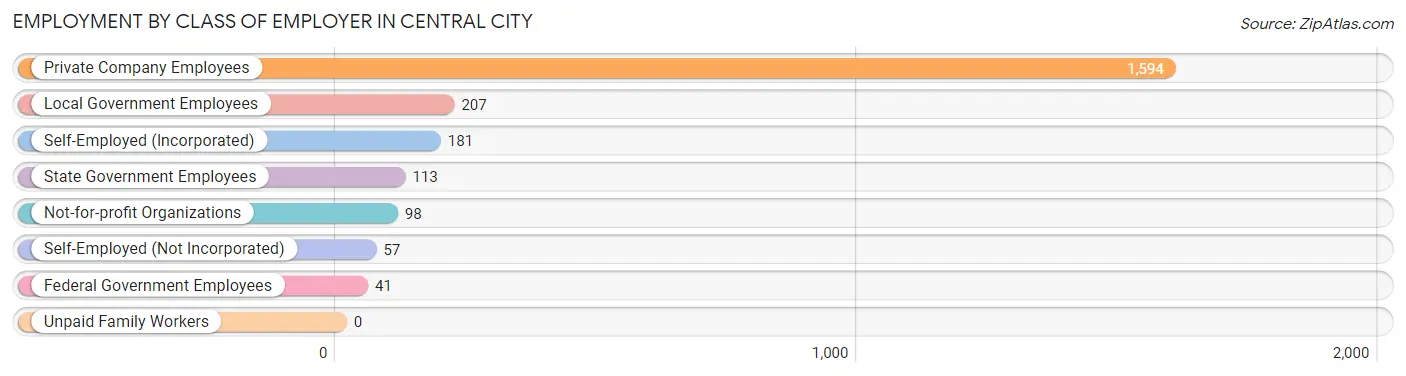
| Employer Class | # Employees | % Employees |
| Private Company Employees | 1,594 | 69.6% |
| Self-Employed (Incorporated) | 181 | 7.9% |
| Self-Employed (Not Incorporated) | 57 | 2.5% |
| Not-for-profit Organizations | 98 | 4.3% |
| Local Government Employees | 207 | 9.0% |
| State Government Employees | 113 | 4.9% |
| Federal Government Employees | 41 | 1.8% |
| Unpaid Family Workers | 0 | 0.0% |
| Total | 2,291 | 100.0% |
Employment Status by Age in Central City
According to the labor force statistics for Central City, out of the total population over 16 years of age (4,443), 55.5% or 2,466 individuals are in the labor force, with 5.0% or 123 of them unemployed. The age group with the highest labor force participation rate is 20 to 24 years, with 86.9% or 476 individuals in the labor force. Within the labor force, the 25 to 29 years age range has the highest percentage of unemployed individuals, with 18.6% or 52 of them being unemployed.
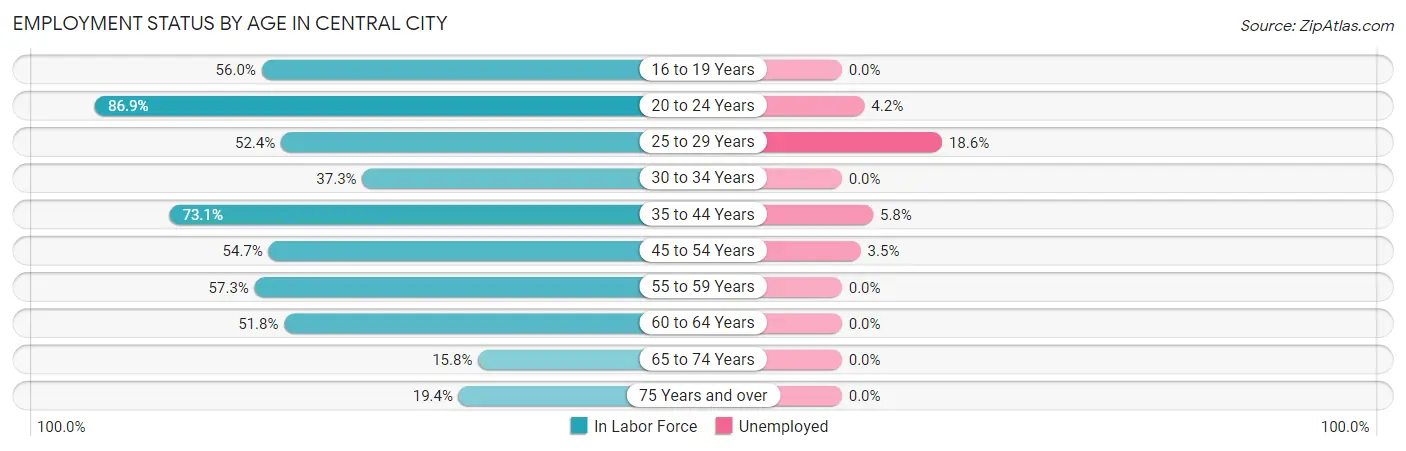
| Age Bracket | In Labor Force | Unemployed |
| 16 to 19 Years | 155 (56.0%) | 0 (0.0%) |
| 20 to 24 Years | 476 (86.9%) | 20 (4.2%) |
| 25 to 29 Years | 279 (52.4%) | 52 (18.6%) |
| 30 to 34 Years | 87 (37.3%) | 0 (0.0%) |
| 35 to 44 Years | 694 (73.1%) | 40 (5.8%) |
| 45 to 54 Years | 346 (54.7%) | 12 (3.5%) |
| 55 to 59 Years | 149 (57.3%) | 0 (0.0%) |
| 60 to 64 Years | 162 (51.8%) | 0 (0.0%) |
| 65 to 74 Years | 68 (15.8%) | 0 (0.0%) |
| 75 Years and over | 52 (19.4%) | 0 (0.0%) |
| Total | 2,466 (55.5%) | 123 (5.0%) |
Employment Status by Educational Attainment in Central City
According to labor force statistics for Central City, 58.8% of individuals (1,717) out of the total population between 25 and 64 years of age (2,920) are in the labor force, with 6.1% or 105 of them being unemployed. The group with the highest labor force participation rate are those with the educational attainment of bachelor's degree or higher, with 77.1% or 289 individuals in the labor force. Within the labor force, individuals with less than high school education have the highest percentage of unemployment, with 10.8% or 12 of them being unemployed.
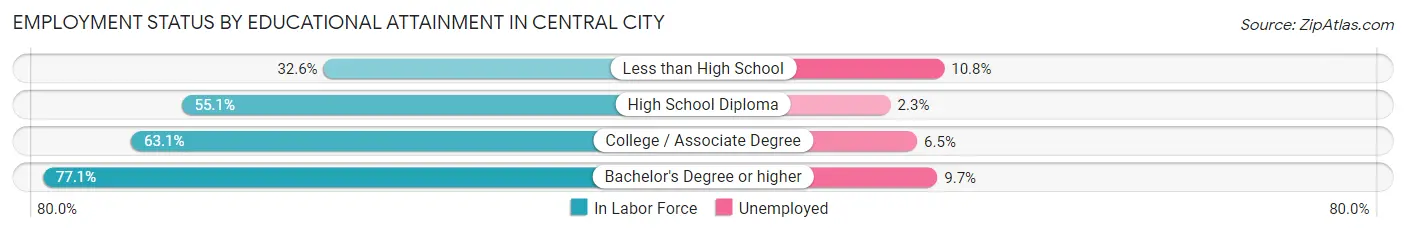
| Educational Attainment | In Labor Force | Unemployed |
| Less than High School | 111 (32.6%) | 37 (10.8%) |
| High School Diploma | 511 (55.1%) | 21 (2.3%) |
| College / Associate Degree | 806 (63.1%) | 83 (6.5%) |
| Bachelor's Degree or higher | 289 (77.1%) | 36 (9.7%) |
| Total | 1,717 (58.8%) | 178 (6.1%) |
Employment Occupations by Sex in Central City
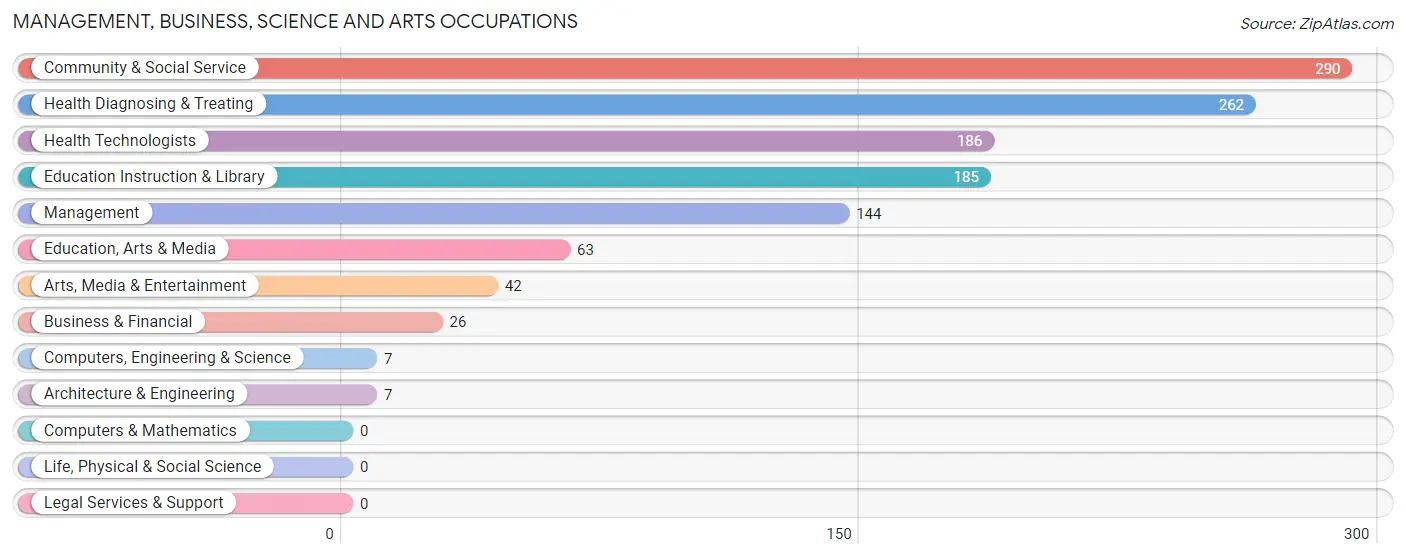
Management, Business, Science and Arts Occupations
The most common Management, Business, Science and Arts occupations in Central City are Community & Social Service (290 | 12.4%), Health Diagnosing & Treating (262 | 11.2%), Health Technologists (186 | 7.9%), Education Instruction & Library (185 | 7.9%), and Management (144 | 6.1%).
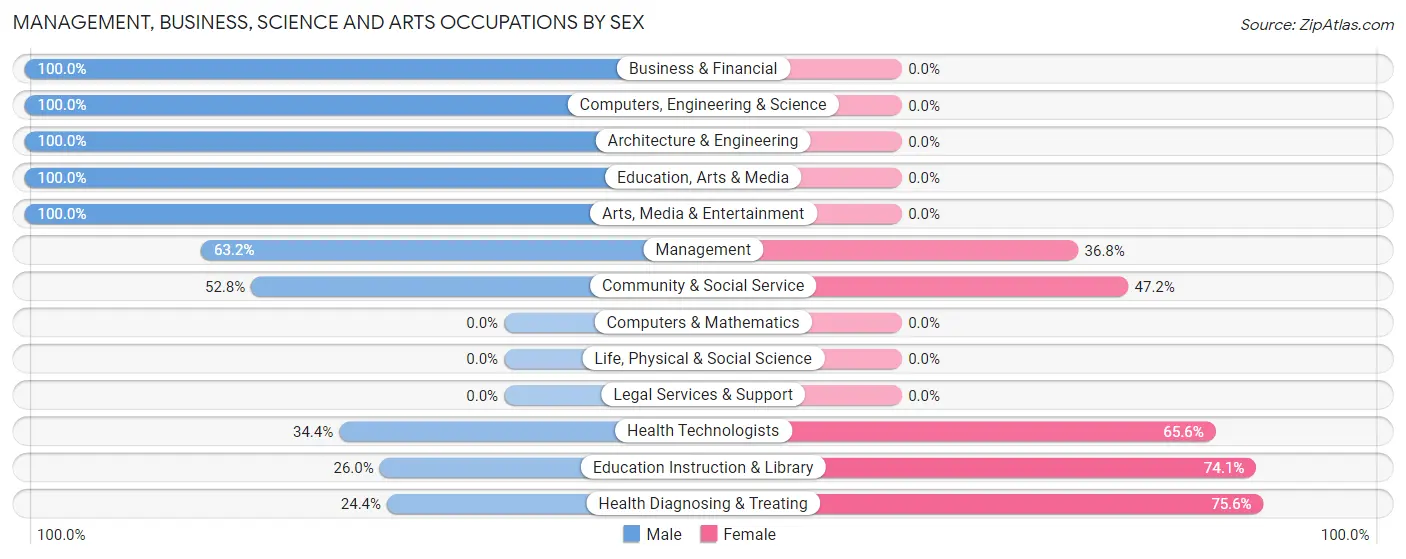
Management, Business, Science and Arts Occupations by Sex
Within the Management, Business, Science and Arts occupations in Central City, the most male-oriented occupations are Business & Financial (100.0%), Computers, Engineering & Science (100.0%), and Architecture & Engineering (100.0%), while the most female-oriented occupations are Health Diagnosing & Treating (75.6%), Education Instruction & Library (74.1%), and Health Technologists (65.6%).
| Occupation | Male | Female |
| Management | 91 (63.2%) | 53 (36.8%) |
| Business & Financial | 26 (100.0%) | 0 (0.0%) |
| Computers, Engineering & Science | 7 (100.0%) | 0 (0.0%) |
| Computers & Mathematics | 0 (0.0%) | 0 (0.0%) |
| Architecture & Engineering | 7 (100.0%) | 0 (0.0%) |
| Life, Physical & Social Science | 0 (0.0%) | 0 (0.0%) |
| Community & Social Service | 153 (52.8%) | 137 (47.2%) |
| Education, Arts & Media | 63 (100.0%) | 0 (0.0%) |
| Legal Services & Support | 0 (0.0%) | 0 (0.0%) |
| Education Instruction & Library | 48 (26.0%) | 137 (74.1%) |
| Arts, Media & Entertainment | 42 (100.0%) | 0 (0.0%) |
| Health Diagnosing & Treating | 64 (24.4%) | 198 (75.6%) |
| Health Technologists | 64 (34.4%) | 122 (65.6%) |
| Total (Category) | 341 (46.8%) | 388 (53.2%) |
| Total (Overall) | 1,274 (54.3%) | 1,070 (45.7%) |
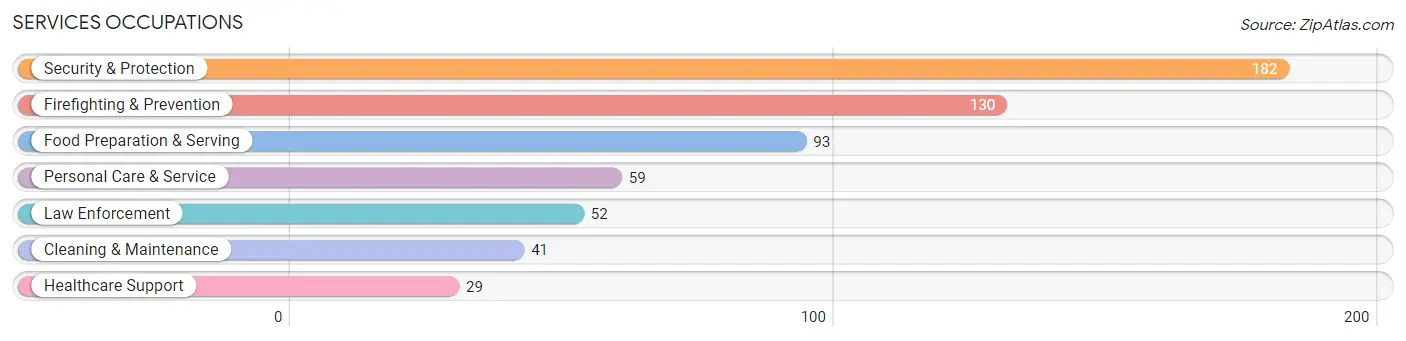
Services Occupations
The most common Services occupations in Central City are Security & Protection (182 | 7.8%), Firefighting & Prevention (130 | 5.6%), Food Preparation & Serving (93 | 4.0%), Personal Care & Service (59 | 2.5%), and Law Enforcement (52 | 2.2%).
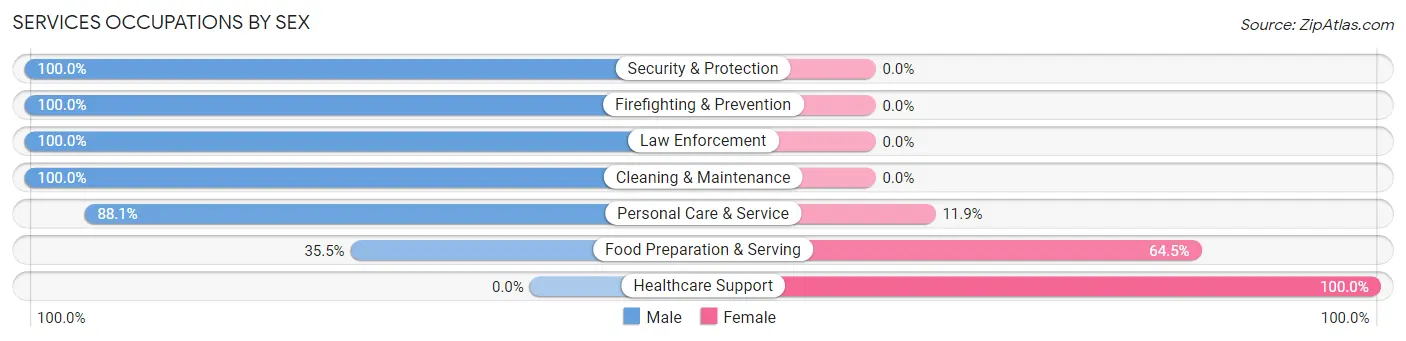
Services Occupations by Sex
Within the Services occupations in Central City, the most male-oriented occupations are Security & Protection (100.0%), Firefighting & Prevention (100.0%), and Law Enforcement (100.0%), while the most female-oriented occupations are Healthcare Support (100.0%), Food Preparation & Serving (64.5%), and Personal Care & Service (11.9%).
| Occupation | Male | Female |
| Healthcare Support | 0 (0.0%) | 29 (100.0%) |
| Security & Protection | 182 (100.0%) | 0 (0.0%) |
| Firefighting & Prevention | 130 (100.0%) | 0 (0.0%) |
| Law Enforcement | 52 (100.0%) | 0 (0.0%) |
| Food Preparation & Serving | 33 (35.5%) | 60 (64.5%) |
| Cleaning & Maintenance | 41 (100.0%) | 0 (0.0%) |
| Personal Care & Service | 52 (88.1%) | 7 (11.9%) |
| Total (Category) | 308 (76.2%) | 96 (23.8%) |
| Total (Overall) | 1,274 (54.3%) | 1,070 (45.7%) |
Sales and Office Occupations
The most common Sales and Office occupations in Central City are Office & Administration (316 | 13.5%), and Sales & Related (278 | 11.9%).
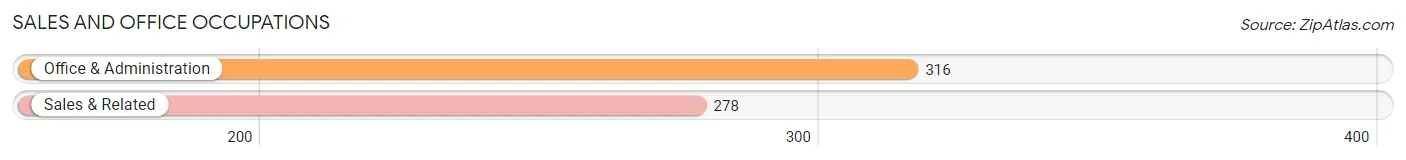
Sales and Office Occupations by Sex

| Occupation | Male | Female |
| Sales & Related | 122 (43.9%) | 156 (56.1%) |
| Office & Administration | 29 (9.2%) | 287 (90.8%) |
| Total (Category) | 151 (25.4%) | 443 (74.6%) |
| Total (Overall) | 1,274 (54.3%) | 1,070 (45.7%) |
Natural Resources, Construction and Maintenance Occupations
The most common Natural Resources, Construction and Maintenance occupations in Central City are Construction & Extraction (132 | 5.6%), and Installation, Maintenance & Repair (59 | 2.5%).
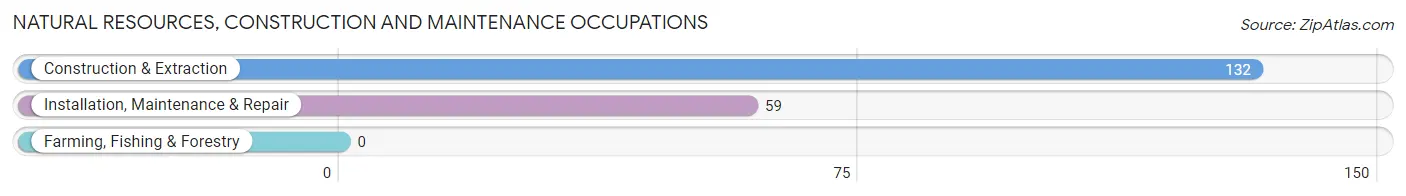
Natural Resources, Construction and Maintenance Occupations by Sex

| Occupation | Male | Female |
| Farming, Fishing & Forestry | 0 (0.0%) | 0 (0.0%) |
| Construction & Extraction | 132 (100.0%) | 0 (0.0%) |
| Installation, Maintenance & Repair | 59 (100.0%) | 0 (0.0%) |
| Total (Category) | 191 (100.0%) | 0 (0.0%) |
| Total (Overall) | 1,274 (54.3%) | 1,070 (45.7%) |
Production, Transportation and Moving Occupations
The most common Production, Transportation and Moving occupations in Central City are Material Moving (235 | 10.0%), Production (161 | 6.9%), and Transportation (30 | 1.3%).
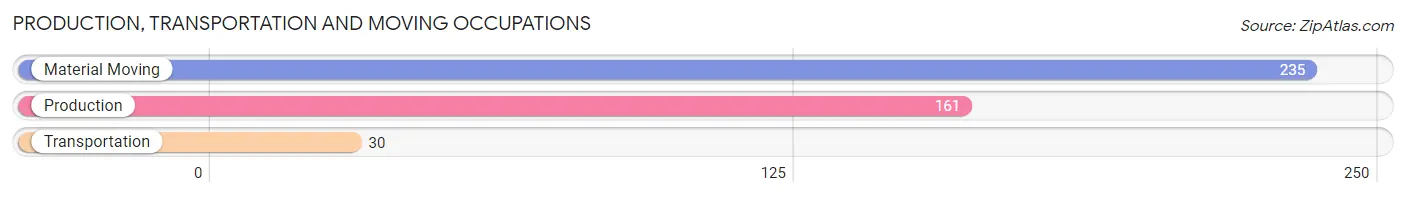
Production, Transportation and Moving Occupations by Sex
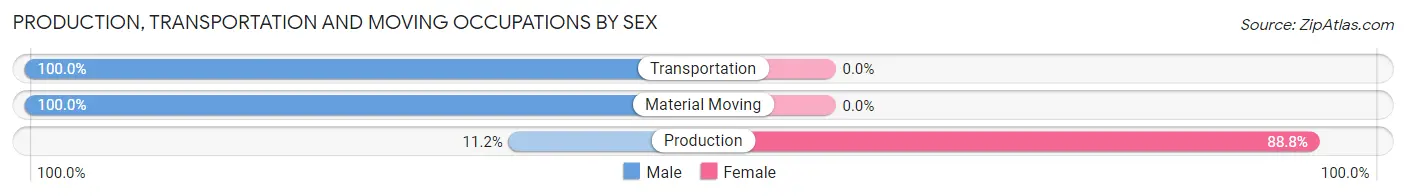
| Occupation | Male | Female |
| Production | 18 (11.2%) | 143 (88.8%) |
| Transportation | 30 (100.0%) | 0 (0.0%) |
| Material Moving | 235 (100.0%) | 0 (0.0%) |
| Total (Category) | 283 (66.4%) | 143 (33.6%) |
| Total (Overall) | 1,274 (54.3%) | 1,070 (45.7%) |
Employment Industries by Sex in Central City
Employment Industries in Central City
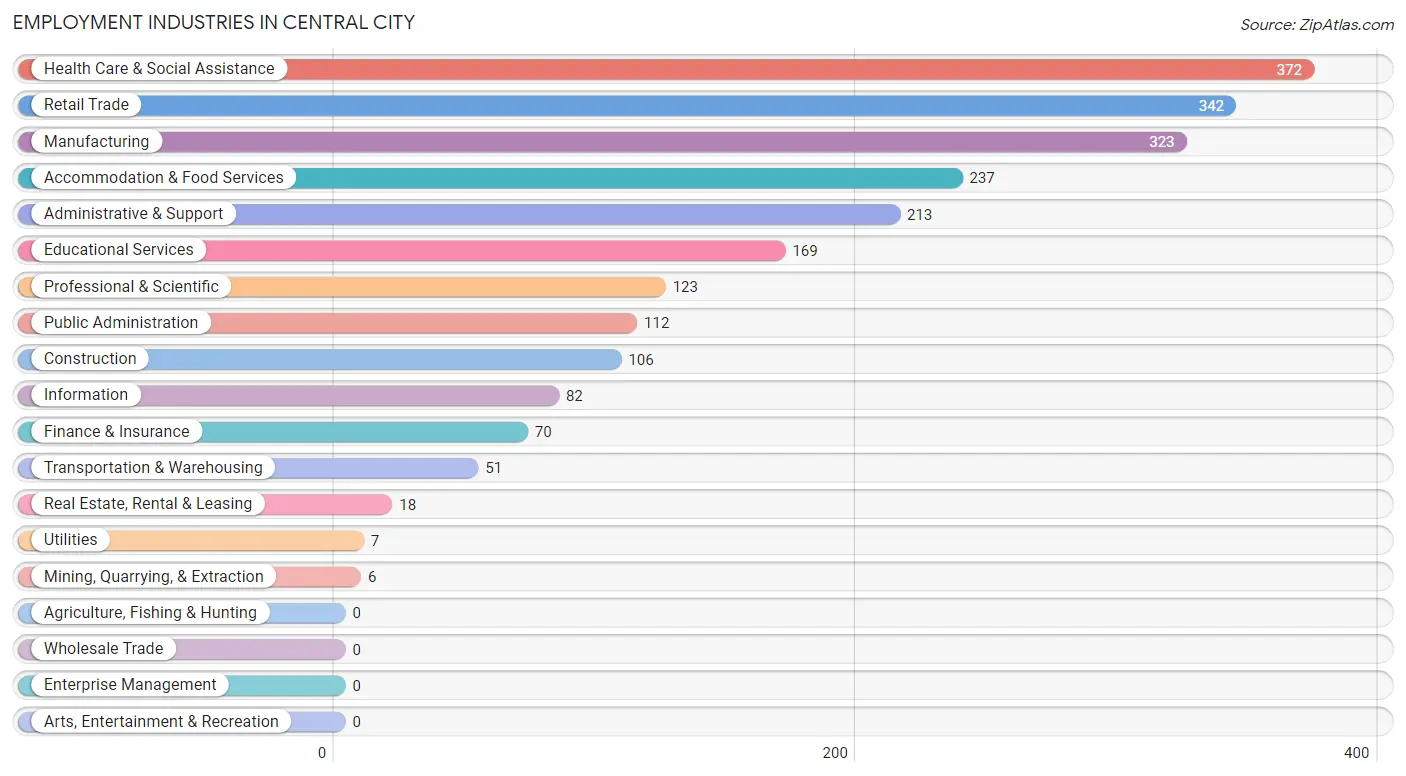
The major employment industries in Central City include Health Care & Social Assistance (372 | 15.9%), Retail Trade (342 | 14.6%), Manufacturing (323 | 13.8%), Accommodation & Food Services (237 | 10.1%), and Administrative & Support (213 | 9.1%).
Employment Industries by Sex in Central City
The Central City industries that see more men than women are Mining, Quarrying, & Extraction (100.0%), Transportation & Warehousing (100.0%), and Utilities (100.0%), whereas the industries that tend to have a higher number of women are Health Care & Social Assistance (84.4%), Professional & Scientific (78.9%), and Educational Services (71.6%).
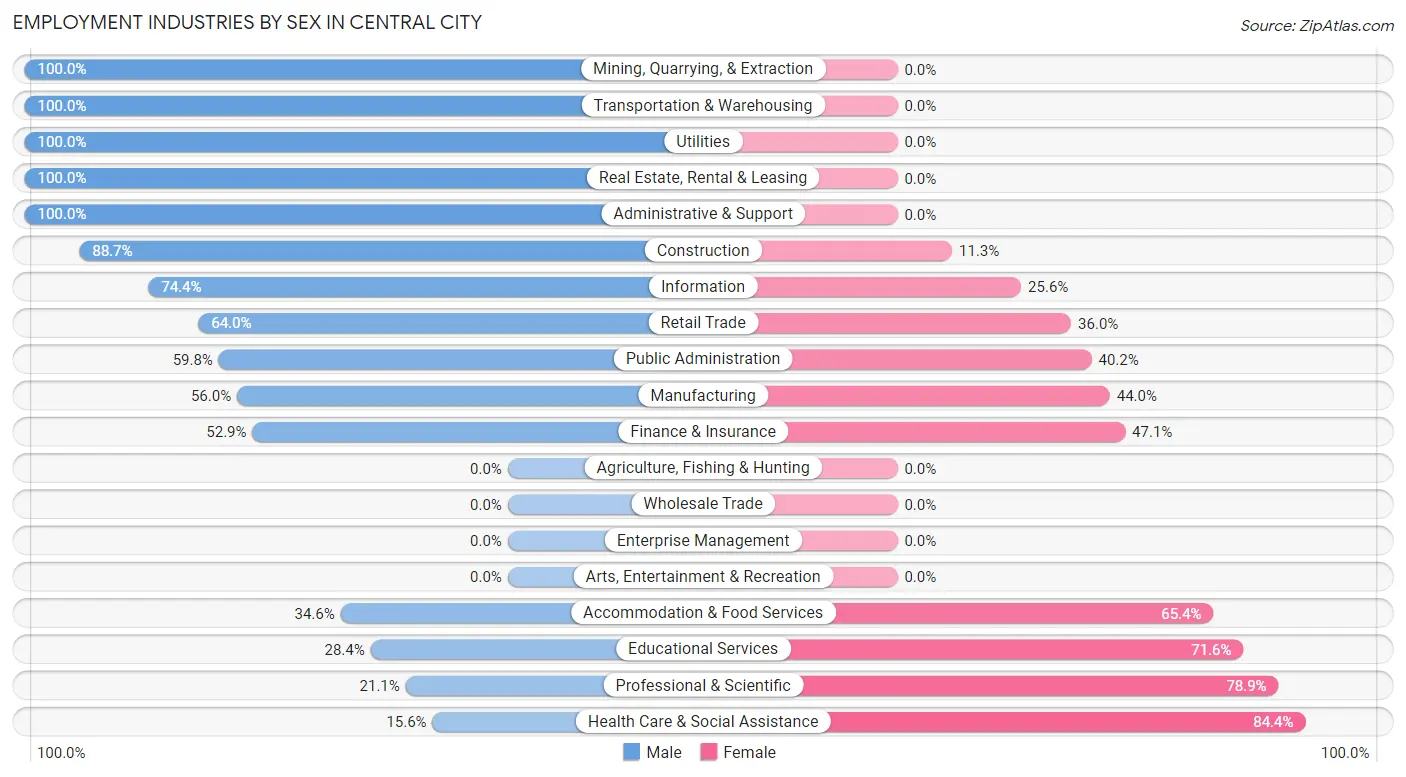
| Industry | Male | Female |
| Agriculture, Fishing & Hunting | 0 (0.0%) | 0 (0.0%) |
| Mining, Quarrying, & Extraction | 6 (100.0%) | 0 (0.0%) |
| Construction | 94 (88.7%) | 12 (11.3%) |
| Manufacturing | 181 (56.0%) | 142 (44.0%) |
| Wholesale Trade | 0 (0.0%) | 0 (0.0%) |
| Retail Trade | 219 (64.0%) | 123 (36.0%) |
| Transportation & Warehousing | 51 (100.0%) | 0 (0.0%) |
| Utilities | 7 (100.0%) | 0 (0.0%) |
| Information | 61 (74.4%) | 21 (25.6%) |
| Finance & Insurance | 37 (52.9%) | 33 (47.1%) |
| Real Estate, Rental & Leasing | 18 (100.0%) | 0 (0.0%) |
| Professional & Scientific | 26 (21.1%) | 97 (78.9%) |
| Enterprise Management | 0 (0.0%) | 0 (0.0%) |
| Administrative & Support | 213 (100.0%) | 0 (0.0%) |
| Educational Services | 48 (28.4%) | 121 (71.6%) |
| Health Care & Social Assistance | 58 (15.6%) | 314 (84.4%) |
| Arts, Entertainment & Recreation | 0 (0.0%) | 0 (0.0%) |
| Accommodation & Food Services | 82 (34.6%) | 155 (65.4%) |
| Public Administration | 67 (59.8%) | 45 (40.2%) |
| Total | 1,274 (54.3%) | 1,070 (45.7%) |
Education in Central City
School Enrollment in Central City
The most common levels of schooling among the 1,209 students in Central City are high school (444 | 36.7%), middle school (234 | 19.4%), and elementary school (189 | 15.6%).
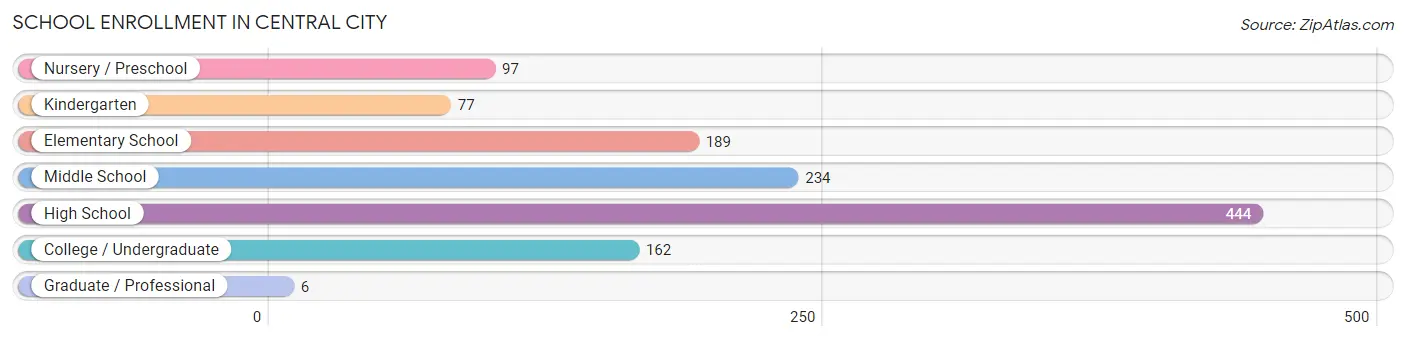
| School Level | # Students | % Students |
| Nursery / Preschool | 97 | 8.0% |
| Kindergarten | 77 | 6.4% |
| Elementary School | 189 | 15.6% |
| Middle School | 234 | 19.4% |
| High School | 444 | 36.7% |
| College / Undergraduate | 162 | 13.4% |
| Graduate / Professional | 6 | 0.5% |
| Total | 1,209 | 100.0% |
School Enrollment by Age by Funding Source in Central City
Out of a total of 1,209 students who are enrolled in schools in Central City, 79 (6.5%) attend a private institution, while the remaining 1,130 (93.5%) are enrolled in public schools. The age group of 5 to 9 year old has the highest likelihood of being enrolled in private schools, with 33 (19.1% in the age bracket) enrolled. Conversely, the age group of 3 to 4 year olds has the lowest likelihood of being enrolled in a private school, with 50 (100.0% in the age bracket) attending a public institution.
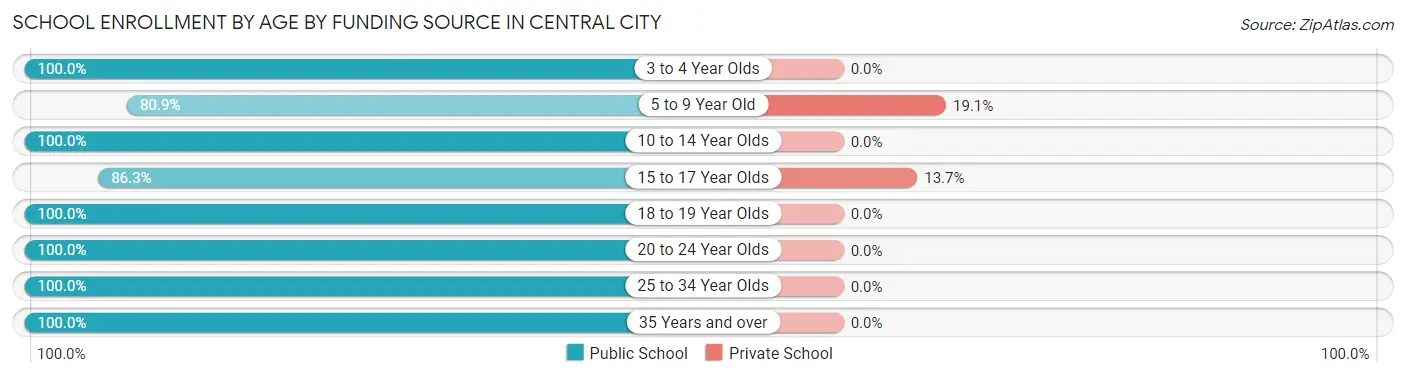
| Age Bracket | Public School | Private School |
| 3 to 4 Year Olds | 50 (100.0%) | 0 (0.0%) |
| 5 to 9 Year Old | 140 (80.9%) | 33 (19.1%) |
| 10 to 14 Year Olds | 409 (100.0%) | 0 (0.0%) |
| 15 to 17 Year Olds | 283 (86.3%) | 45 (13.7%) |
| 18 to 19 Year Olds | 81 (100.0%) | 0 (0.0%) |
| 20 to 24 Year Olds | 52 (100.0%) | 0 (0.0%) |
| 25 to 34 Year Olds | 103 (100.0%) | 0 (0.0%) |
| 35 Years and over | 13 (100.0%) | 0 (0.0%) |
| Total | 1,130 (93.5%) | 79 (6.5%) |
Educational Attainment by Field of Study in Central City
Science & technology (168 | 33.3%), education (113 | 22.4%), liberal arts & history (87 | 17.3%), business (56 | 11.1%), and social sciences (24 | 4.8%) are the most common fields of study among 504 individuals in Central City who have obtained a bachelor's degree or higher.
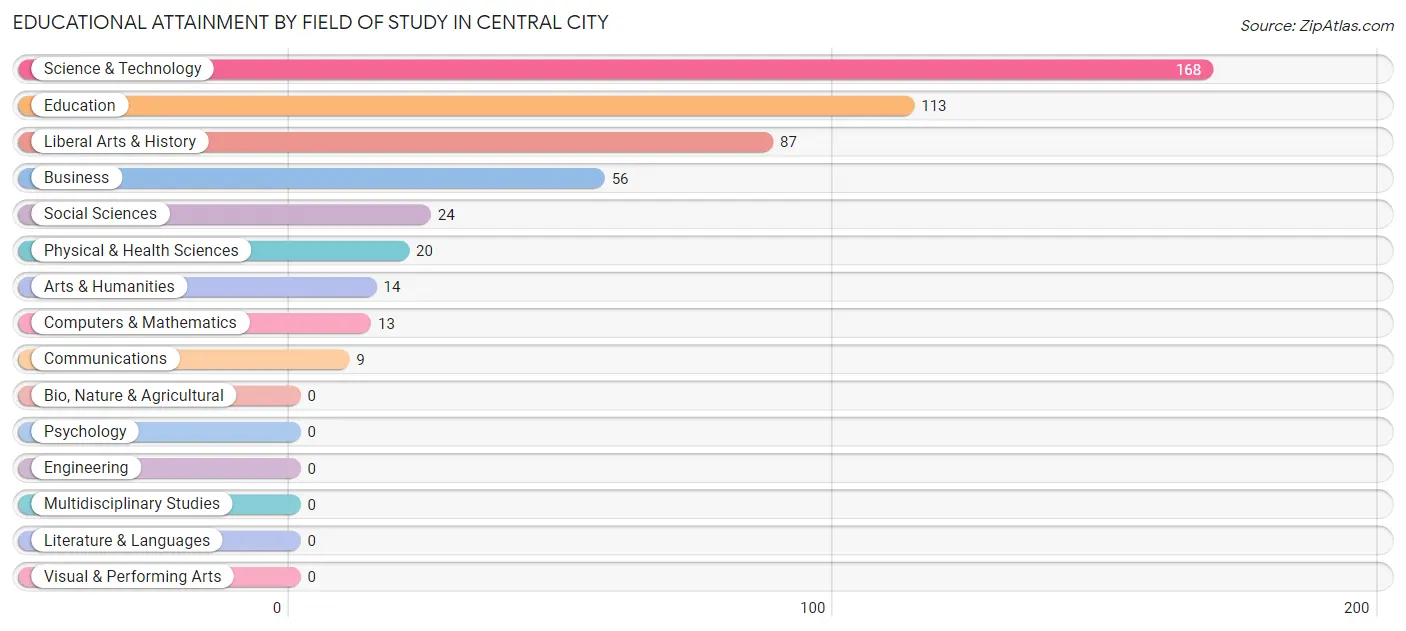
| Field of Study | # Graduates | % Graduates |
| Computers & Mathematics | 13 | 2.6% |
| Bio, Nature & Agricultural | 0 | 0.0% |
| Physical & Health Sciences | 20 | 4.0% |
| Psychology | 0 | 0.0% |
| Social Sciences | 24 | 4.8% |
| Engineering | 0 | 0.0% |
| Multidisciplinary Studies | 0 | 0.0% |
| Science & Technology | 168 | 33.3% |
| Business | 56 | 11.1% |
| Education | 113 | 22.4% |
| Literature & Languages | 0 | 0.0% |
| Liberal Arts & History | 87 | 17.3% |
| Visual & Performing Arts | 0 | 0.0% |
| Communications | 9 | 1.8% |
| Arts & Humanities | 14 | 2.8% |
| Total | 504 | 100.0% |
Transportation & Commute in Central City
Vehicle Availability by Sex in Central City
The most prevalent vehicle ownership categories in Central City are males with 2 vehicles (674, accounting for 53.7%) and females with 2 vehicles (486, making up 65.0%).
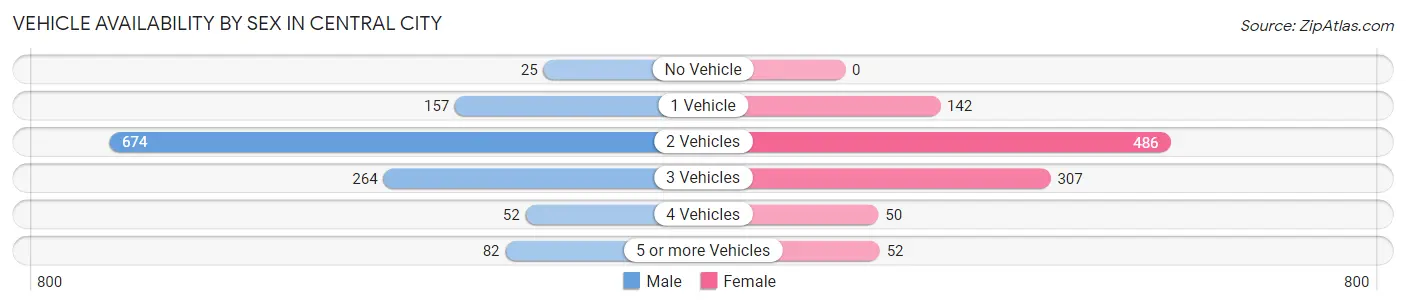
| Vehicles Available | Male | Female |
| No Vehicle | 25 (2.0%) | 0 (0.0%) |
| 1 Vehicle | 157 (12.5%) | 142 (13.7%) |
| 2 Vehicles | 674 (53.7%) | 486 (46.9%) |
| 3 Vehicles | 264 (21.0%) | 307 (29.6%) |
| 4 Vehicles | 52 (4.2%) | 50 (4.8%) |
| 5 or more Vehicles | 82 (6.5%) | 52 (5.0%) |
| Total | 1,254 (100.0%) | 1,037 (100.0%) |
Commute Time in Central City
The most frequently occuring commute durations in Central City are 20 to 24 minutes (558 commuters, 24.4%), 5 to 9 minutes (415 commuters, 18.1%), and less than 5 minutes (347 commuters, 15.1%).
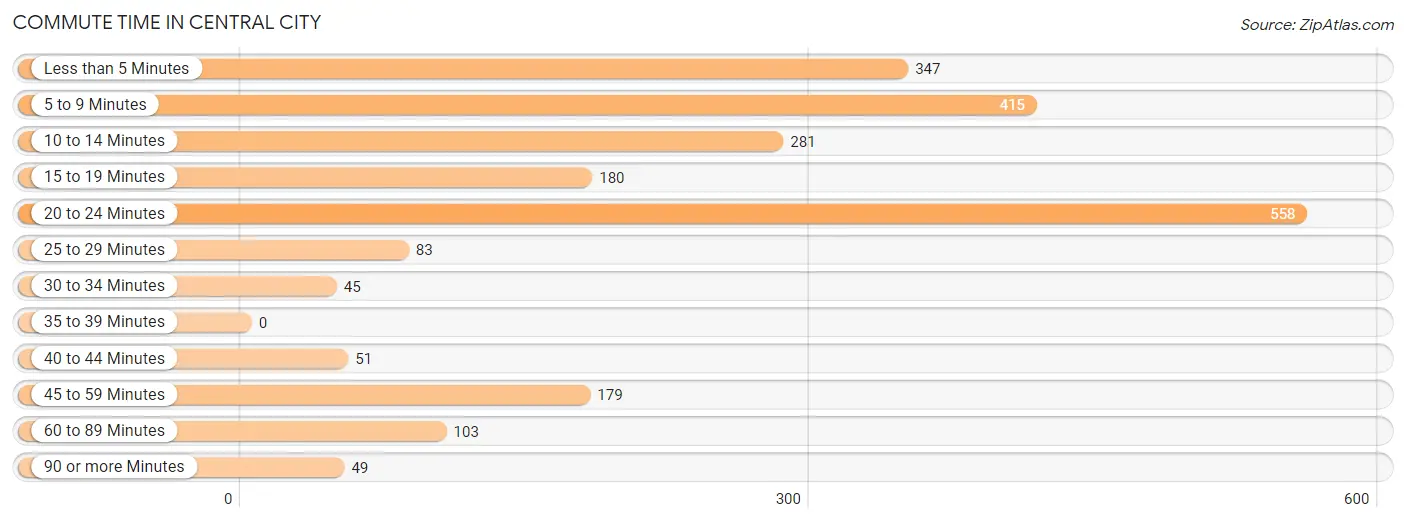
| Commute Time | # Commuters | % Commuters |
| Less than 5 Minutes | 347 | 15.1% |
| 5 to 9 Minutes | 415 | 18.1% |
| 10 to 14 Minutes | 281 | 12.3% |
| 15 to 19 Minutes | 180 | 7.9% |
| 20 to 24 Minutes | 558 | 24.4% |
| 25 to 29 Minutes | 83 | 3.6% |
| 30 to 34 Minutes | 45 | 2.0% |
| 35 to 39 Minutes | 0 | 0.0% |
| 40 to 44 Minutes | 51 | 2.2% |
| 45 to 59 Minutes | 179 | 7.8% |
| 60 to 89 Minutes | 103 | 4.5% |
| 90 or more Minutes | 49 | 2.1% |
Commute Time by Sex in Central City
The most common commute times in Central City are 20 to 24 minutes (324 commuters, 25.8%) for males and 20 to 24 minutes (234 commuters, 22.6%) for females.
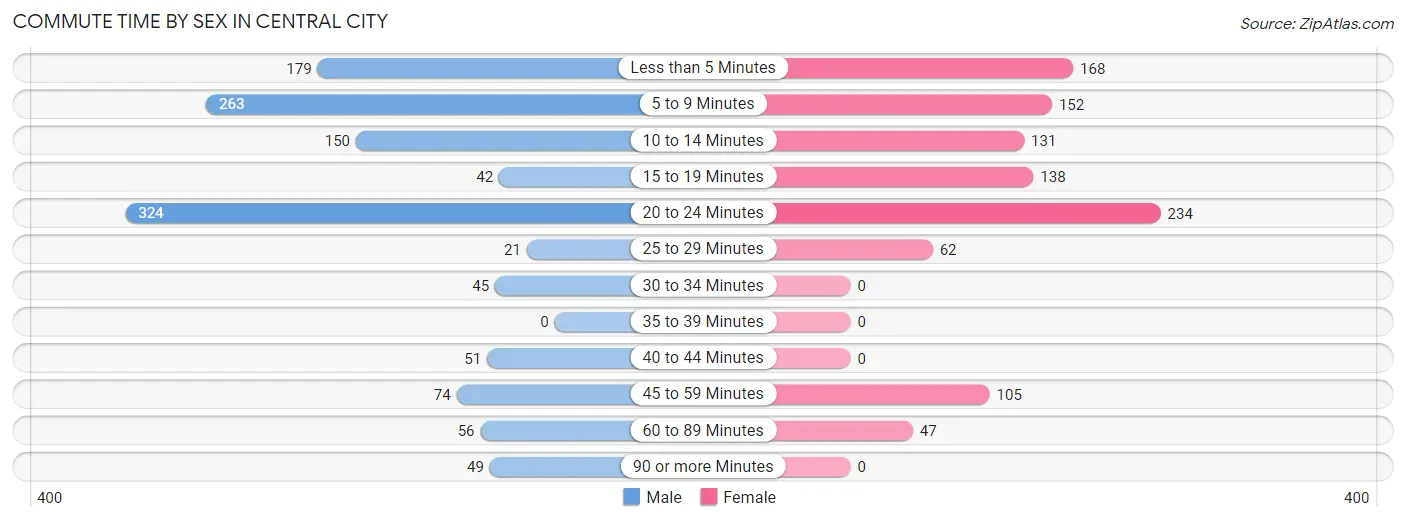
| Commute Time | Male | Female |
| Less than 5 Minutes | 179 (14.3%) | 168 (16.2%) |
| 5 to 9 Minutes | 263 (21.0%) | 152 (14.7%) |
| 10 to 14 Minutes | 150 (12.0%) | 131 (12.6%) |
| 15 to 19 Minutes | 42 (3.4%) | 138 (13.3%) |
| 20 to 24 Minutes | 324 (25.8%) | 234 (22.6%) |
| 25 to 29 Minutes | 21 (1.7%) | 62 (6.0%) |
| 30 to 34 Minutes | 45 (3.6%) | 0 (0.0%) |
| 35 to 39 Minutes | 0 (0.0%) | 0 (0.0%) |
| 40 to 44 Minutes | 51 (4.1%) | 0 (0.0%) |
| 45 to 59 Minutes | 74 (5.9%) | 105 (10.1%) |
| 60 to 89 Minutes | 56 (4.5%) | 47 (4.5%) |
| 90 or more Minutes | 49 (3.9%) | 0 (0.0%) |
Time of Departure to Work by Sex in Central City
The most frequent times of departure to work in Central City are 6:30 AM to 6:59 AM (208, 16.6%) for males and 7:30 AM to 7:59 AM (254, 24.5%) for females.
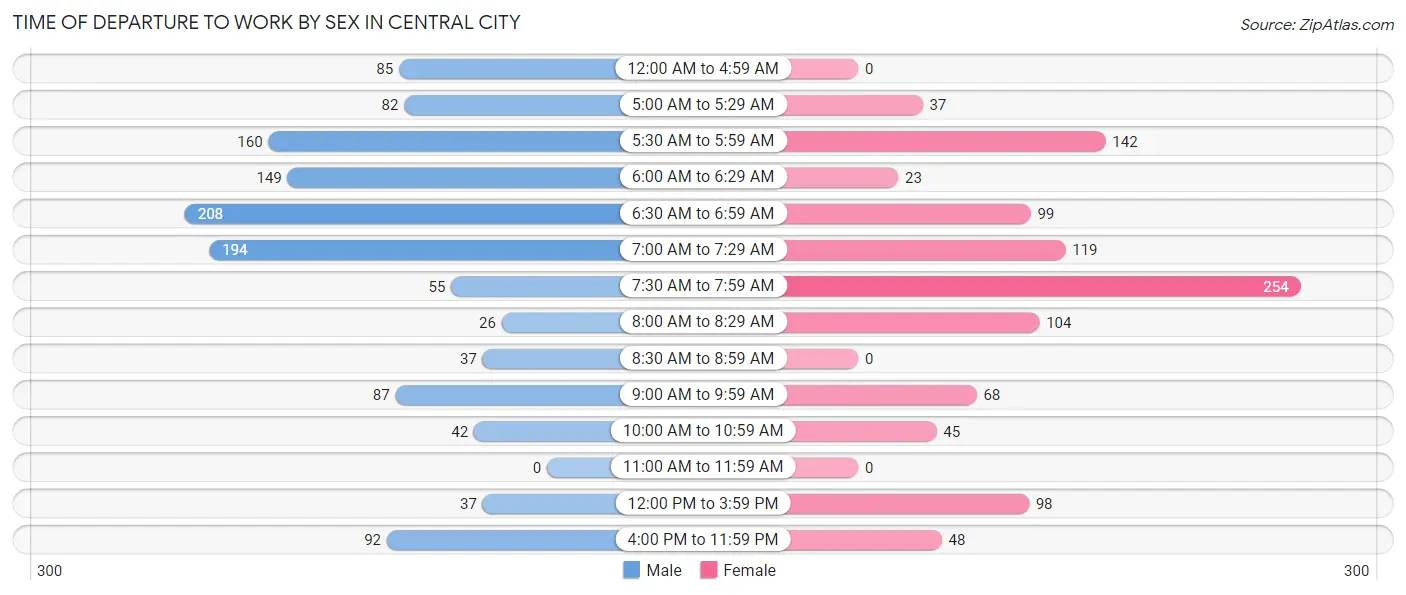
| Time of Departure | Male | Female |
| 12:00 AM to 4:59 AM | 85 (6.8%) | 0 (0.0%) |
| 5:00 AM to 5:29 AM | 82 (6.5%) | 37 (3.6%) |
| 5:30 AM to 5:59 AM | 160 (12.8%) | 142 (13.7%) |
| 6:00 AM to 6:29 AM | 149 (11.9%) | 23 (2.2%) |
| 6:30 AM to 6:59 AM | 208 (16.6%) | 99 (9.6%) |
| 7:00 AM to 7:29 AM | 194 (15.5%) | 119 (11.5%) |
| 7:30 AM to 7:59 AM | 55 (4.4%) | 254 (24.5%) |
| 8:00 AM to 8:29 AM | 26 (2.1%) | 104 (10.0%) |
| 8:30 AM to 8:59 AM | 37 (2.9%) | 0 (0.0%) |
| 9:00 AM to 9:59 AM | 87 (6.9%) | 68 (6.6%) |
| 10:00 AM to 10:59 AM | 42 (3.4%) | 45 (4.3%) |
| 11:00 AM to 11:59 AM | 0 (0.0%) | 0 (0.0%) |
| 12:00 PM to 3:59 PM | 37 (2.9%) | 98 (9.5%) |
| 4:00 PM to 11:59 PM | 92 (7.3%) | 48 (4.6%) |
| Total | 1,254 (100.0%) | 1,037 (100.0%) |
Housing Occupancy in Central City
Occupancy by Ownership in Central City
Of the total 1,826 dwellings in Central City, owner-occupied units account for 1,269 (69.5%), while renter-occupied units make up 557 (30.5%).
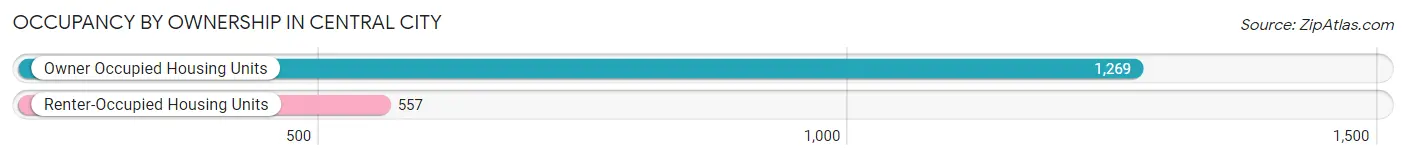
| Occupancy | # Housing Units | % Housing Units |
| Owner Occupied Housing Units | 1,269 | 69.5% |
| Renter-Occupied Housing Units | 557 | 30.5% |
| Total Occupied Housing Units | 1,826 | 100.0% |
Occupancy by Household Size in Central City
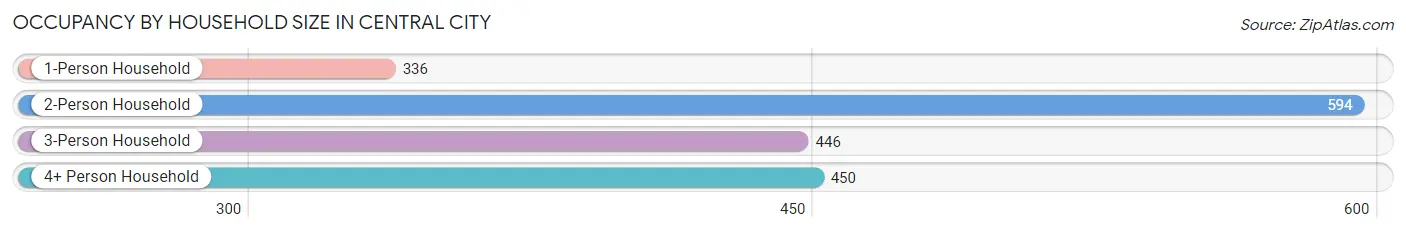
| Household Size | # Housing Units | % Housing Units |
| 1-Person Household | 336 | 18.4% |
| 2-Person Household | 594 | 32.5% |
| 3-Person Household | 446 | 24.4% |
| 4+ Person Household | 450 | 24.6% |
| Total Housing Units | 1,826 | 100.0% |
Occupancy by Ownership by Household Size in Central City
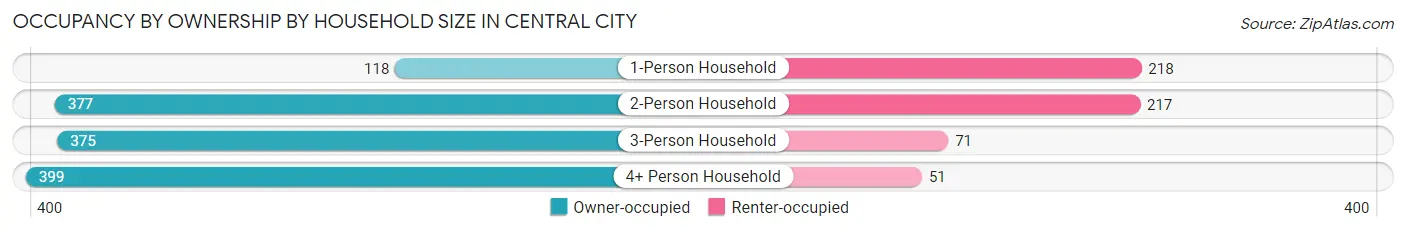
| Household Size | Owner-occupied | Renter-occupied |
| 1-Person Household | 118 (35.1%) | 218 (64.9%) |
| 2-Person Household | 377 (63.5%) | 217 (36.5%) |
| 3-Person Household | 375 (84.1%) | 71 (15.9%) |
| 4+ Person Household | 399 (88.7%) | 51 (11.3%) |
| Total Housing Units | 1,269 (69.5%) | 557 (30.5%) |
Occupancy by Educational Attainment in Central City
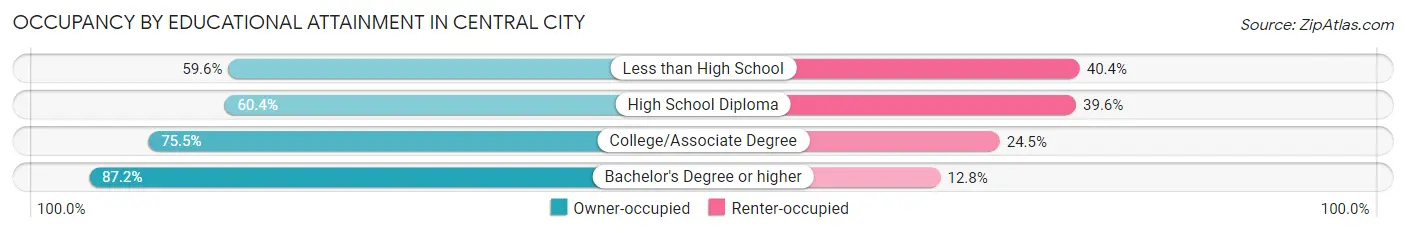
| Household Size | Owner-occupied | Renter-occupied |
| Less than High School | 124 (59.6%) | 84 (40.4%) |
| High School Diploma | 437 (60.4%) | 287 (39.6%) |
| College/Associate Degree | 462 (75.5%) | 150 (24.5%) |
| Bachelor's Degree or higher | 246 (87.2%) | 36 (12.8%) |
Occupancy by Age of Householder in Central City
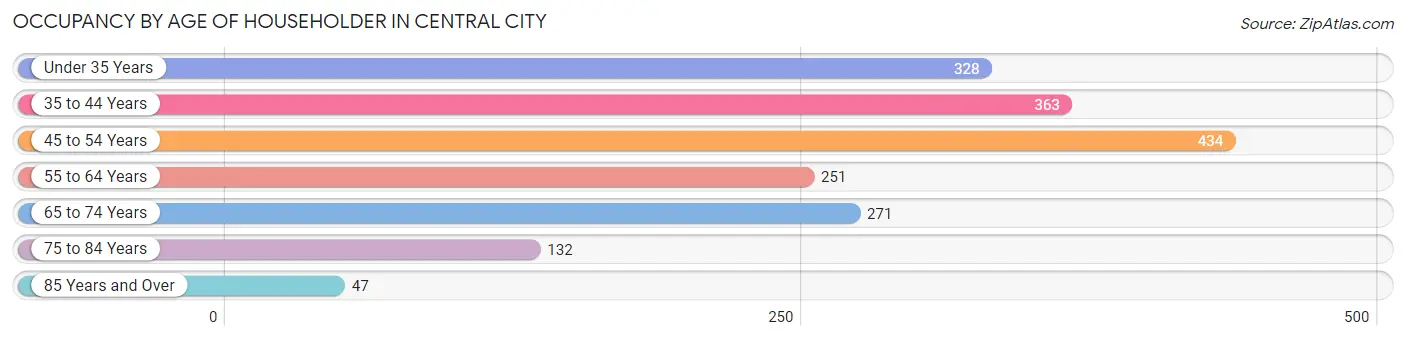
| Age Bracket | # Households | % Households |
| Under 35 Years | 328 | 18.0% |
| 35 to 44 Years | 363 | 19.9% |
| 45 to 54 Years | 434 | 23.8% |
| 55 to 64 Years | 251 | 13.8% |
| 65 to 74 Years | 271 | 14.8% |
| 75 to 84 Years | 132 | 7.2% |
| 85 Years and Over | 47 | 2.6% |
| Total | 1,826 | 100.0% |
Housing Finances in Central City
Median Income by Occupancy in Central City
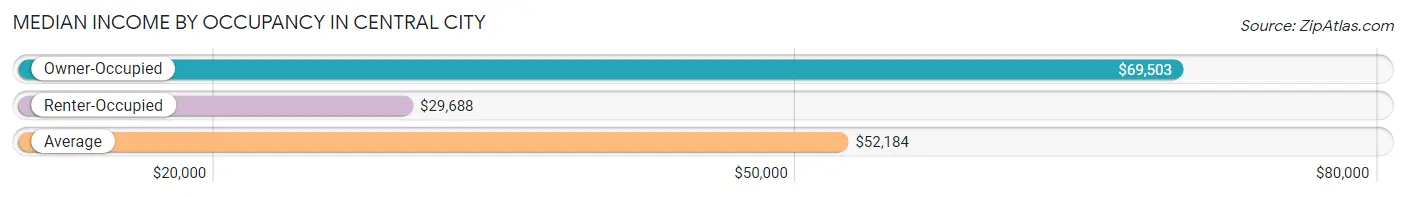
| Occupancy Type | # Households | Median Income |
| Owner-Occupied | 1,269 (69.5%) | $69,503 |
| Renter-Occupied | 557 (30.5%) | $29,688 |
| Average | 1,826 (100.0%) | $52,184 |
Occupancy by Householder Income Bracket in Central City
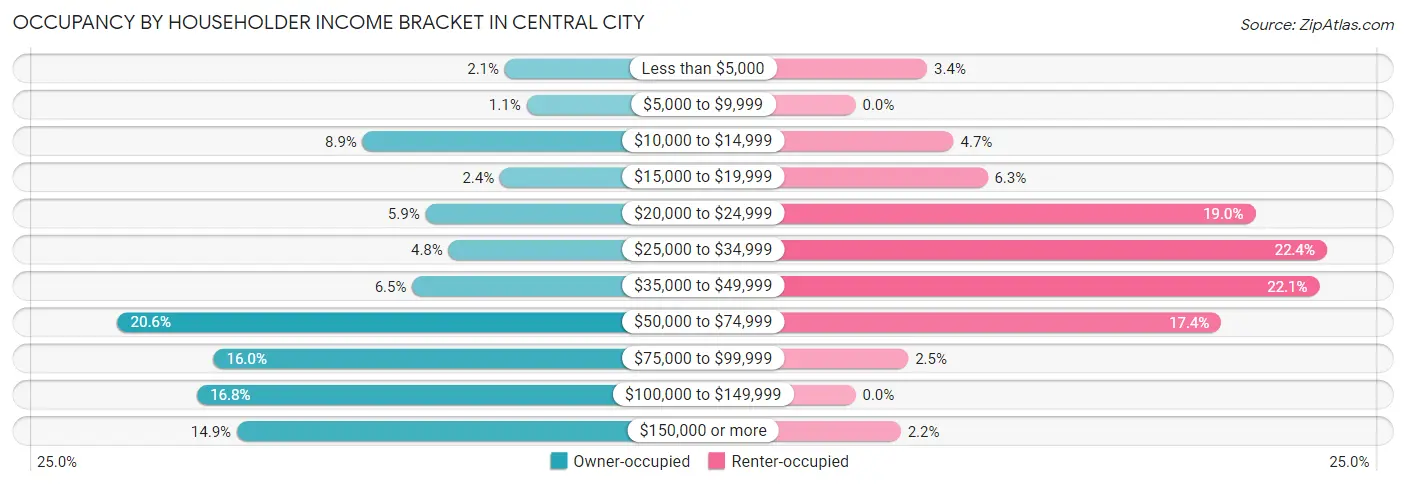
| Income Bracket | Owner-occupied | Renter-occupied |
| Less than $5,000 | 27 (2.1%) | 19 (3.4%) |
| $5,000 to $9,999 | 14 (1.1%) | 0 (0.0%) |
| $10,000 to $14,999 | 113 (8.9%) | 26 (4.7%) |
| $15,000 to $19,999 | 30 (2.4%) | 35 (6.3%) |
| $20,000 to $24,999 | 75 (5.9%) | 106 (19.0%) |
| $25,000 to $34,999 | 61 (4.8%) | 125 (22.4%) |
| $35,000 to $49,999 | 83 (6.5%) | 123 (22.1%) |
| $50,000 to $74,999 | 261 (20.6%) | 97 (17.4%) |
| $75,000 to $99,999 | 203 (16.0%) | 14 (2.5%) |
| $100,000 to $149,999 | 213 (16.8%) | 0 (0.0%) |
| $150,000 or more | 189 (14.9%) | 12 (2.1%) |
| Total | 1,269 (100.0%) | 557 (100.0%) |
Monthly Housing Cost Tiers in Central City
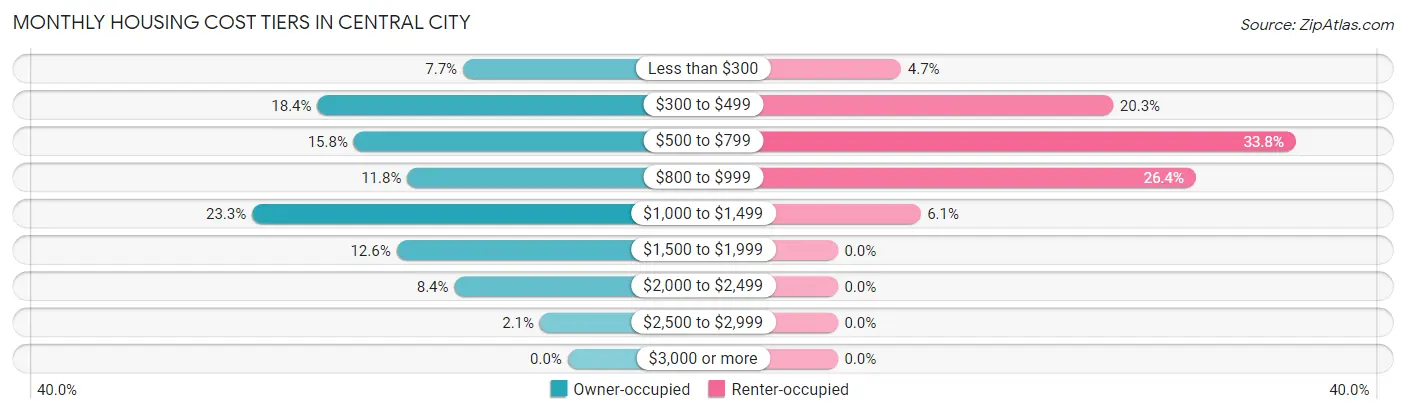
| Monthly Cost | Owner-occupied | Renter-occupied |
| Less than $300 | 98 (7.7%) | 26 (4.7%) |
| $300 to $499 | 234 (18.4%) | 113 (20.3%) |
| $500 to $799 | 200 (15.8%) | 188 (33.8%) |
| $800 to $999 | 150 (11.8%) | 147 (26.4%) |
| $1,000 to $1,499 | 295 (23.3%) | 34 (6.1%) |
| $1,500 to $1,999 | 160 (12.6%) | 0 (0.0%) |
| $2,000 to $2,499 | 106 (8.4%) | 0 (0.0%) |
| $2,500 to $2,999 | 26 (2.1%) | 0 (0.0%) |
| $3,000 or more | 0 (0.0%) | 0 (0.0%) |
| Total | 1,269 (100.0%) | 557 (100.0%) |
Physical Housing Characteristics in Central City
Housing Structures in Central City
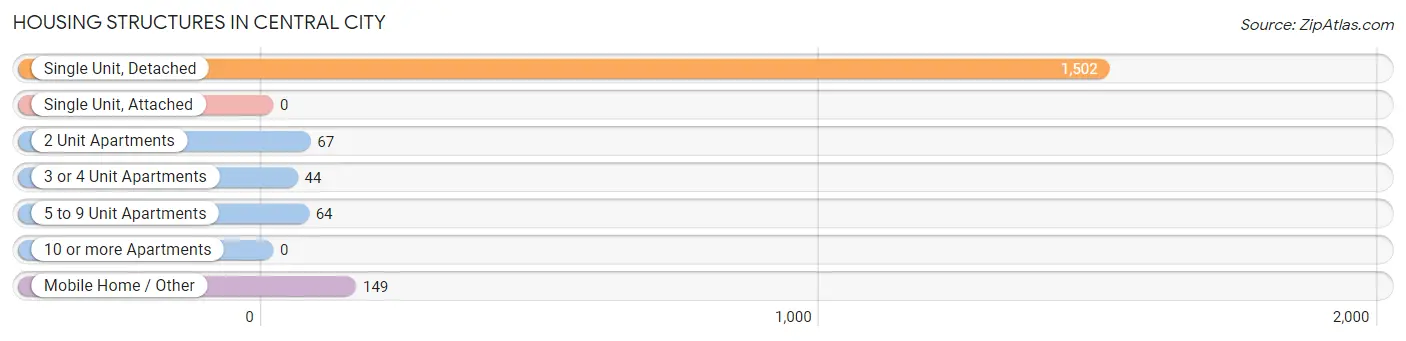
| Structure Type | # Housing Units | % Housing Units |
| Single Unit, Detached | 1,502 | 82.3% |
| Single Unit, Attached | 0 | 0.0% |
| 2 Unit Apartments | 67 | 3.7% |
| 3 or 4 Unit Apartments | 44 | 2.4% |
| 5 to 9 Unit Apartments | 64 | 3.5% |
| 10 or more Apartments | 0 | 0.0% |
| Mobile Home / Other | 149 | 8.2% |
| Total | 1,826 | 100.0% |
Housing Structures by Occupancy in Central City
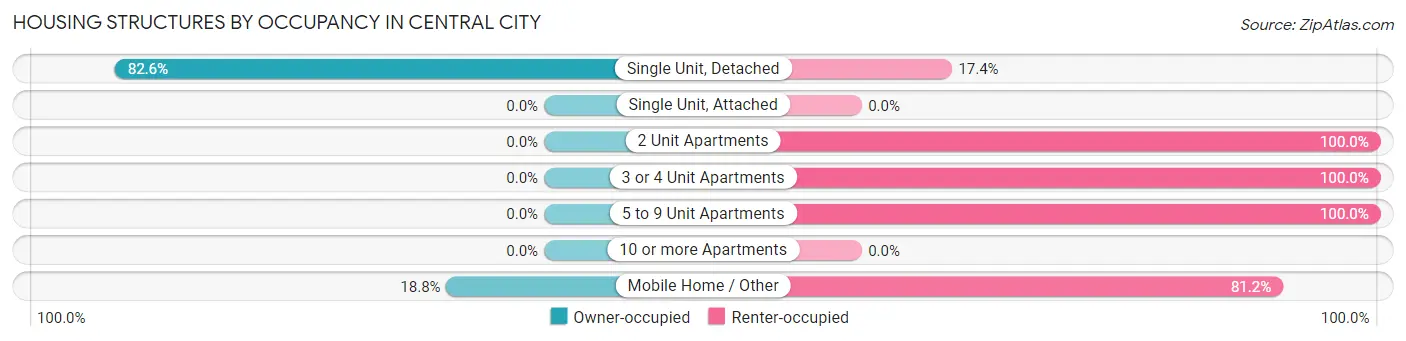
| Structure Type | Owner-occupied | Renter-occupied |
| Single Unit, Detached | 1,241 (82.6%) | 261 (17.4%) |
| Single Unit, Attached | 0 (0.0%) | 0 (0.0%) |
| 2 Unit Apartments | 0 (0.0%) | 67 (100.0%) |
| 3 or 4 Unit Apartments | 0 (0.0%) | 44 (100.0%) |
| 5 to 9 Unit Apartments | 0 (0.0%) | 64 (100.0%) |
| 10 or more Apartments | 0 (0.0%) | 0 (0.0%) |
| Mobile Home / Other | 28 (18.8%) | 121 (81.2%) |
| Total | 1,269 (69.5%) | 557 (30.5%) |
Housing Structures by Number of Rooms in Central City
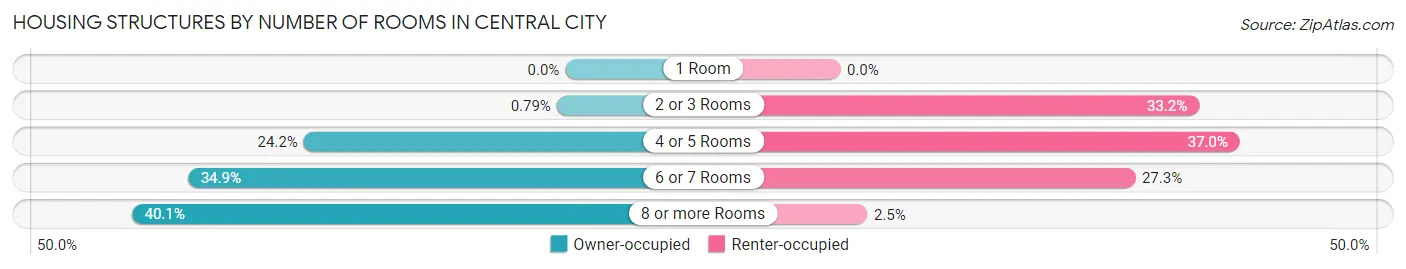
| Number of Rooms | Owner-occupied | Renter-occupied |
| 1 Room | 0 (0.0%) | 0 (0.0%) |
| 2 or 3 Rooms | 10 (0.8%) | 185 (33.2%) |
| 4 or 5 Rooms | 307 (24.2%) | 206 (37.0%) |
| 6 or 7 Rooms | 443 (34.9%) | 152 (27.3%) |
| 8 or more Rooms | 509 (40.1%) | 14 (2.5%) |
| Total | 1,269 (100.0%) | 557 (100.0%) |
Housing Structure by Heating Type in Central City
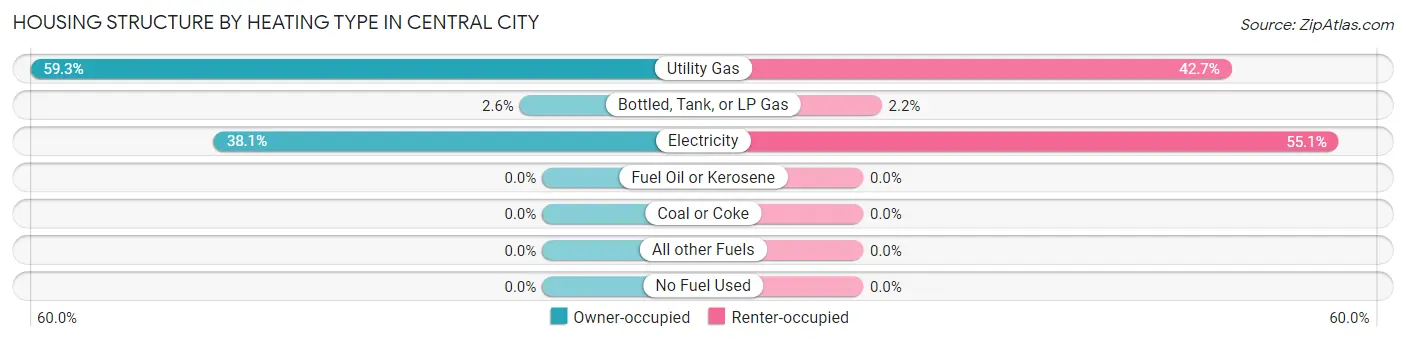
| Heating Type | Owner-occupied | Renter-occupied |
| Utility Gas | 753 (59.3%) | 238 (42.7%) |
| Bottled, Tank, or LP Gas | 33 (2.6%) | 12 (2.1%) |
| Electricity | 483 (38.1%) | 307 (55.1%) |
| Fuel Oil or Kerosene | 0 (0.0%) | 0 (0.0%) |
| Coal or Coke | 0 (0.0%) | 0 (0.0%) |
| All other Fuels | 0 (0.0%) | 0 (0.0%) |
| No Fuel Used | 0 (0.0%) | 0 (0.0%) |
| Total | 1,269 (100.0%) | 557 (100.0%) |
Household Vehicle Usage in Central City
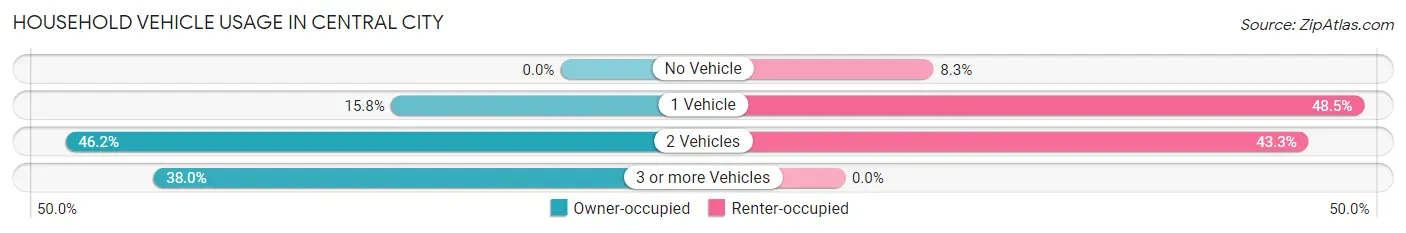
| Vehicles per Household | Owner-occupied | Renter-occupied |
| No Vehicle | 0 (0.0%) | 46 (8.3%) |
| 1 Vehicle | 201 (15.8%) | 270 (48.5%) |
| 2 Vehicles | 586 (46.2%) | 241 (43.3%) |
| 3 or more Vehicles | 482 (38.0%) | 0 (0.0%) |
| Total | 1,269 (100.0%) | 557 (100.0%) |
Real Estate & Mortgages in Central City
Real Estate and Mortgage Overview in Central City
| Characteristic | Without Mortgage | With Mortgage |
| Housing Units | 498 | 771 |
| Median Property Value | $135,000 | $163,000 |
| Median Household Income | $68,446 | $146 |
| Monthly Housing Costs | $393 | $0 |
| Real Estate Taxes | $848 | $0 |
Property Value by Mortgage Status in Central City
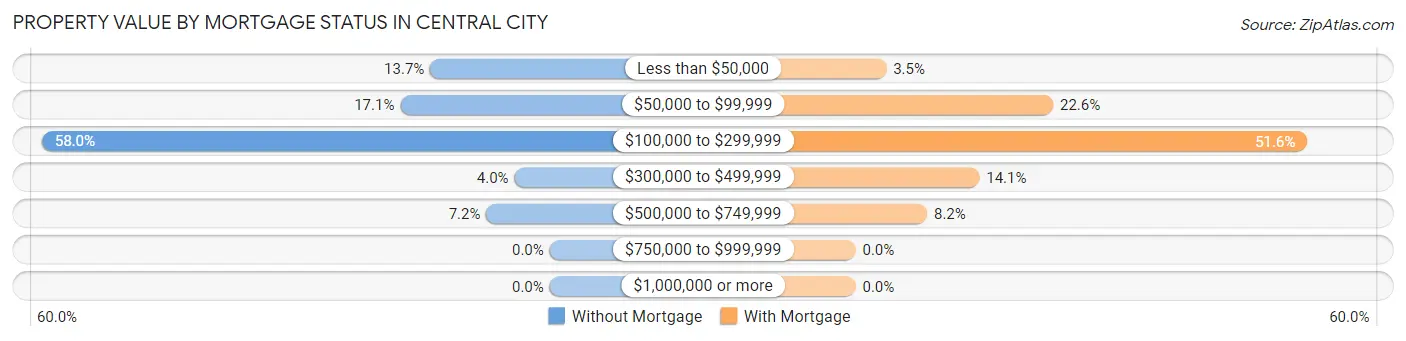
| Property Value | Without Mortgage | With Mortgage |
| Less than $50,000 | 68 (13.7%) | 27 (3.5%) |
| $50,000 to $99,999 | 85 (17.1%) | 174 (22.6%) |
| $100,000 to $299,999 | 289 (58.0%) | 398 (51.6%) |
| $300,000 to $499,999 | 20 (4.0%) | 109 (14.1%) |
| $500,000 to $749,999 | 36 (7.2%) | 63 (8.2%) |
| $750,000 to $999,999 | 0 (0.0%) | 0 (0.0%) |
| $1,000,000 or more | 0 (0.0%) | 0 (0.0%) |
| Total | 498 (100.0%) | 771 (100.0%) |
Household Income by Mortgage Status in Central City
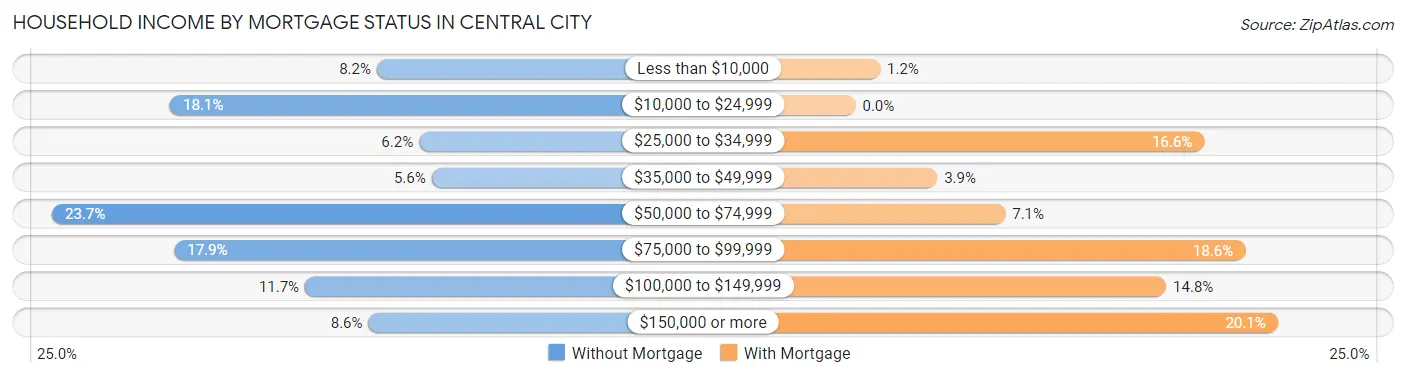
| Household Income | Without Mortgage | With Mortgage |
| Less than $10,000 | 41 (8.2%) | 9 (1.2%) |
| $10,000 to $24,999 | 90 (18.1%) | 0 (0.0%) |
| $25,000 to $34,999 | 31 (6.2%) | 128 (16.6%) |
| $35,000 to $49,999 | 28 (5.6%) | 30 (3.9%) |
| $50,000 to $74,999 | 118 (23.7%) | 55 (7.1%) |
| $75,000 to $99,999 | 89 (17.9%) | 143 (18.5%) |
| $100,000 to $149,999 | 58 (11.7%) | 114 (14.8%) |
| $150,000 or more | 43 (8.6%) | 155 (20.1%) |
| Total | 498 (100.0%) | 771 (100.0%) |
Property Value to Household Income Ratio in Central City
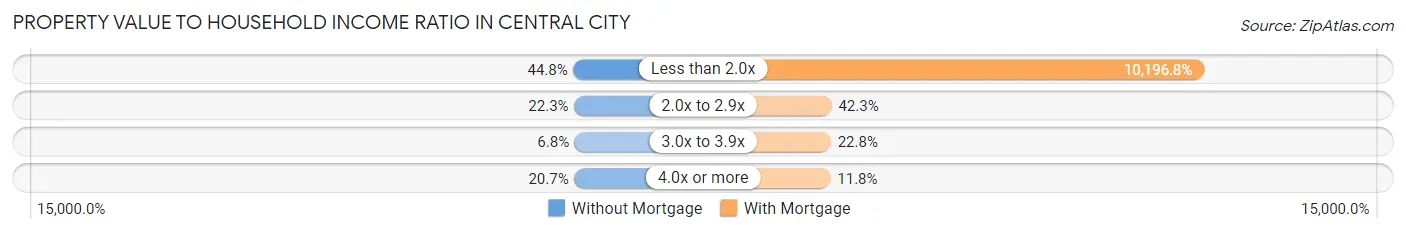
| Value-to-Income Ratio | Without Mortgage | With Mortgage |
| Less than 2.0x | 223 (44.8%) | 78,617 (10,196.8%) |
| 2.0x to 2.9x | 111 (22.3%) | 326 (42.3%) |
| 3.0x to 3.9x | 34 (6.8%) | 176 (22.8%) |
| 4.0x or more | 103 (20.7%) | 91 (11.8%) |
| Total | 498 (100.0%) | 771 (100.0%) |
Real Estate Taxes by Mortgage Status in Central City
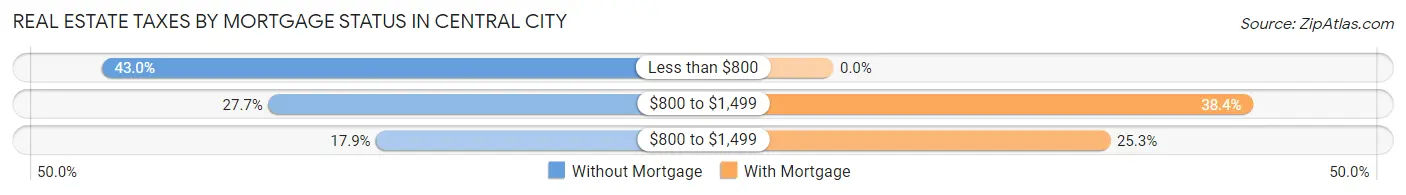
| Property Taxes | Without Mortgage | With Mortgage |
| Less than $800 | 214 (43.0%) | 0 (0.0%) |
| $800 to $1,499 | 138 (27.7%) | 296 (38.4%) |
| $800 to $1,499 | 89 (17.9%) | 195 (25.3%) |
| Total | 498 (100.0%) | 771 (100.0%) |
Health & Disability in Central City
Health Insurance Coverage by Age in Central City
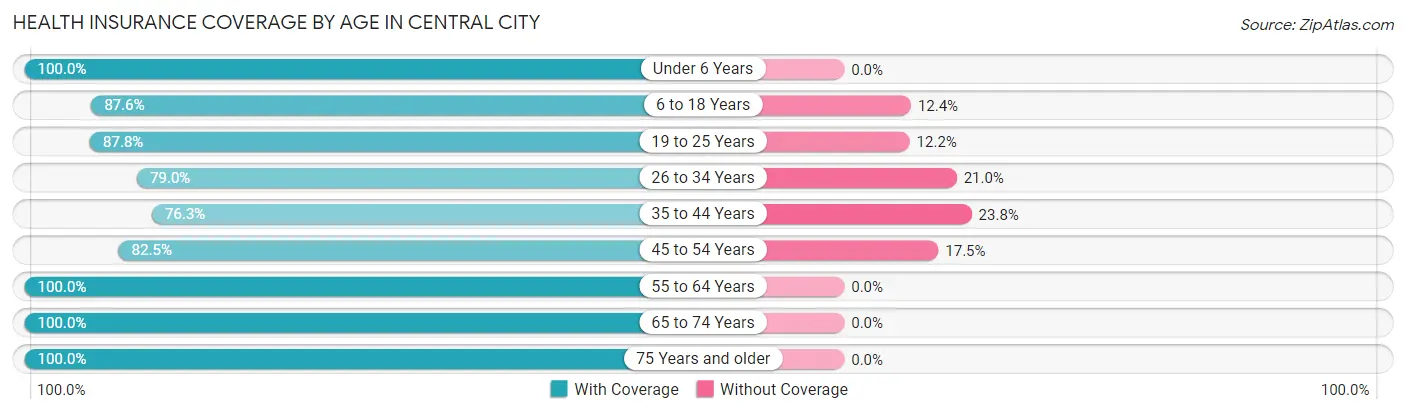
| Age Bracket | With Coverage | Without Coverage |
| Under 6 Years | 586 (100.0%) | 0 (0.0%) |
| 6 to 18 Years | 838 (87.6%) | 119 (12.4%) |
| 19 to 25 Years | 562 (87.8%) | 78 (12.2%) |
| 26 to 34 Years | 362 (79.0%) | 96 (21.0%) |
| 35 to 44 Years | 639 (76.2%) | 199 (23.7%) |
| 45 to 54 Years | 489 (82.5%) | 104 (17.5%) |
| 55 to 64 Years | 518 (100.0%) | 0 (0.0%) |
| 65 to 74 Years | 420 (100.0%) | 0 (0.0%) |
| 75 Years and older | 261 (100.0%) | 0 (0.0%) |
| Total | 4,675 (88.7%) | 596 (11.3%) |
Health Insurance Coverage by Citizenship Status in Central City
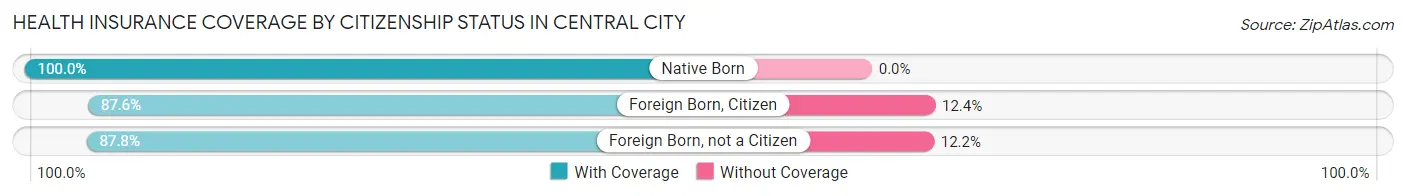
| Citizenship Status | With Coverage | Without Coverage |
| Native Born | 586 (100.0%) | 0 (0.0%) |
| Foreign Born, Citizen | 838 (87.6%) | 119 (12.4%) |
| Foreign Born, not a Citizen | 562 (87.8%) | 78 (12.2%) |
Health Insurance Coverage by Household Income in Central City
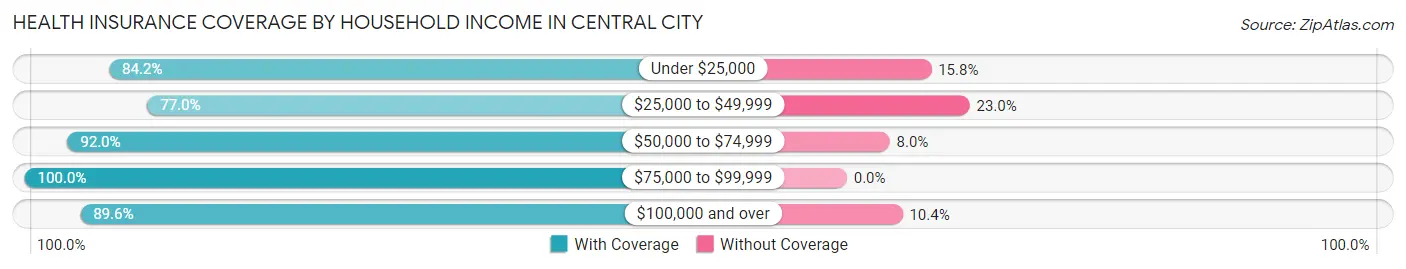
| Household Income | With Coverage | Without Coverage |
| Under $25,000 | 846 (84.2%) | 159 (15.8%) |
| $25,000 to $49,999 | 683 (77.0%) | 204 (23.0%) |
| $50,000 to $74,999 | 1,067 (92.0%) | 93 (8.0%) |
| $75,000 to $99,999 | 871 (100.0%) | 0 (0.0%) |
| $100,000 and over | 1,202 (89.6%) | 140 (10.4%) |
Public vs Private Health Insurance Coverage by Age in Central City
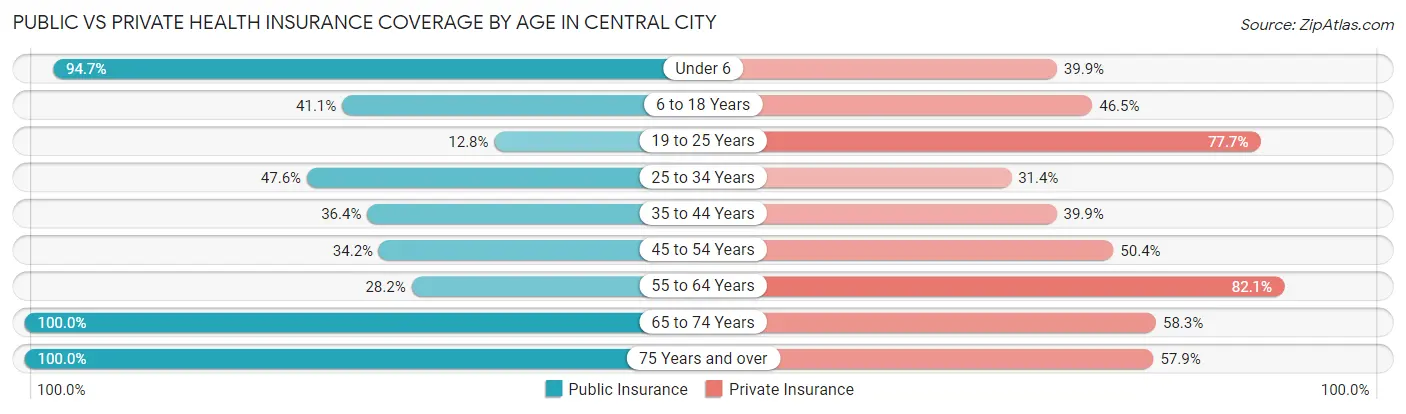
| Age Bracket | Public Insurance | Private Insurance |
| Under 6 | 555 (94.7%) | 234 (39.9%) |
| 6 to 18 Years | 393 (41.1%) | 445 (46.5%) |
| 19 to 25 Years | 82 (12.8%) | 497 (77.7%) |
| 25 to 34 Years | 218 (47.6%) | 144 (31.4%) |
| 35 to 44 Years | 305 (36.4%) | 334 (39.9%) |
| 45 to 54 Years | 203 (34.2%) | 299 (50.4%) |
| 55 to 64 Years | 146 (28.2%) | 425 (82.1%) |
| 65 to 74 Years | 420 (100.0%) | 245 (58.3%) |
| 75 Years and over | 261 (100.0%) | 151 (57.9%) |
| Total | 2,583 (49.0%) | 2,774 (52.6%) |
Disability Status by Sex by Age in Central City
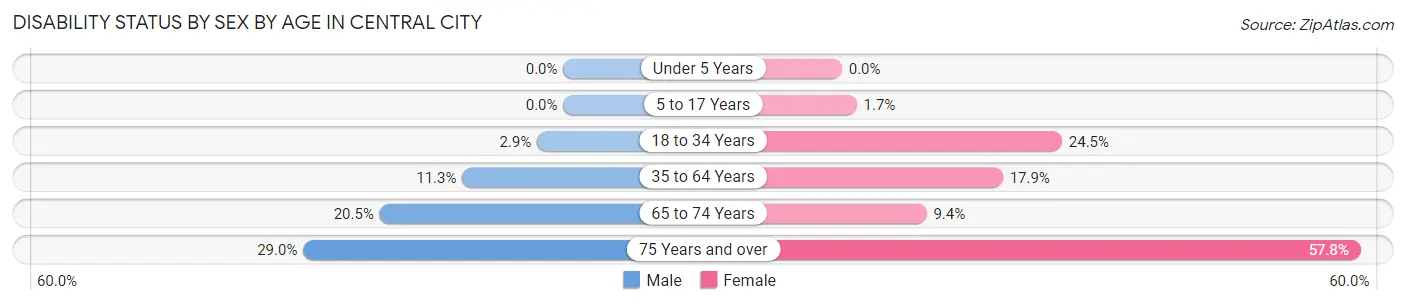
| Age Bracket | Male | Female |
| Under 5 Years | 0 (0.0%) | 0 (0.0%) |
| 5 to 17 Years | 0 (0.0%) | 9 (1.7%) |
| 18 to 34 Years | 20 (2.9%) | 125 (24.5%) |
| 35 to 64 Years | 110 (11.3%) | 174 (17.9%) |
| 65 to 74 Years | 36 (20.4%) | 23 (9.4%) |
| 75 Years and over | 31 (29.0%) | 89 (57.8%) |
Disability Class by Sex by Age in Central City
Disability Class: Hearing Difficulty
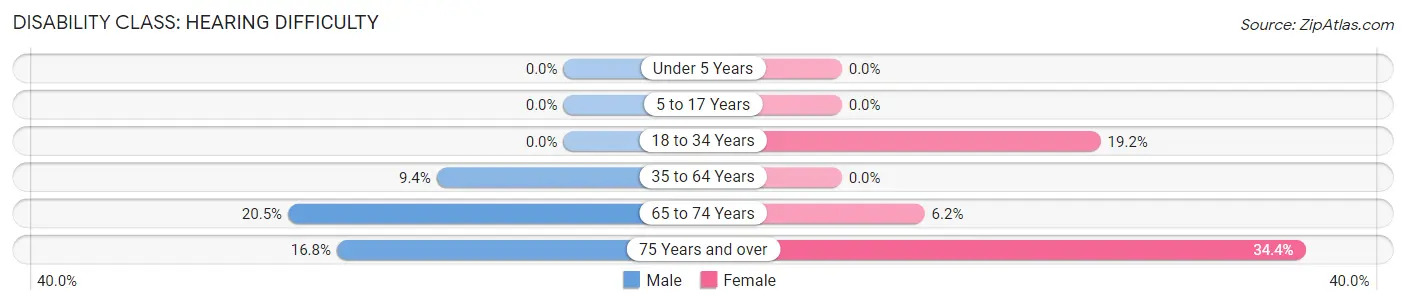
| Age Bracket | Male | Female |
| Under 5 Years | 0 (0.0%) | 0 (0.0%) |
| 5 to 17 Years | 0 (0.0%) | 0 (0.0%) |
| 18 to 34 Years | 0 (0.0%) | 98 (19.2%) |
| 35 to 64 Years | 92 (9.4%) | 0 (0.0%) |
| 65 to 74 Years | 36 (20.4%) | 15 (6.1%) |
| 75 Years and over | 18 (16.8%) | 53 (34.4%) |
Disability Class: Vision Difficulty
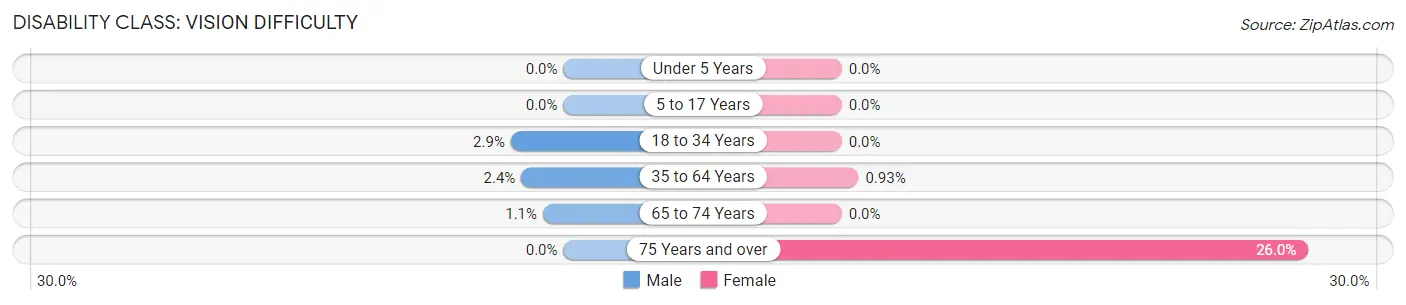
| Age Bracket | Male | Female |
| Under 5 Years | 0 (0.0%) | 0 (0.0%) |
| 5 to 17 Years | 0 (0.0%) | 0 (0.0%) |
| 18 to 34 Years | 20 (2.9%) | 0 (0.0%) |
| 35 to 64 Years | 23 (2.4%) | 9 (0.9%) |
| 65 to 74 Years | 2 (1.1%) | 0 (0.0%) |
| 75 Years and over | 0 (0.0%) | 40 (26.0%) |
Disability Class: Cognitive Difficulty
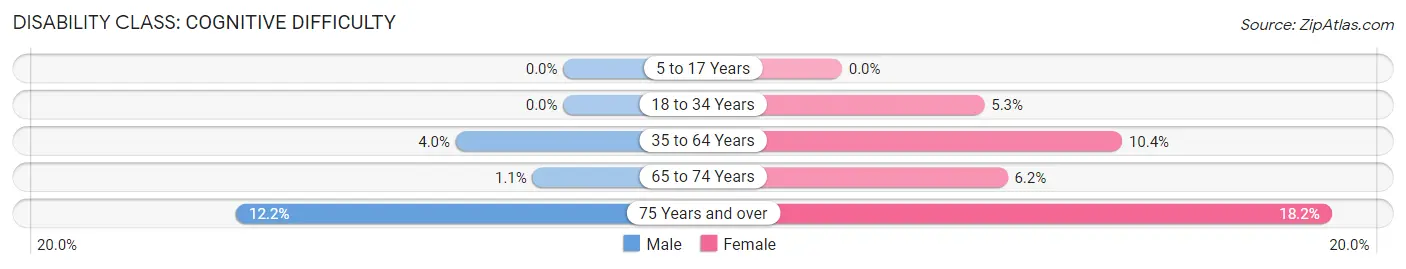
| Age Bracket | Male | Female |
| 5 to 17 Years | 0 (0.0%) | 0 (0.0%) |
| 18 to 34 Years | 0 (0.0%) | 27 (5.3%) |
| 35 to 64 Years | 39 (4.0%) | 101 (10.4%) |
| 65 to 74 Years | 2 (1.1%) | 15 (6.1%) |
| 75 Years and over | 13 (12.1%) | 28 (18.2%) |
Disability Class: Ambulatory Difficulty
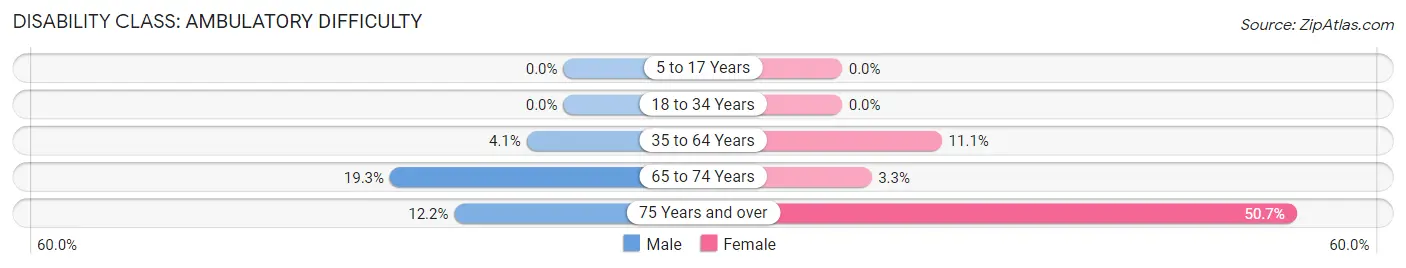
| Age Bracket | Male | Female |
| 5 to 17 Years | 0 (0.0%) | 0 (0.0%) |
| 18 to 34 Years | 0 (0.0%) | 0 (0.0%) |
| 35 to 64 Years | 40 (4.1%) | 108 (11.1%) |
| 65 to 74 Years | 34 (19.3%) | 8 (3.3%) |
| 75 Years and over | 13 (12.1%) | 78 (50.6%) |
Disability Class: Self-Care Difficulty
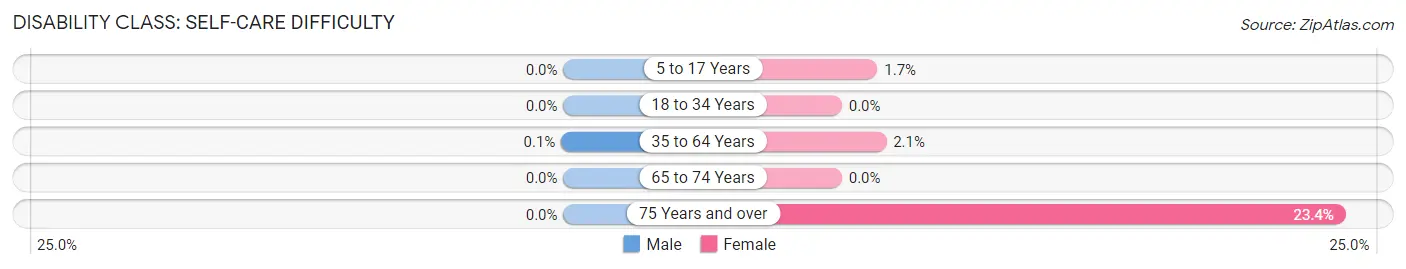
| Age Bracket | Male | Female |
| 5 to 17 Years | 0 (0.0%) | 9 (1.7%) |
| 18 to 34 Years | 0 (0.0%) | 0 (0.0%) |
| 35 to 64 Years | 1 (0.1%) | 20 (2.1%) |
| 65 to 74 Years | 0 (0.0%) | 0 (0.0%) |
| 75 Years and over | 0 (0.0%) | 36 (23.4%) |
Technology Access in Central City
Computing Device Access in Central City
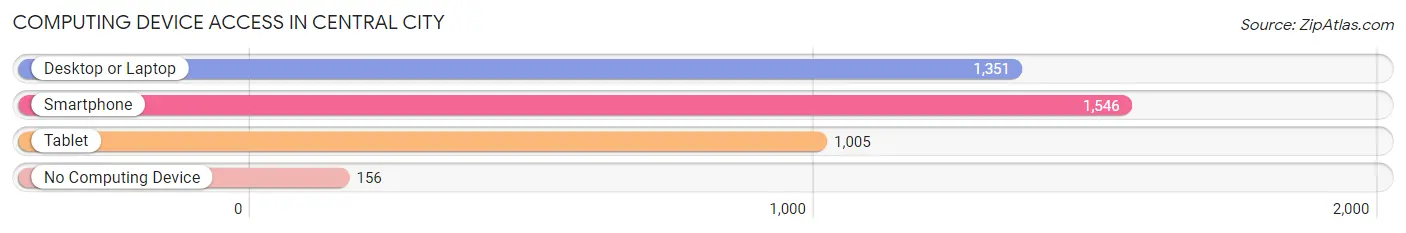
| Device Type | # Households | % Households |
| Desktop or Laptop | 1,351 | 74.0% |
| Smartphone | 1,546 | 84.7% |
| Tablet | 1,005 | 55.0% |
| No Computing Device | 156 | 8.5% |
| Total | 1,826 | 100.0% |
Internet Access in Central City
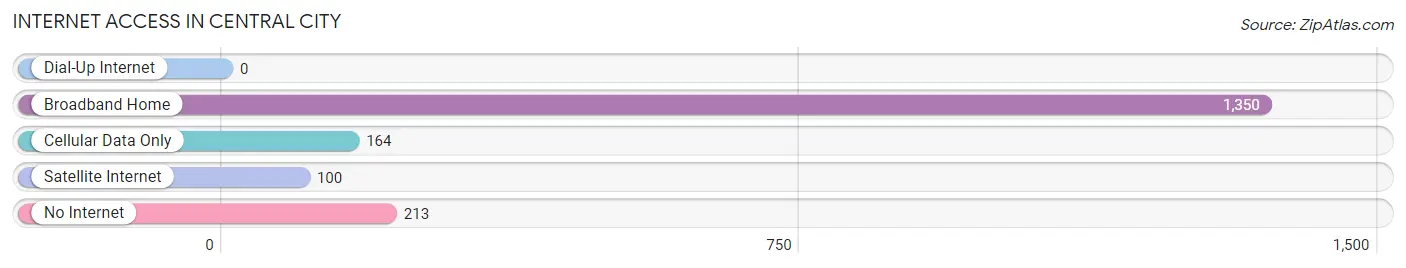
| Internet Type | # Households | % Households |
| Dial-Up Internet | 0 | 0.0% |
| Broadband Home | 1,350 | 73.9% |
| Cellular Data Only | 164 | 9.0% |
| Satellite Internet | 100 | 5.5% |
| No Internet | 213 | 11.7% |
| Total | 1,826 | 100.0% |
Central City Summary
Introduction
Central City is a small city located in Muhlenberg County, Kentucky. It is situated in the western part of the state, about halfway between Louisville and Nashville. The city has a population of approximately 5,000 people and is the county seat of Muhlenberg County. Central City is known for its rich history, diverse geography, and vibrant economy. This paper will provide an overview of Central City’s history, geography, economy, and demographics.
History
Central City was founded in 1820 by a group of settlers from Virginia. The city was originally known as “Muhlenberg Court House” and was the county seat of Muhlenberg County. The city was renamed “Central City” in 1854. The name was chosen to reflect the city’s central location in the county.
Central City has a long and rich history. During the Civil War, the city was the site of several battles, including the Battle of Central City in 1862. The city was also the site of the first public school in Muhlenberg County, which opened in 1867.
In the late 19th century, Central City experienced a period of growth and prosperity. The city was home to several businesses, including a flour mill, a sawmill, and a brickyard. The city also had a thriving tobacco industry, which was the main source of income for many of the city’s residents.
Geography
Central City is located in western Kentucky, about halfway between Louisville and Nashville. The city is situated in the Green River Valley, which is part of the Western Coal Fields region of Kentucky. The city is surrounded by rolling hills and is located near several rivers, including the Green River, the Tradewater River, and the Ohio River.
The city has a total area of 4.2 square miles, all of which is land. The city has a humid subtropical climate, with hot, humid summers and mild winters. The average annual temperature is around 60 degrees Fahrenheit.
Economy
Central City’s economy is largely based on agriculture and manufacturing. The city is home to several large manufacturing companies, including a paper mill, a steel mill, and a chemical plant. The city also has a thriving tourism industry, with several popular attractions, including the Central City Opera House and the Muhlenberg County Historical Museum.
The city’s economy is also supported by several small businesses, including restaurants, shops, and other services. The city is also home to several educational institutions, including a community college and a vocational school.
Demographics
As of the 2010 census, Central City had a population of 5,000 people. The city has a diverse population, with a mix of races and ethnicities. The majority of the population is white (76.3%), followed by African American (17.2%), Hispanic (3.2%), and Asian (2.3%).
The median household income in Central City is $31,000, and the median home value is $90,000. The city has a poverty rate of 22.3%, which is higher than the national average.
Conclusion
Central City is a small city located in western Kentucky. The city has a rich history, diverse geography, and vibrant economy. The city is home to several large manufacturing companies, as well as several small businesses and educational institutions. The city has a diverse population, with a mix of races and ethnicities. The city has a median household income of $31,000 and a median home value of $90,000.
Common Questions
What is Per Capita Income in Central City?
Per Capita income in Central City is $33,042.
What is the Median Family Income in Central City?
Median Family Income in Central City is $60,854.
What is the Median Household income in Central City?
Median Household Income in Central City is $52,184.
What is Income or Wage Gap in Central City?
Income or Wage Gap in Central City is 28.1%.
Women in Central City earn 71.9 cents for every dollar earned by a man.
What is Inequality or Gini Index in Central City?
Inequality or Gini Index in Central City is 0.58.
What is the Total Population of Central City?
Total Population of Central City is 5,740.
What is the Total Male Population of Central City?
Total Male Population of Central City is 2,995.
What is the Total Female Population of Central City?
Total Female Population of Central City is 2,745.
What is the Ratio of Males per 100 Females in Central City?
There are 109.11 Males per 100 Females in Central City.
What is the Ratio of Females per 100 Males in Central City?
There are 91.65 Females per 100 Males in Central City.
What is the Median Population Age in Central City?
Median Population Age in Central City is 33.5 Years.
What is the Average Family Size in Central City
Average Family Size in Central City is 3.3 People.
What is the Average Household Size in Central City
Average Household Size in Central City is 2.9 People.
How Large is the Labor Force in Central City?
There are 2,466 People in the Labor Forcein in Central City.
What is the Percentage of People in the Labor Force in Central City?
55.5% of People are in the Labor Force in Central City.
What is the Unemployment Rate in Central City?
Unemployment Rate in Central City is 5.0%.